Momentum Trading Strategy

Notes

Chart Setups & Entries

When and where to buy a stock you have already found: chart patterns, buy points and entry tactics.

Showing 121–140 of 185 notes

View on Substack ↗

How to Buy Pullbacks in Strong Stocks (SNDK Example)

If you're a swing trader, one of the highest probability opportunities is buying pullbacks in leading stocks.

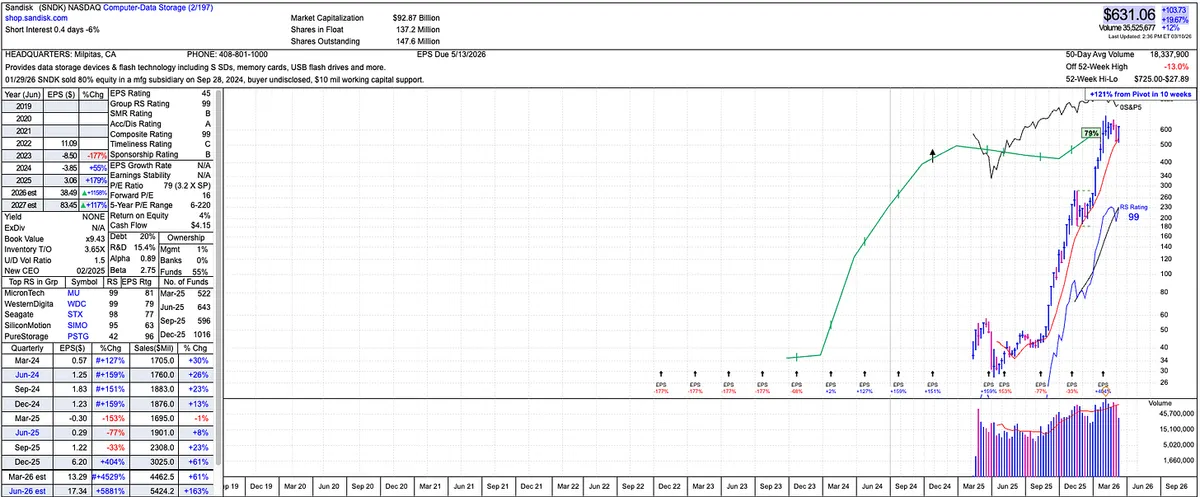
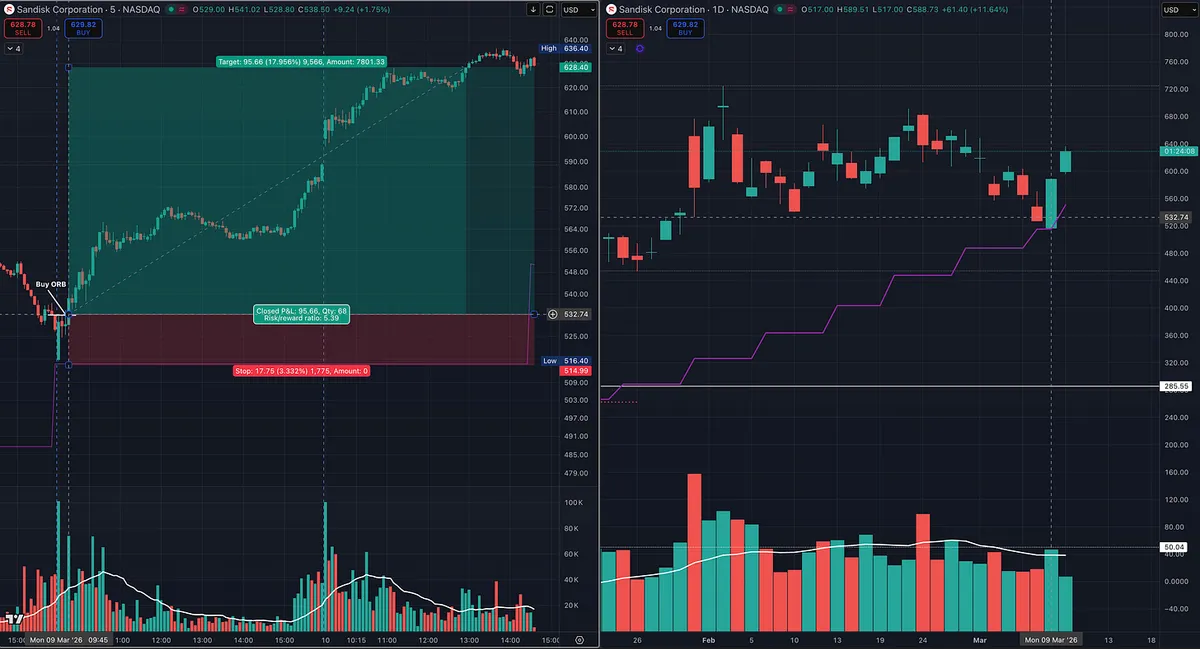
A good example right now is SNDK.

Over the past year SNDK has been a huge winner and it sits inside a very strong industry group: Computer Data Storage. When leadership groups are hot, the best strategy is usually simple.

Don’t argue with the trend. Trade with it.

Looking at the weekly chart, price has repeatedly respected the 10-week moving average, pulling back to support and then continuing higher. When a stock behaves like this, the playbook becomes straightforward:

Wait for the pullback.

Wait for support.

Then look for an entry trigger.

That’s exactly what happened here.

Before the open we saw the overall market approaching the 200-day moving average in futures. When the market found support at that level, strong stocks started to respond.

At the same time SNDK was sitting right on its 10-week support area.

That created the setup.

Instead of guessing, we waited for a tactical entry using an Opening Range Breakout, a strategy popularized by traders like Quallamaggie and Dan Zanger.

The trade was simple:

• Entry: Opening range breakout

• Risk: stop at opening range low ~3%

• Current move: ~18%

That’s roughly 5x the initial risk.

When you get a move like that, you now have choices.

You can:

• Take partial profits into strength

• Move stops higher

• Let the remaining position run

One approach is to sell some shares into strength and let the rest ride, effectively financing the remainder of the trade.

Another important lesson from this example is multi-timeframe analysis.

The weekly and daily charts provide the setup. The daily and intraday charts provide the execution.

This allows you to combine institutional trend structure with tactical entries, which is where many swing traders gain their edge.

And remember something important.

This is not a random small cap or pump-and-dump stock.

SNDK is a true growth name with strong fundamentals and massive forward estimates for earnings and sales growth. Just look at the earnings and sales on the chart!

When growth stocks in leading groups pull back to support, the goal isn’t to predict when the run will end.

It’s simply to take the setup while it works.

Because the truth is, the moment a hot sector pulls back, the commentary always starts:

“It’s extended.” “It’s overvalued.” “The run is over.”

Eventually that will be true.

But guessing when that happens costs traders enormous opportunity.

I was telling our members in the Substack Chat to keep an eye on SNDK and this is exactly why.

With setups like this we can be wrong 70% of the time and still come out ahead.

Instead, a better approach is simple:

Keep taking the setups until they stop working.
View on Substack ↗

The Low Cheat Entry That Gets You In Before the Breakout

Most traders wait for the obvious breakout.

But some of the best entries happen before the breakout even forms.

Mark Minervini calls one of these early entries the Low Cheat.

The setup forms in the lower third of a base, which makes it slightly riskier than buying a traditional pivot near the highs.

But the tradeoff is powerful.

You get earlier entry and better risk/reward.

Here’s what the pattern usually looks like:

1️⃣ A strong stock in a Stage 2 uptrend pulls back in an intermediate correction.

2️⃣ Price begins moving up the right side of the base but stalls due to overhead supply.

3️⃣ The stock forms a tight plateau area.

4️⃣ Volume dries up and price tightens. This indicates a selling vacuum, where supply has largely disappeared.

When price pushes above that tight area, the Low Cheat entry triggers.

Two important things about this setup:

• It fails more often than classic breakouts

• But when it works, the reward can be much larger

Why?

Because you are entering before the obvious breakout that everyone else sees.

Minervini often uses the Low Cheat to start a position early, then adds shares later as the stock forms additional pivot points at higher prices.

This allows you to scale into strength instead of chasing it.

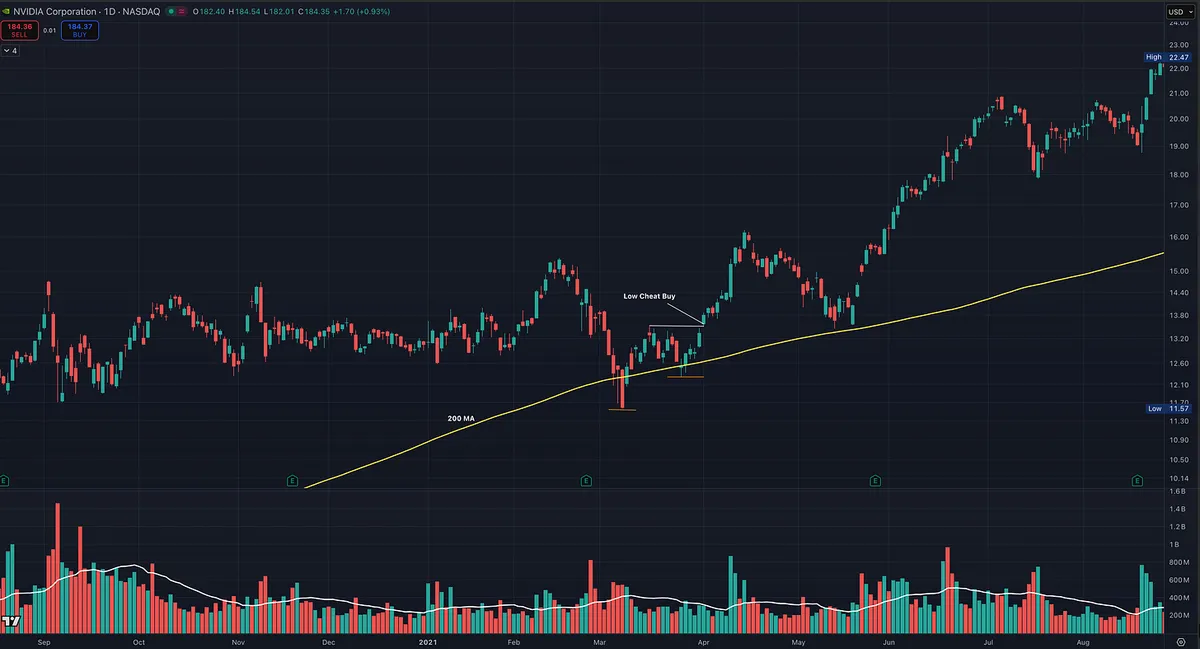
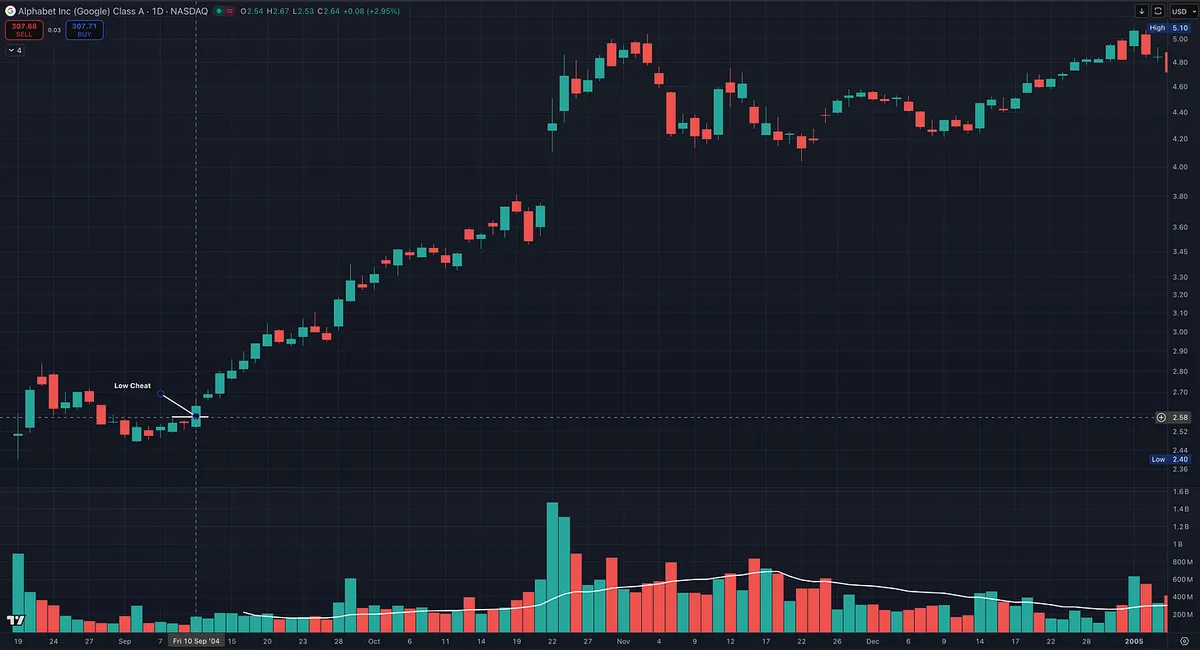
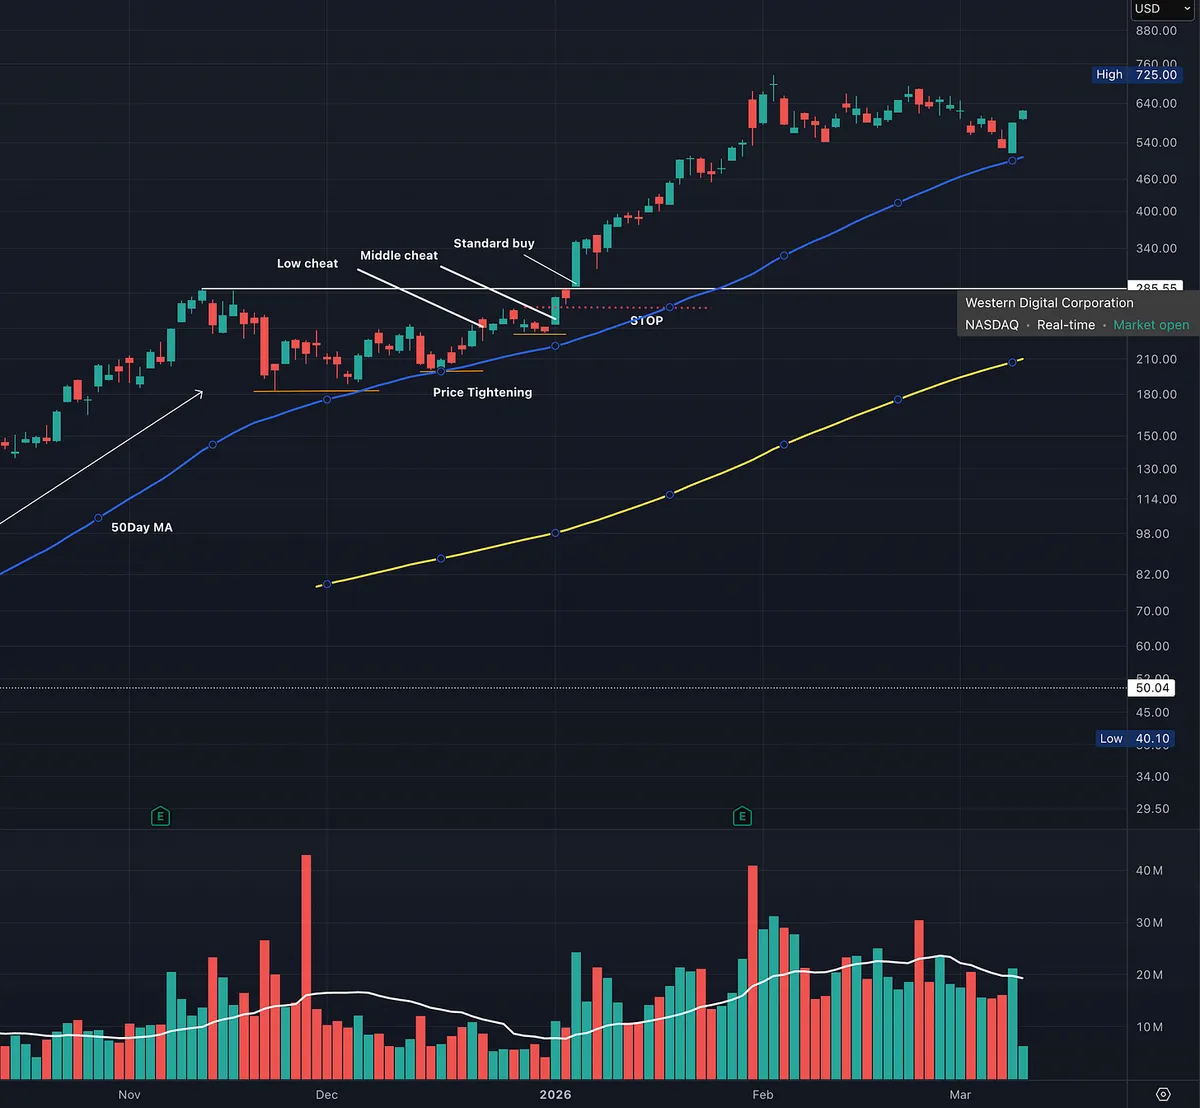
The charts attached show examples:

• A Low Cheat during a base

• A Low Cheat after an IPO

• How traders often scale in: Low Cheat → Middle Cheat → Breakout

Notice the common ingredients:

tight price action volume drying up and small shakeouts that remove weak holders before the move begins.

Once you train your eye to see it, the Low Cheat becomes one of the most useful early entries in growth stock trading.

View on Substack ↗

A Clean Example of an EP + Opening Range Breakout

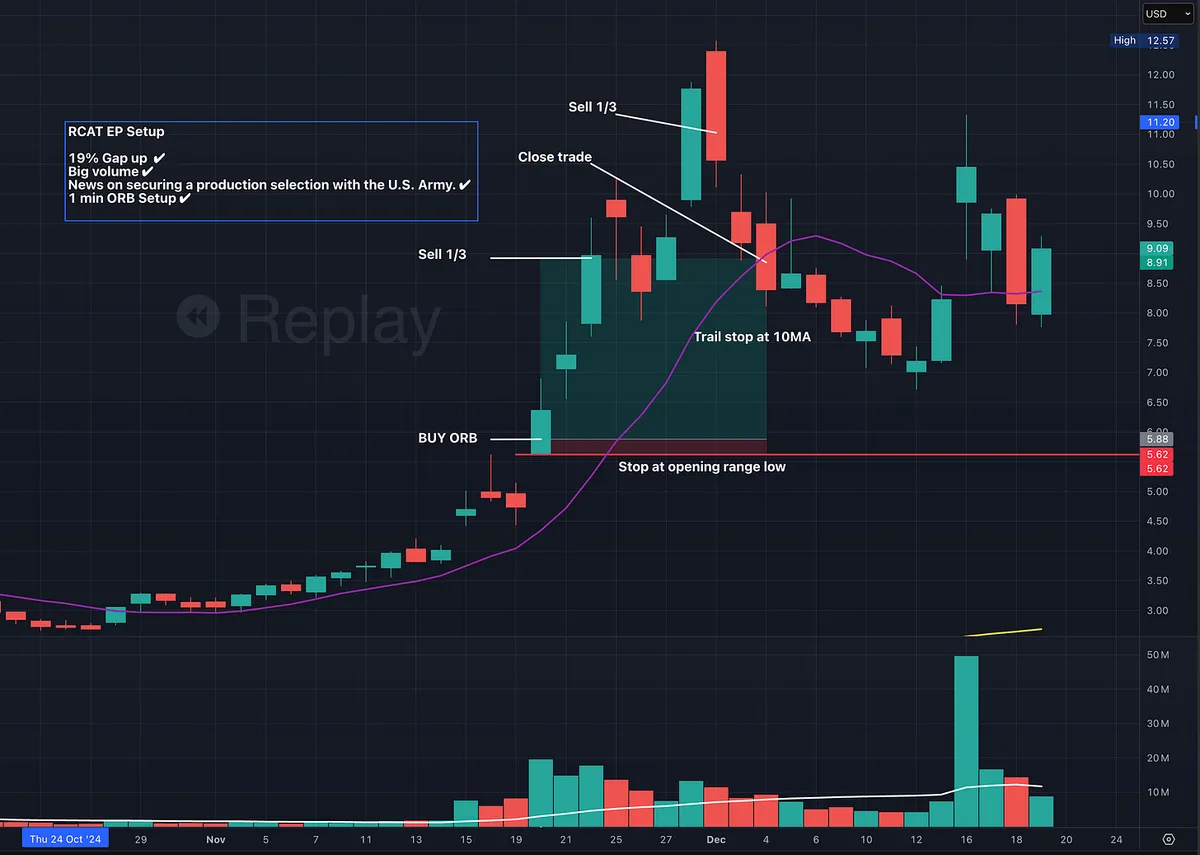
Had a few people ask questions after the recent post about EP setups and Opening Range Breakouts, so here is another example using RCAT.

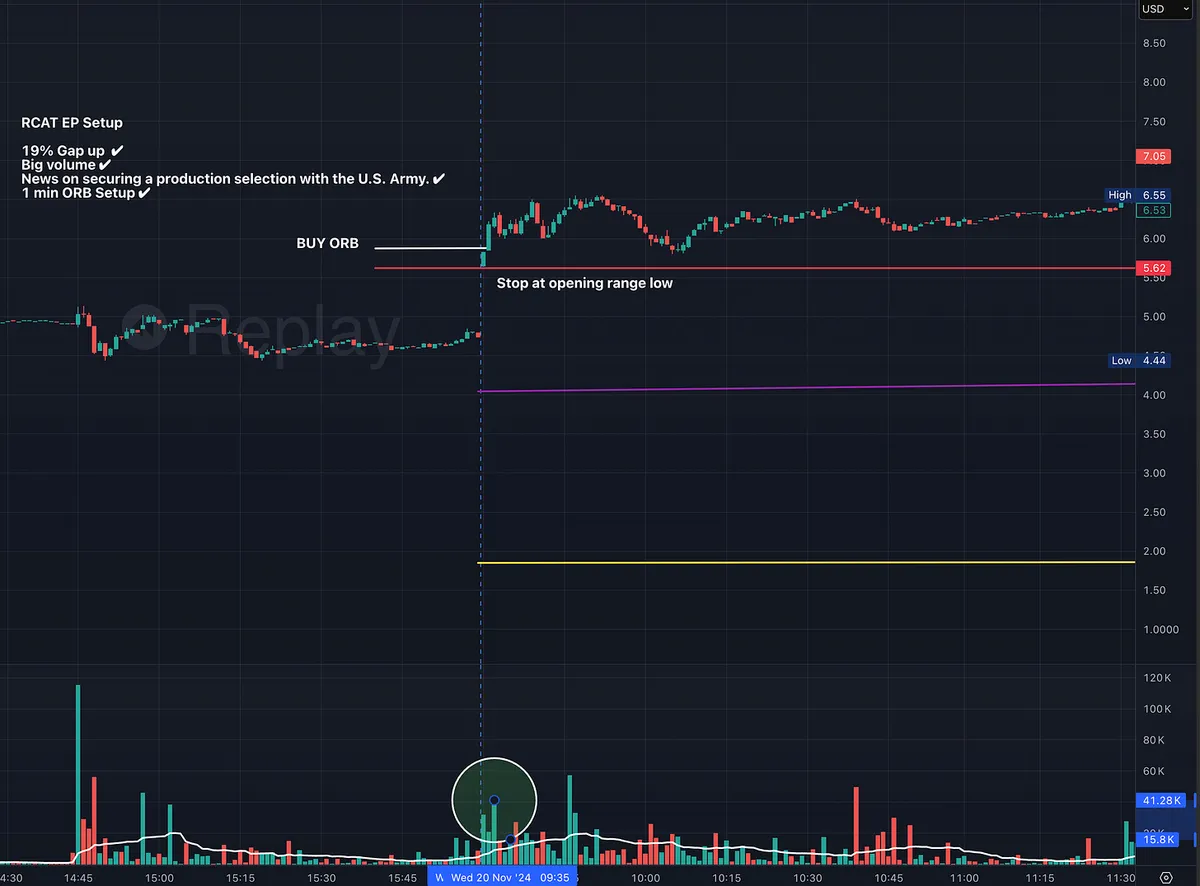
RCAT gapped up 19% after news the night before that the company had secured a production contract with the U.S. Army.

This is exactly the type of catalyst that creates an EP (Event/Earnings Play).

You would typically spot this during your premarket scan, then read the news and build a plan before the open.

The key criteria were all there:

✔ Gap of 10% or more

✔ Huge volume

✔ Major news catalyst

✔ Momentum moving into the open

Because of the massive volume coming in, this was a perfect candidate for a 1-minute Opening Range Breakout (ORB).

The plan is simple.

Enter on the break of the opening range high and place the stop at the opening range low.

From there, the goal is simply to manage the position as the move unfolds.

Both Kristjan Kullamägi and Mark Minervini talk about selling into strength on large momentum moves.

In this example the trade could be managed like this:

• Sell 1/3 into strength after the first strong push

• Sell another 1/3 on a major reversal bar after the extension

• Let the final 1/3 run and trail a stop using the 10 or 20-day moving average

For beginners, Kullamägi often suggests using the 10-day moving average and waiting for a close below it.

This keeps you in the trend while protecting the majority of the move.

In this example:

• First 1/3 captured roughly 11x the initial risk

• Second 1/3 captured roughly 20x the initial risk

• Final 1/3 exited on the 10-day moving average break

This is the power of high momentum EP setups combined with tight initial risk.

The initial stop is small.

But when the move works, the reward can be many multiples of that risk.

And that is exactly what professional momentum traders are trying to achieve.

If you haven’t read the full breakdown of these setups yet, you can read it here: https://tradingmomentum.substack.com/p/the-3-trading-setups-that-turned

ArticleThe 3 Trading Setups That Turned Kristjan Kullamägi From Security Guard to $100M Trader
View on Substack ↗

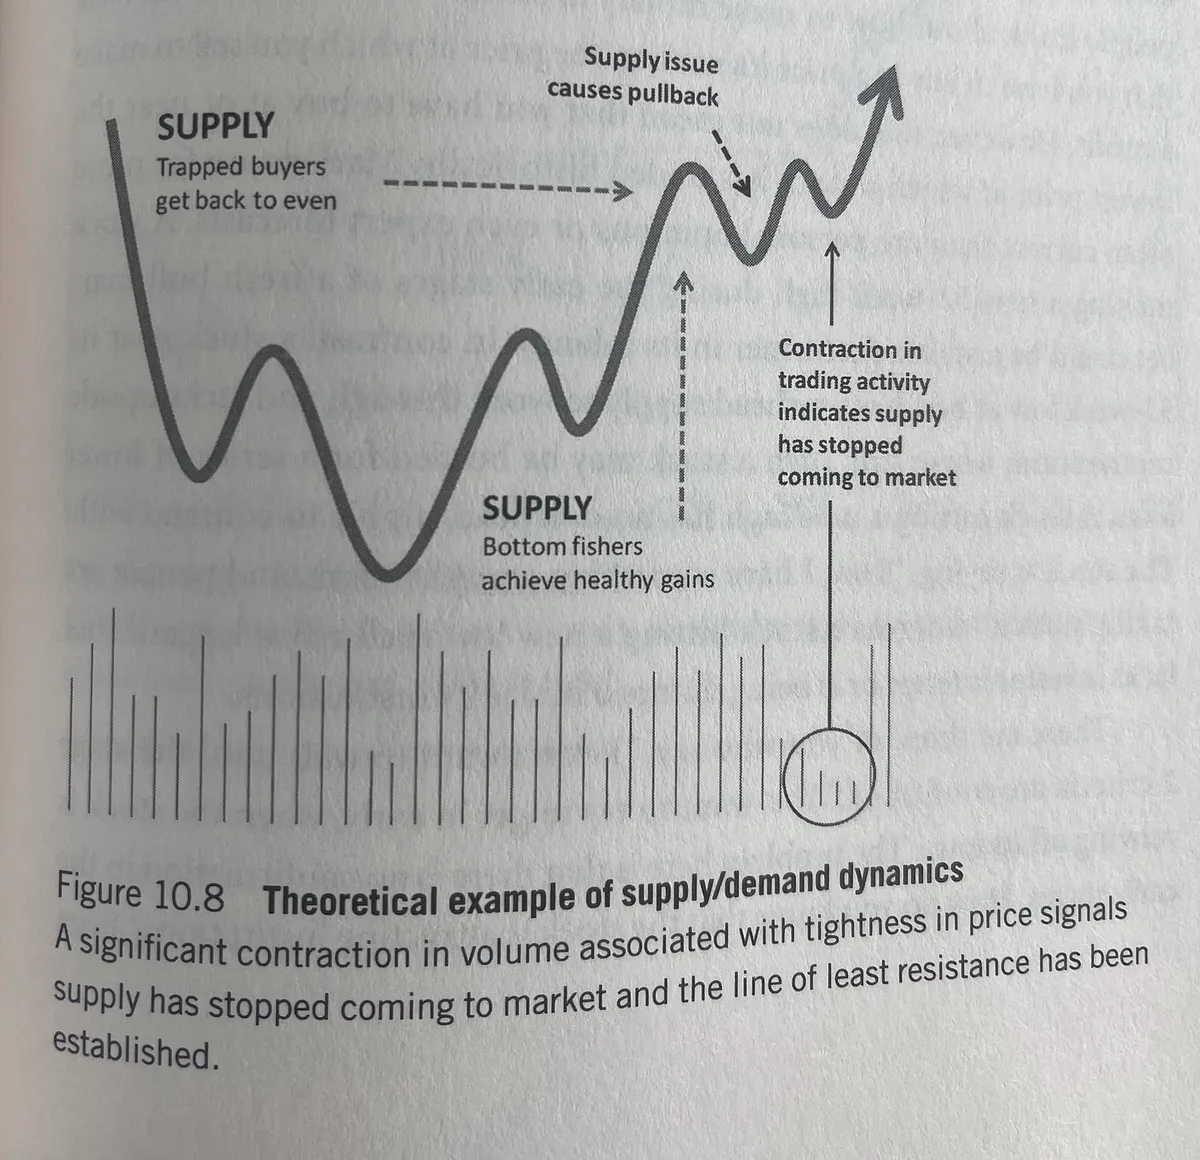
An Example of the Supply and Demand Dynamics a Stock Goes Through

A concept from Think & Trade Like a Champion by Mark Minervini.

“As a trader using a stop-loss, you are a weak holder. The key is to be the last weak holder; you want as many of the weak hands as possible to exit the stock before you buy.” — Mark Minervini

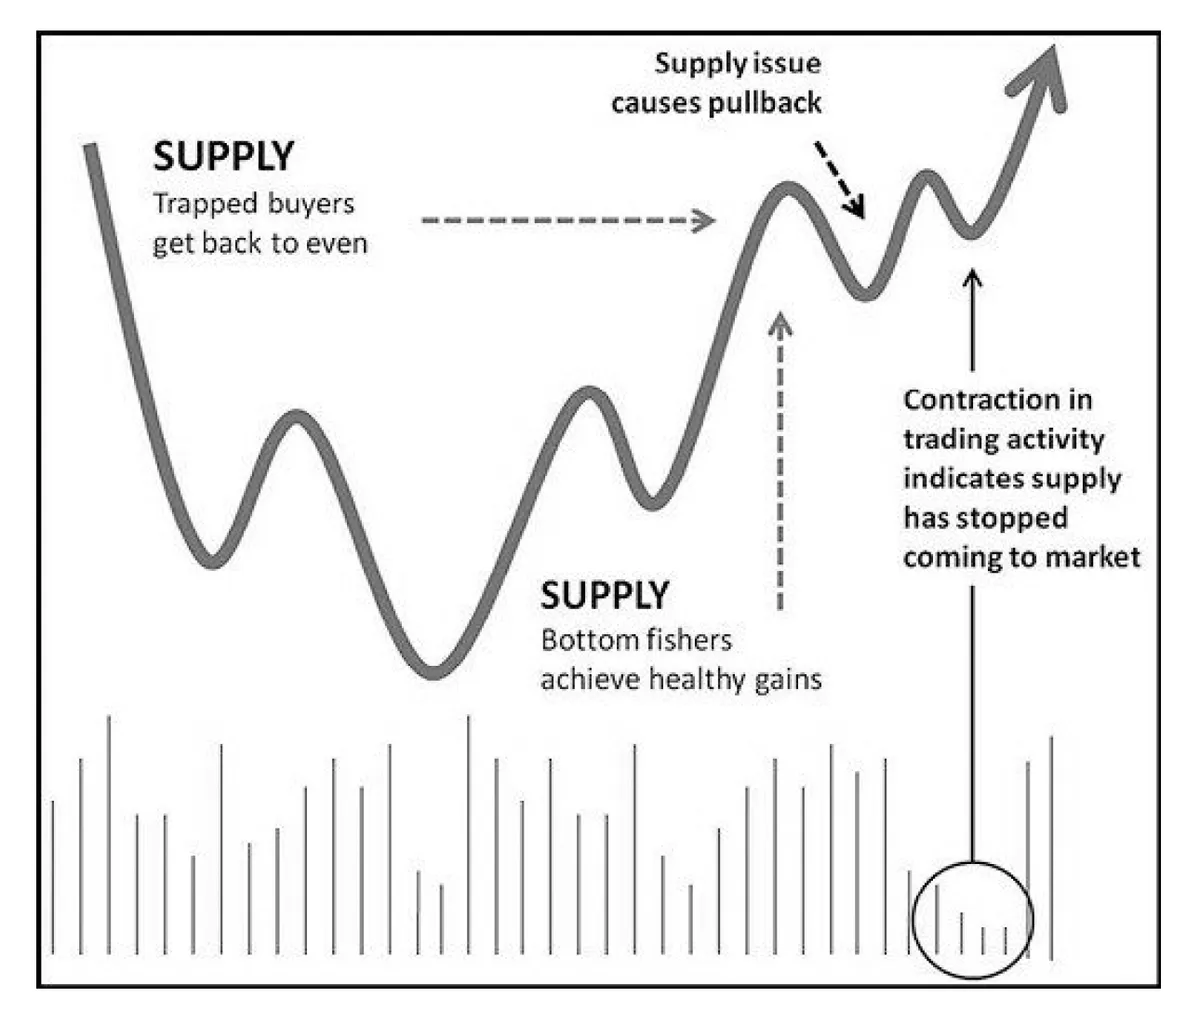
Inside every base there is a battle between supply and demand.

After a decline, many investors are trapped at higher prices. When the stock rallies back toward their entry, they sell just to get out even.

That selling creates supply.

Early buyers who caught the bottom may also take profits as the stock moves higher.

Each rally shakes out more weak holders.

If institutions are accumulating shares, the pullbacks begin to get smaller and trading activity contracts as supply dries up.

By the time the stock is ready to move higher, most of the weak hands are already gone.

That is when the path of least resistance becomes up.

View on Substack ↗

Wait for Stage 2

“The perfect time to enter the stock is when it breaks out above resistance.” — Stan Weinstein

A timeless reminder.

The best trades do not happen when a stock is falling.

They happen when a stock completes a base and breaks out into a new Stage 2 advance.

That is when probability shifts in your favor.

Patience is part of the strategy.

The goal is not to catch every move.

The goal is to catch the right stage of the move.

View on Substack ↗

A Nice Example of a Cup Base Breakout

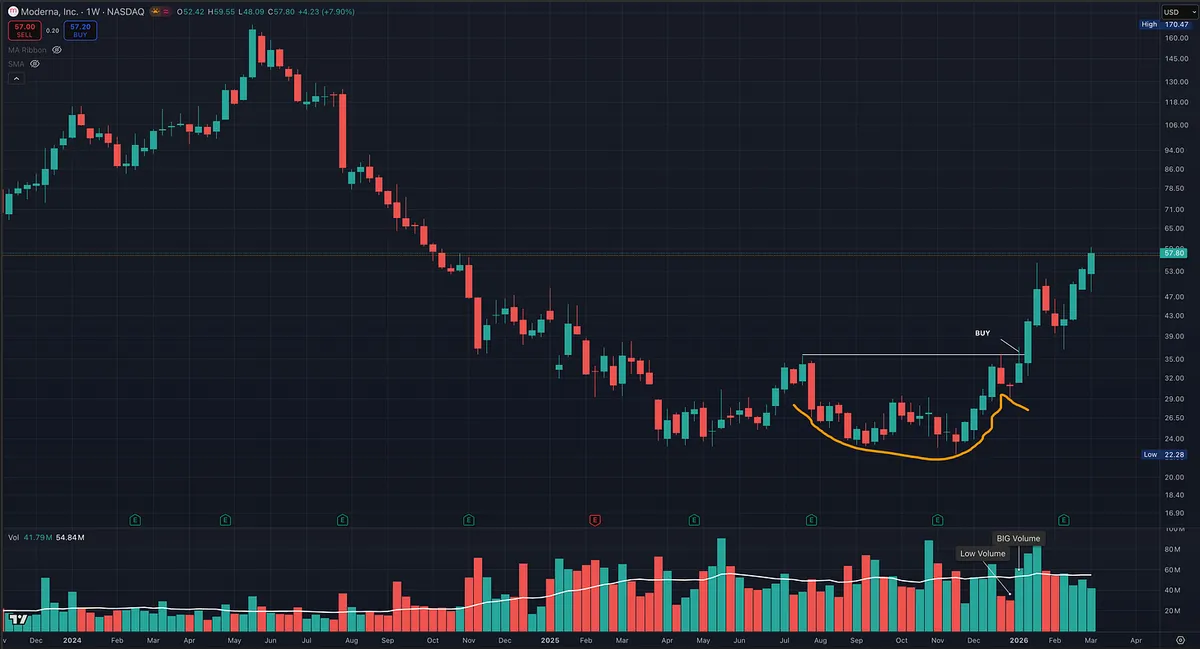
MRNA recently formed a cup base on the weekly chart that showed some solid volume characteristics.

First, volume began expanding off the bottom of the base as price climbed the right side. That’s often the first sign institutions are stepping in.

As price approached the prior high, it formed a short handle, drifting slightly lower on light volume.

That low-volume pullback is important because it shows supply drying up.

When price moved back toward the highs, it broke out on strong volume, confirming demand had taken control.

Now, MRNA didn’t have the earnings and sales growth we typically look for in leading stocks, but technically it was a great example of how we look for low-risk, high-reward entries.

Defined structure. Clear pivot. Logical stop.

So far the move has produced roughly 3–5 times the initial risk, depending on stop placement.

That’s the goal.

Not predicting.

Simply recognizing when supply dries up and demand takes control.

View on Substack ↗

The Pullback That Steals Your Future Gains

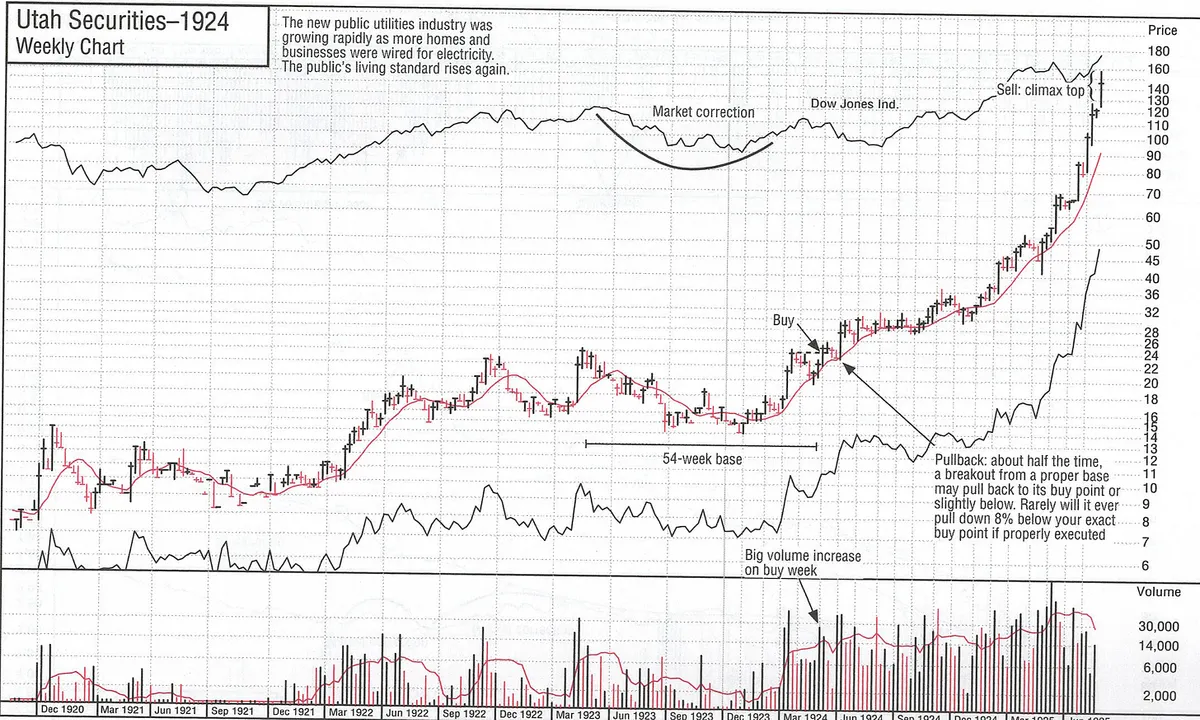
This chart is from 1924.

Different decade. Same mistake.

Look at the breakout.

Massive volume. Clear base. Institutions step in.

Then the stock pulls back into the buy zone.

Not breaking the pattern. Not violating the stop. Just pulling back enough to trigger fear.

This is where most traders sell.

They bought the breakout. They see red. They think, “I knew it. False breakout.”

So they exit.

Then the stock tightens.

Volume dries up.

And it begins a relentless advance.

The move they wanted. Without them.

William O’Neil studied over 1,000 of the greatest winners in history.

He found that about half the time, a proper breakout will retest the pivot or slightly undercut it.

Rarely will it drop more than 7 to 8 percent if properly bought.

That pullback is not failure.

It is a test.

The amateurs react to discomfort.

The pros react to rules.

The market has not changed in 100 years.

Human nature has not changed in 100 years.

The only question is:

Are you trading emotions… or a system?

Press winners. Cut losers.

View on Substack ↗

The Secret Signature of Superperformance

Why the Tightest Stocks Often Win the Biggest

If you could spot a future monster stock before it makes its real move, would you?

Not because someone tipped you. Not because it “looks cheap.” But because the structure is telling you something.

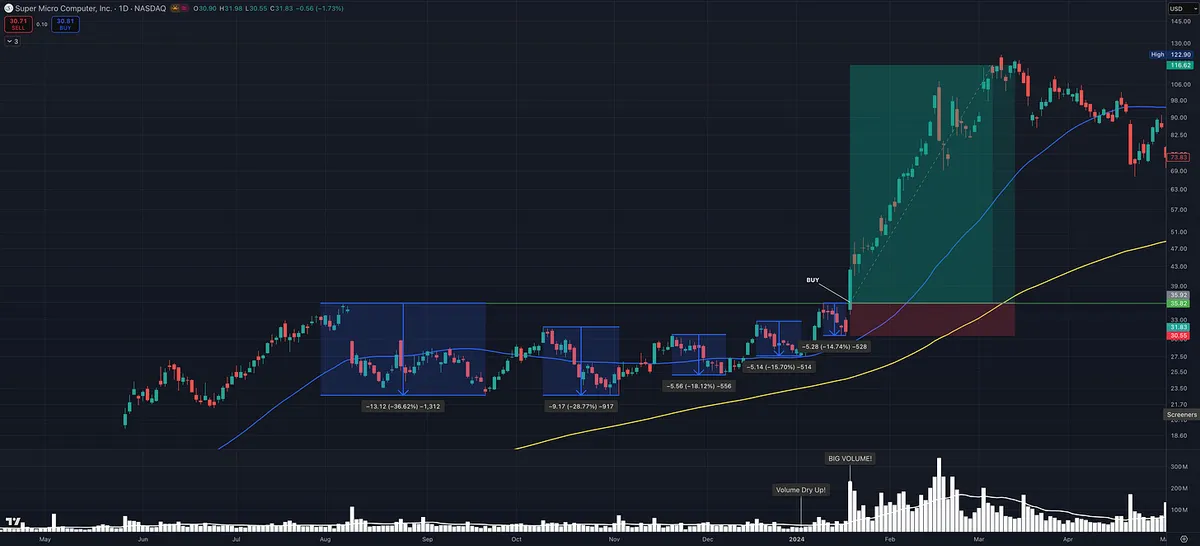
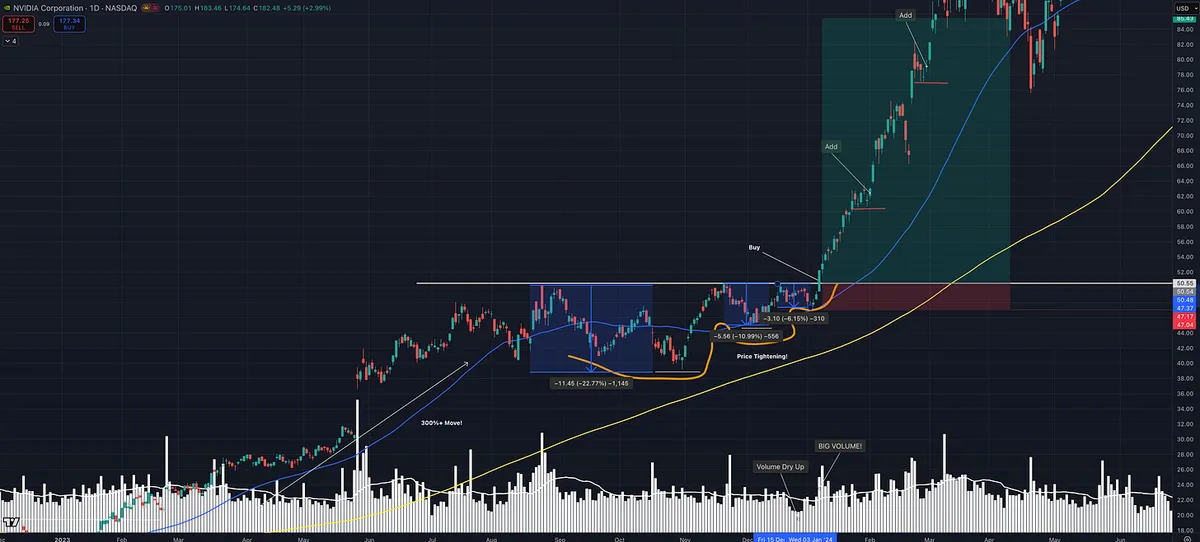
In Think & Trade Like a Champion, Mark Minervini explains that before explosive breakouts, the best stocks often go through a Volatility Contraction Pattern, or VCP.

Here is the key:

As price moves up the right side of a base, each pullback gets smaller.

The first drop might be 25 percent. The next 15 percent. Then 8 percent. Then maybe just 5 percent.

Each contraction is tighter than the one before.

That tightening is not random. It is supply drying up.

Weak holders get shaken out early. Stronger hands step in. Sellers become scarce.

The stock begins to coil.

A VCP is like a stock’s individual fingerprint. They all share the same core characteristics, but no two look exactly alike. Some have two contractions. Some have five. Some are deep early and tighten dramatically. Others are shallow the whole way through.

But the DNA is the same:

  • Higher lows

  • Declining volatility

  • Volume drying up near the pivot

  • Tight closes near the highs

The stock is under quiet accumulation.

When price finally pushes through the pivot on expanding volume, it often does so with force because there is simply less supply left to absorb demand.

You are not buying noise. You are buying compression.

And compression, when aligned with strong fundamentals and a healthy market, is often the launchpad for superperformance.

Study the contractions. Respect the tightening. Every great winner leaves clues before it runs.

View on Substack ↗

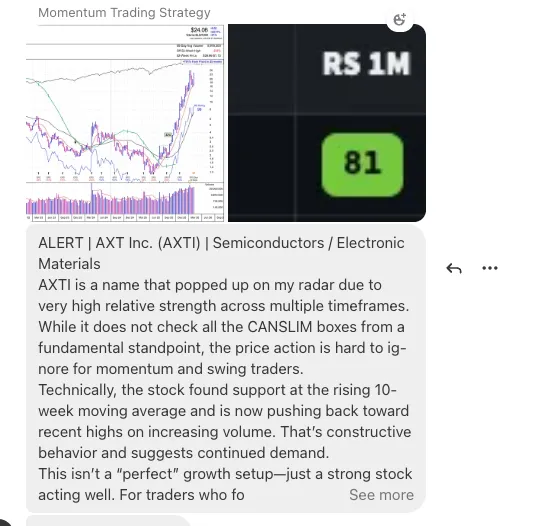
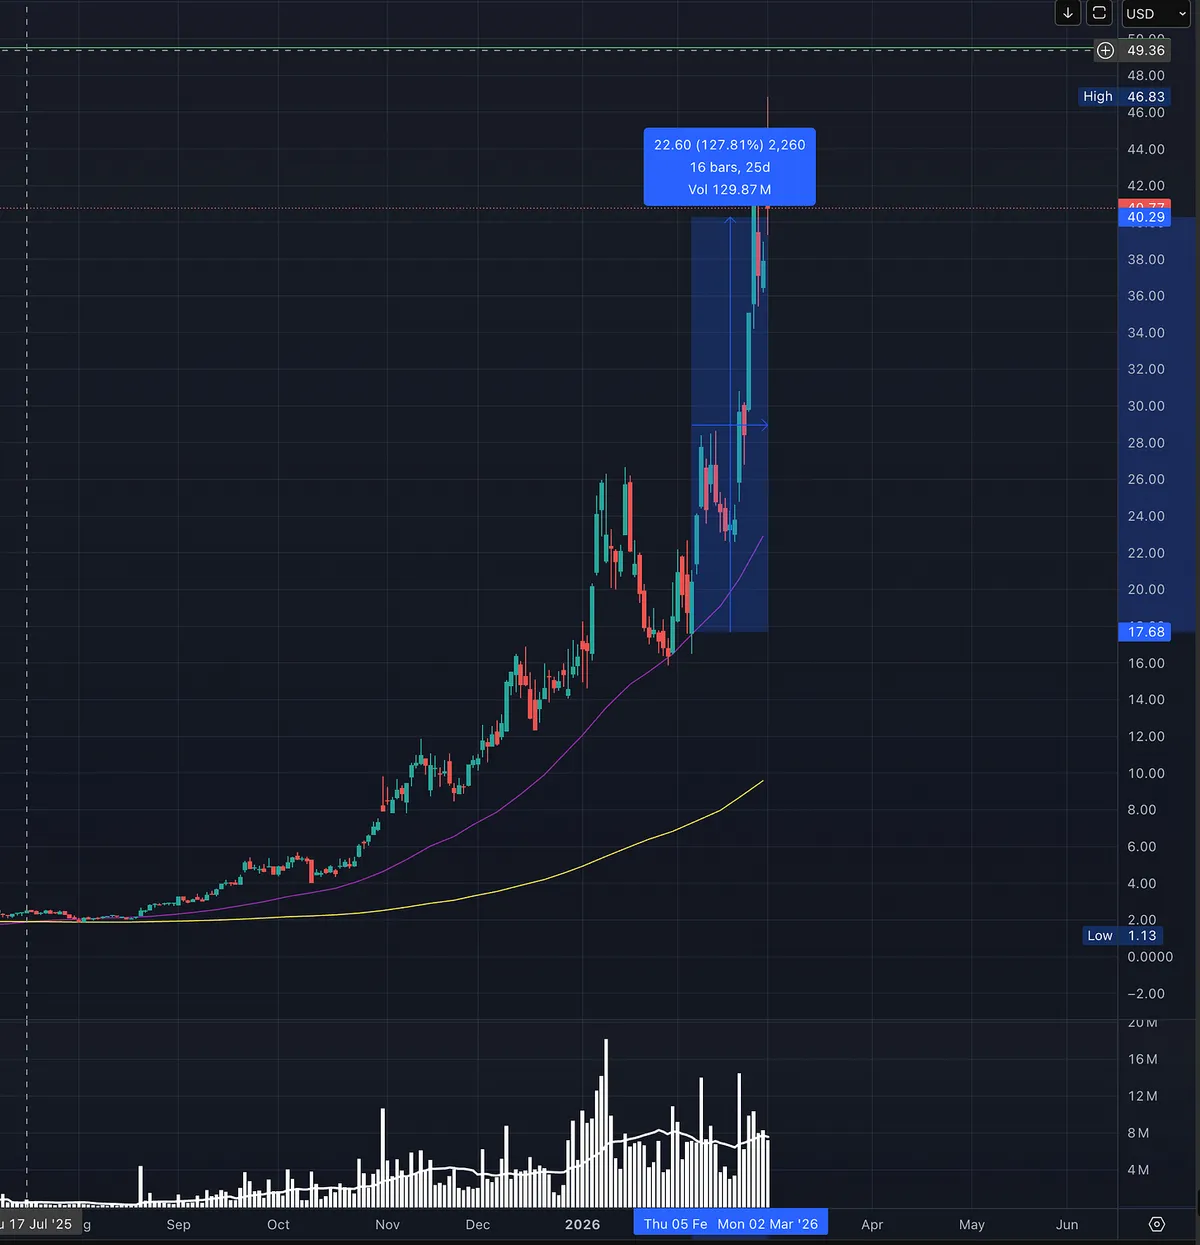
AXTI Is Up 127% Since I Flagged It in Chat

On February 5th, I mentioned AXT Inc. to paid subscribers in the chat.

Why?

It was showing up on my Relative Strength screener and pulling back to a key moving average that had been supporting price.

Nothing fancy.

No crystal ball.

Just strength plus constructive pullback.

Since then, the stock is up 127 percent.

Am I some stock picking guru?

Absolutely not.

I learned from people far more successful and intelligent than me. I just follow the process.

Here’s the truth most people do not want to hear.

I have more losers than winners.

The difference?

My winners pay for the losers and then some.

Bottom line.

I cut my losses short.

And I let my winners run.

That is the entire game.

View on Substack ↗

Stanley Druckenmiller on Volatility and Entries

Druckenmiller admits today’s markets are more violent:

“I'd rather just have nice, calm markets that move in a direction…”

But he makes clear volatility is not the problem:

“…it creates opportunities and you have to use the volatility as opposed to being abused by the volatility… you can't let yourself be a victim of volatility and you can take advantage of it.”

And the key line for traders:

“The violence that creates is more useful for entry points if it goes against what my belief over the given time frame is.”

For growth traders, that means:

If the stock is acting right overall, short term shakeouts and volatility can create better entries.

This is very O’Neil.

Strong stock. Proper setup. Volatility pulls it in. You execute.

Same trend. Better entry. Defined risk.

Volatility does not change the direction. It gives you a chance to get in correctly.

View on Substack ↗

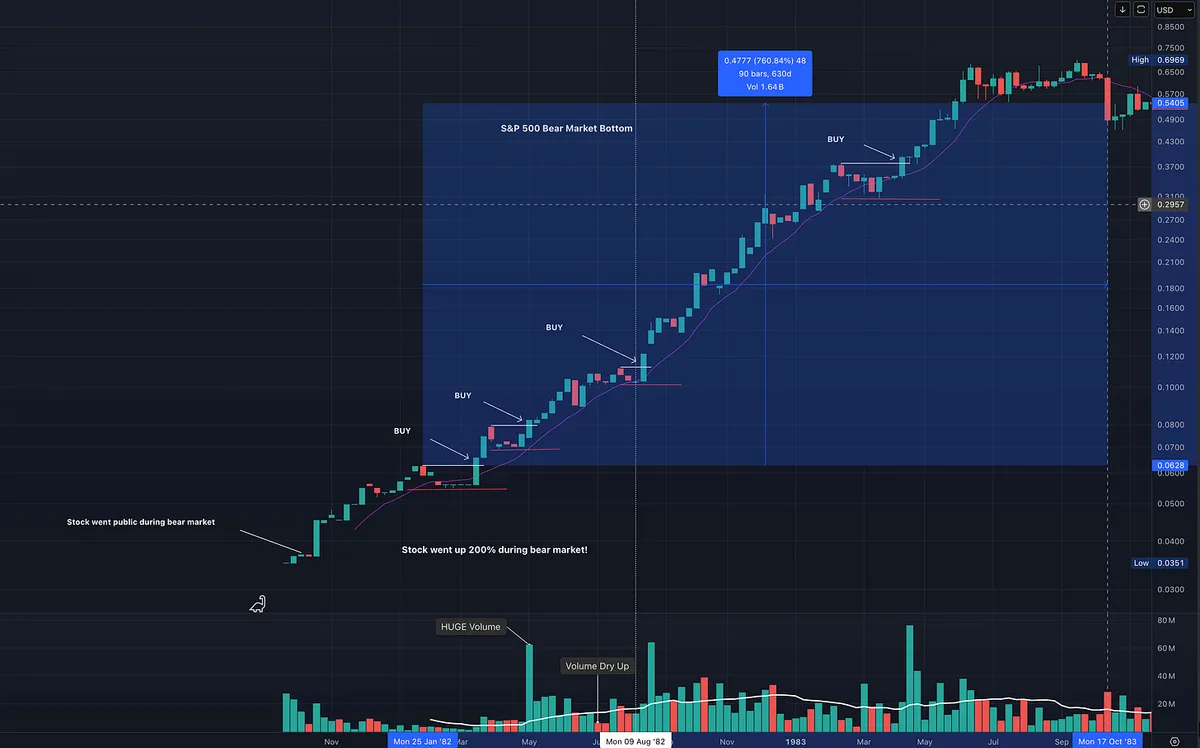
“It’s extended.”

That’s what people say when they haven’t studied enough.

This chart, originally shown in How to Make Money in Stocks by William J. O’Neil , shows something important.

Yes, the stock is extended from what most would call a traditional base.

But Home Depot in the early 80s kept offering low risk, high reward entries inside a powerful Stage 2 uptrend.

Look at the areas marked BUY:

  • Tight consolidations

  • Volume contraction

  • Higher lows

  • Breakout through short resistance

  • Immediate continuation

That is not chasing.

That is entering strength with defined risk.

You do not always need:

  • A cup with handle

  • A massive reset

  • A 30 percent correction

Big institutional leaders often stair step higher.

They build tight flags. They pause. They break out. They continue.

If the stock is trending above a rising moving average, If price is contracting, If volume dries up before expansion,

That is opportunity.

This is not FOMO into a straight up name. We are still being patient. We are still waiting for tight pullbacks inside strength.

It looks very similar to some of the biggest winners we have had recently.

How many could have stepped into MU, LITE, or AVGO using similar entry tactics?

Study that difference.

View on Substack ↗

4 Legendary Entry Tactics That Built Trading Fortunes

Minervini.

O’Neil.

Darvas.

Kullamägi.

Different decades. Different styles. Same structural edge.

I broke down exactly how each one enters momentum growth stocks with precision.

If you trade breakouts, this is mandatory reading.

Read it here ↓

https://tradingmomentum.substack.com/p/the-4-breakout-entry-architectures

ArticleThe 4 Breakout Entry Architectures Used by Market Legends
View on Substack ↗

When Not to Sell an Extended Stock

Most traders see a stock up 15 or 20 percent from a base and think one thing.

It’s too extended. Time to sell.

David Ryan, three-time U.S. Investing Champion and William O’Neil protégé who ran the New USA Growth Fund, noticed something different.

In Think & Trade Like a Champion, Minervini explains that Ryan defined “extended” as more than 10 percent above the most recent consolidation. He would not buy extended stocks.

But he observed that some of these names did not roll over. They kept advancing. In many cases, they went on to make huge gains.

That observation led to a hypothesis.

If large institutions cannot fill their positions in one or two days, they must accumulate over time. That steady institutional demand pushes the stock higher across multiple sessions.

Ryan studied this relentlessly and, with programmer Rajneesh Gupta, identified specific characteristics. He originally called the setup ANTS, later referred to as the MVP indicator for Momentum, Volume, and Price.

The traits were precise:

  • 12 out of 15 up days

  • Volume up 25 percent or more

  • Price up 20 percent or more in 15 days

Here is the nuance most traders miss.

Ryan warned against buying solely on these traits if the stock is already extended. He advised waiting for a pullback or a new base to form.

But sometimes that 15-day surge begins near the bottom of a base. In that case, the stock is not extended. It is under accumulation and in position to be bought immediately.

The lesson is simple.

Do not sell strength that is under accumulation.

What feels extended to you may be institutions just getting started.

View on Substack ↗

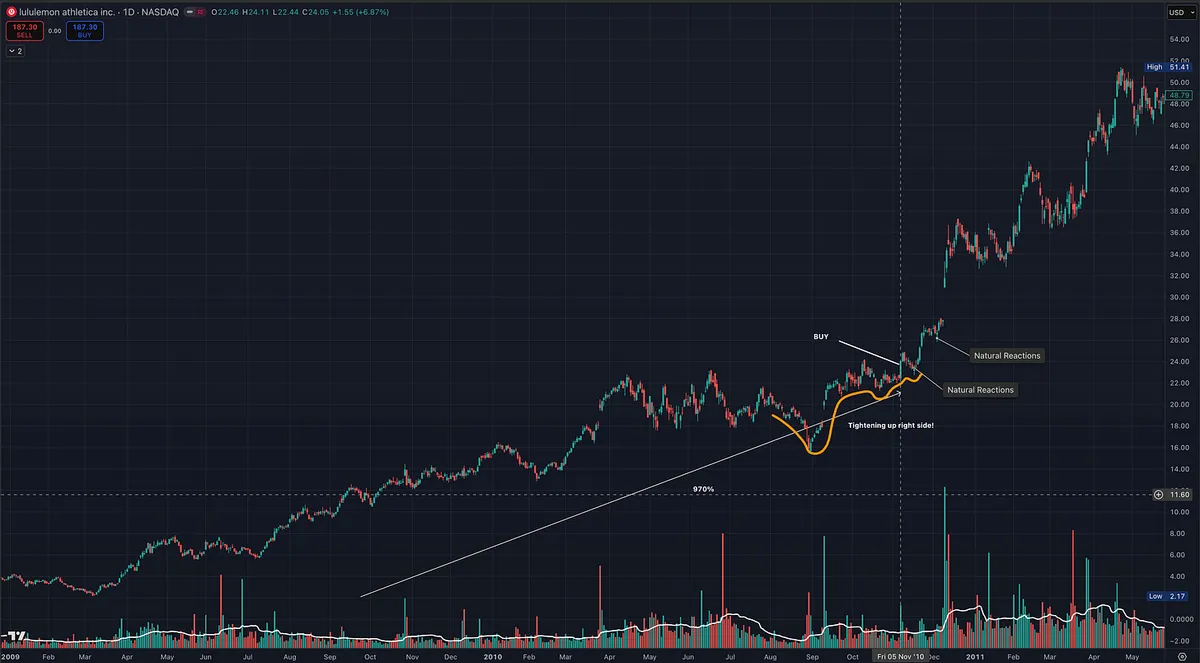
How Mark Minervini Buys After a Big Run

Minervini calls it tennis ball action.

It shows up after a stock has already made a strong advance.

Price runs.

It pulls back.

Volatility contracts.

Tight price action forms.

Like a tennis ball forced underwater and then let go. It shoots up.

In LULU 2010, the key was the tightening on the right side of the base.

Pullbacks became smaller. Volume dried up.

That tells you supply is being absorbed.

The buy came after:

• Higher lows

• Clear volatility contraction

• Expansion higher on powerful volume

The edge was recognizing the compression before the move.

Study the right side of bases in leading stocks.

View on Substack ↗

When All The Forces Line Up

Mark Minervini says it simply:

“You want all the forces behind you, fundamental, technical, and market tone.”

That is the edge.

A stock can be fundamentally strong and still go nowhere.

Earnings can be growing. Revenue can be accelerating. The story can be compelling.

But if supply and demand have not aligned, the stock is not ready.

A good company is not always a good stock.

Price must confirm.

Institutions must be accumulating.

The overall market must support risk.

Minervini makes this distinction clear throughout his work. Fundamentals create potential. Technicals confirm timing. Market tone determines probability.

You can be right about the company and still lose money if you are early.

Because what moves stocks is not your opinion.

It is institutional demand.

Big funds control the majority of volume. When they perceive value, price moves. When they are not interested, even the best story stalls.

That is why you want:

Strong earnings and sales growth. Constructive base structure. Tight price action. Volume drying up before breakout. A healthy general market.

When all three align, fundamental strength, technical setup, and favorable market conditions, probability shifts in your favor.

When one is missing, risk increases.

You are not just buying a stock.

You are aligning yourself with institutional perception and market momentum.

When all the forces are behind you, the path of least resistance is up.

View on Substack ↗

Getting Stopped Out Does Not Mean the Stock Is Dead

One of the biggest mistakes traders make is emotionally discarding a stock after getting stopped out.

You take a small loss.

It feels like failure.

You move on.

Then weeks later, that same stock breaks out again and becomes the leader that defines the year.

Mark Minervini addresses this directly in Trade Like a Stock Market Wizard:

“Don’t discard a stock just because it stops you out if the fundamentals remain intact. Stay on the lookout for a failure reset. The failure pivot reset is similar to the base reset, except that it occurs during the formation of the entry point over a shorter period of time than the base reset. A pivot failure doesn’t necessarily cause an outright base failure. Instead, it can reset a new entry point, usually within a number of days or weeks.”

Read that carefully.

A failed breakout does not automatically mean the story is over.

Sometimes it simply resets the setup.

A pivot failure can shake out weak hands.

It can absorb supply.

It can create a cleaner, tighter entry.

Some of your biggest winners will not work the first time.

They will stop you out.

They will reset.

Then the next breakout will be the one that runs.

If the fundamentals remain intact and the structure repairs itself, the stock deserves another look.

Professionals do not take losses personally.

They take them as information.

The goal is not to avoid getting stopped out.

The goal is to stay objective enough to re-enter when the setup reappears.

Because sometimes the trade that stops you out is simply preparing you for the one that makes your year.

View on Substack ↗

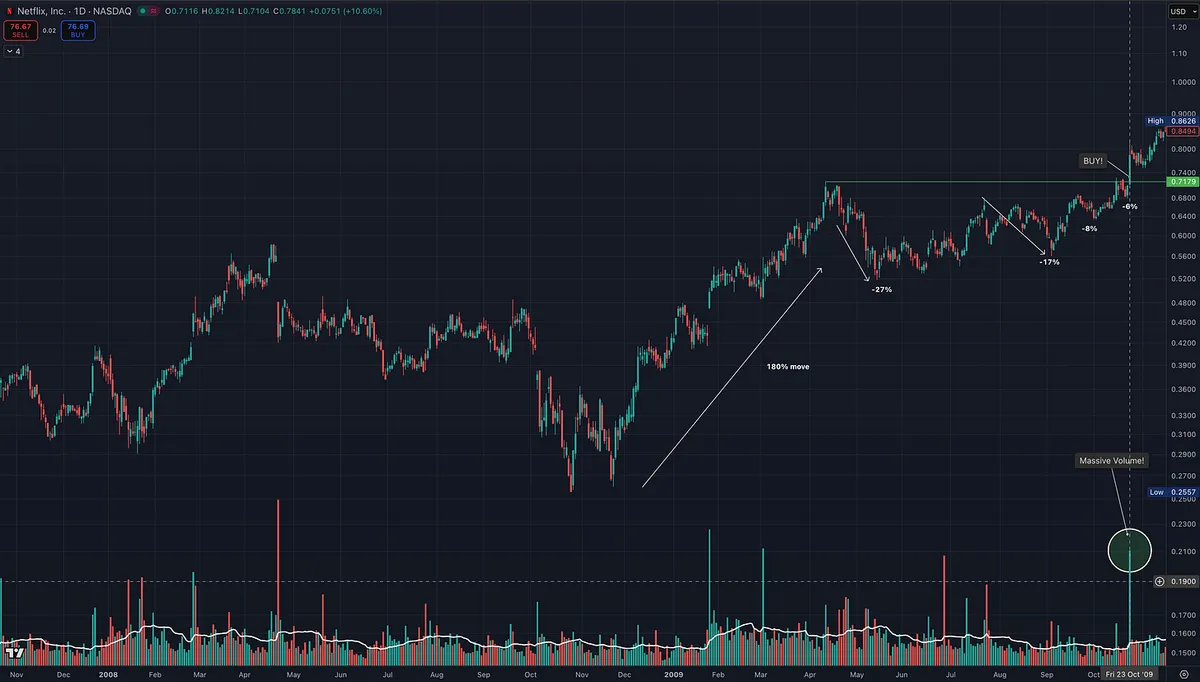
Big Move. Tighten Up. Then Explode.

This is exactly what we want to see.

First, a powerful advance.

In this case, roughly a 180 percent move.

That move tells you institutions are involved. It establishes leadership.

Then something important happens.

The stock does not collapse.

It tightens.

Each pullback becomes smaller.

Minus 27 percent. Then minus 17 percent. Then minus 8 percent. Then minus 6 percent.

That is volatility contraction.

That is supply being absorbed.

During the tightening phase, volume dries up.

Fewer shares are coming to market. Sellers disappear.

This is exactly what Mark Minervini describes in Trade Like a Stock Market Wizard when he explains that volume should contract during the tightest portion of consolidation before a breakout .

Strong expansion. Orderly digestion. Tighter contractions. Volume dry-up. Breakout on powerful volume.

When the breakout finally came, volume exploded.

Demand overwhelmed limited supply.

The result?

NFLX then ran another 500 percent.

That is what happens when compression resolves higher.

Big winners do not move randomly.

They prepare.

Compression precedes expansion.

If you learn to recognize tightening after a major advance, you stop fearing pullbacks.

You start positioning for superperformance.

View on Substack ↗

When Volume Dries Up, The Move Is Coming

Most investors get nervous when volume disappears.

They see declining activity and think:

No interest. No liquidity. No demand.

Mark Minervini teaches the opposite.

In Trade Like a Stock Market Wizard, he writes:

“In fact, we want to see volume on the final contraction that is below the 50-day average with one or two days when volume is extremely low. This may not always occur in the largest cap stocks, but in some of the smaller issues, volume will dry up to a trickle. Viewed as a lack of liquidity, this worries many investors. However, this is precisely what occurs right before a stock is ready to make a big move. Why? Because the decreased volume means that stock has stopped coming to market. With very little supply of stock in the market from sellers, even a small amount of buying can move the price up very rapidly. During the tightest section of the consolidation, the pivot point volume should contract significantly.”

Read that carefully.

Volume drying up is not weakness.

It is supply disappearing.

When a stock forms a tight base and volume contracts below the 50-day average, especially with one or two extremely quiet days, that tells you something important:

Sellers are gone.

Supply has been absorbed.

Now it does not take much demand to push price higher.

This is basic economics.

Low supply plus new demand equals expansion.

Minervini also highlights footprint analysis, such as an 8-week base with successively tighter pullbacks of 22 percent, then 8 percent, then 2 percent.

That tightening is compression.

Compression precedes expansion.

The quietest moments often come right before the loudest moves.

If you learn to recognize volume drying up during tight consolidations, you stop fearing inactivity.

You start recognizing opportunity.

Because when supply disappears, price does not need much encouragement to move fast.

View on Substack ↗

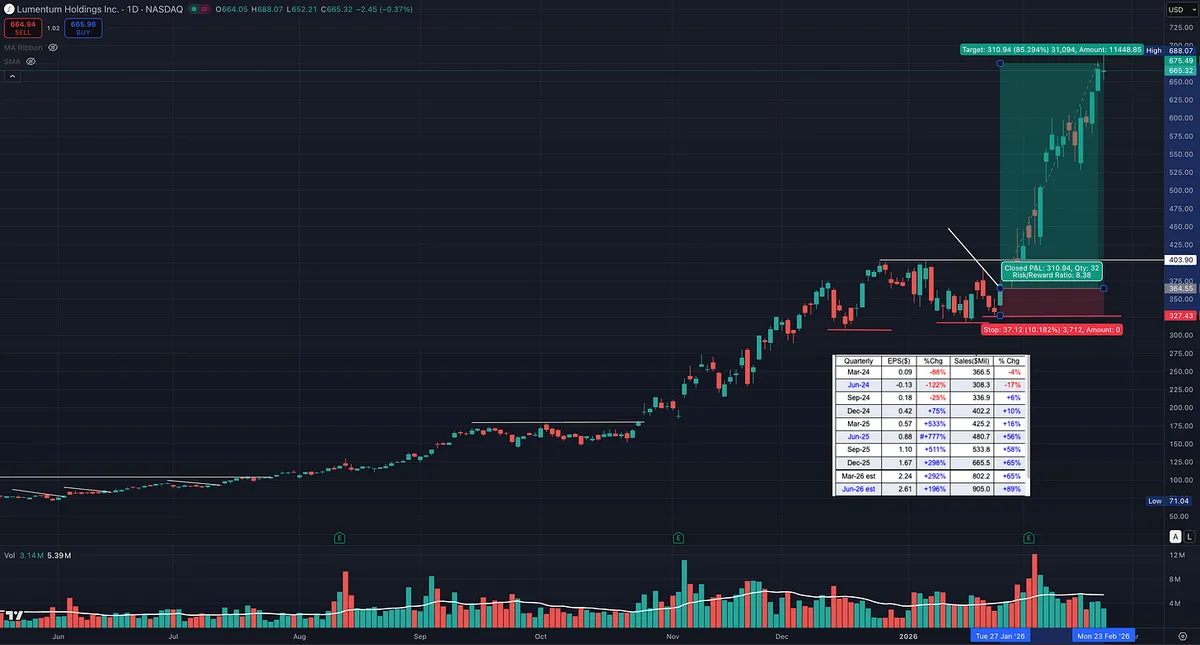
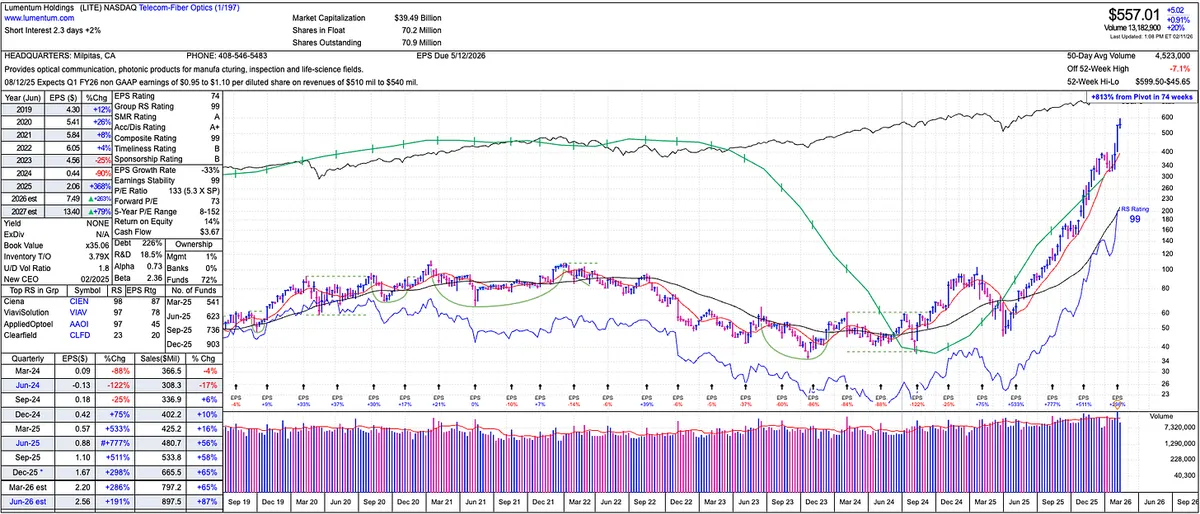
From RS Screener to Weekly Paid Newsletter to 55% Gain

We have been talking about buying pullbacks and upside reversals.

LITE just gave a textbook one.

What is interesting is how it first came onto our radar.

It showed up on our relative strength screener weeks before the breakout, while it was still setting up.

  • Top tier relative strength.

  • Strong on multiple timeframes.

  • Fund ownership accelerating.

  • Big earnings. Big sales.

You would have missed it on the MarketSurge O’Neil scan, which highlights the importance of casting a wider net. That is what I do when using the relative strength screener. First I scan for strength, then I dive into the chart and the fundamentals.

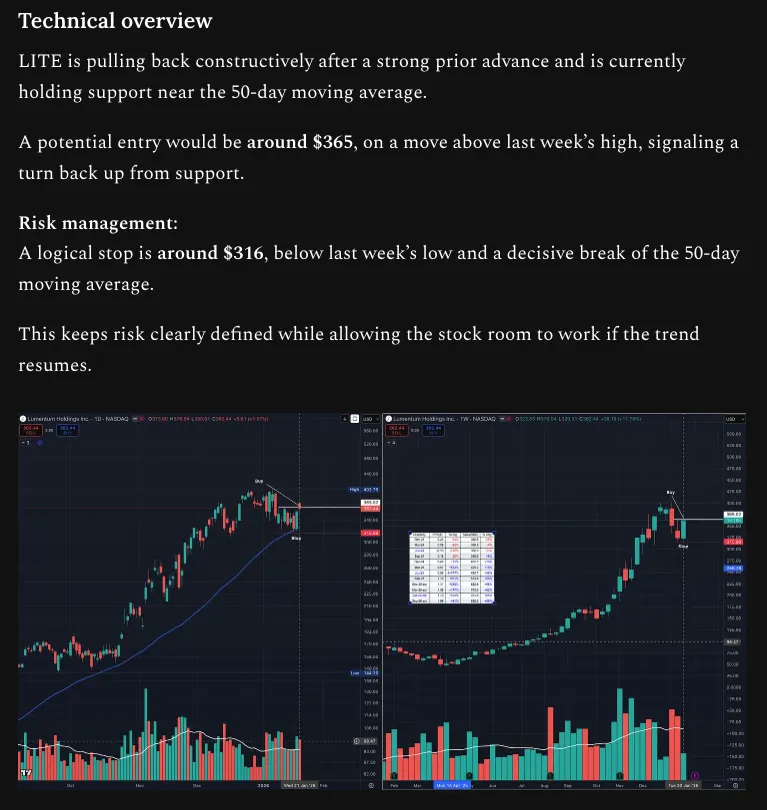
When we walked through this setup with paid subscribers, it was pulling back constructively after a strong advance and sitting near the 50 day moving average.

The plan was simple.

Entry around $365 on a move above the prior week’s high. Stop below the weekly low. We were also looking for follow through at the breakout level around $400.

We defined our risk, like we do with every trade.

No guessing.

Now it is up 55 percent from that area.

Here is the important part.

I am not some guru. I did not know LITE would be a winner. It simply met the criteria of big winners. Plenty of stocks meet the criteria and fail. When they do, I take a small loss.

But when a stock with elite relative strength sets up technically, offering a low risk, high reward opportunity, combined with strong CANSLIM type fundamentals, those are the kinds of names that can become major winners. You take them.

One stock like this can cover multiple failed attempts.

That is why we scan for strength.

Look for low risk, high reward technical setups.

Align with big sales, big earnings, accelerating fund ownership, and a bull market theme.

This is why we focus on process.

And that process produces the results.