
Trading articles/The 4 Breakout Entry Architectures Used by Market Legends
Feb 24, 2026 · Momentum Trading Strategy
The 4 Breakout Entry Architectures Used by Market Legends
How Minervini, O’Neil, Darvas, and Kullamägi Time Momentum With Surgical Precision
Originally published on Substack.
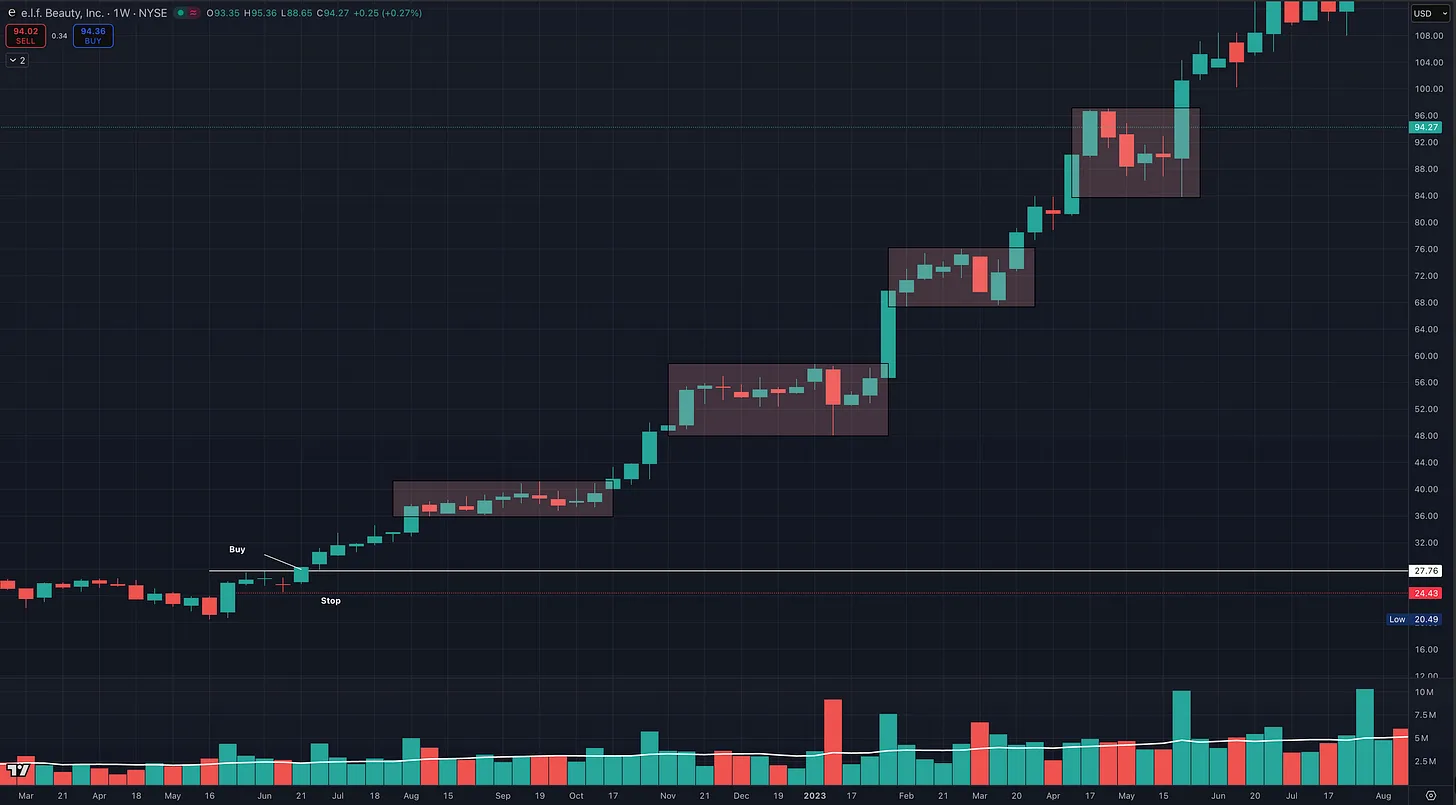
Most traders do not have a stock picking problem. They have an entry problem.
You know the feeling. You spot the leader early. You see the consolidation forming. You tell yourself, this is the breakout. You hesitate. Or you chase. Or you enter slightly early and get shaken out. Or you wait for confirmation and the reward is gone. And then you conclude the strategy does not work.
Here is the uncomfortable truth. Breakouts work. Momentum works. Supply and demand still govern price. What fails is execution.
The difference between average traders and legends like Mark Minervini, William O’Neil, Nicolas Darvas, and Kristjan Kullamägi is not that they buy breakouts. It is how they enter them. Each of them built a precise entry architecture around the same core structural idea: Price expands after supply contracts. Not randomly. Not emotionally. Structurally.
In this article, I break down their exact entry models using only their original teachings, books, interviews, and documented methodology. By the end, you will understand:
- The Volatility Contraction Pattern from Mark Minervini
- The CANSLIM Cup and Handle from William O’Neil
- The Darvas Box Method from Nicolas Darvas
- The Opening Range Breakout model used by Kullamägi, a tactic he refined and that earlier traders like Dan Zanger also exploited
- Why all four are variations of the same structural edge
- How to apply them across swing, position, and even intraday timeframes
If you truly want to trade momentum growth stocks with precision instead of emotion, this is the entry blueprint.
The Math of Breakouts Never Changed
If you strip away the branding, the indicators, and the personalities, every one of these traders is exploiting the same structural phenomenon. Minervini calls it volatility contraction. O’Neil calls it proper base formation. Darvas calls it a box. Kullamägi calls it a stair step with tightening price action. Different language. Same mechanics.
Across 100 years of market history, the structure is consistent:
A stock makes a meaningful prior advance. Not a random bounce. A real move driven by institutional demand. It begins to consolidate. Early buyers take profits. Weak hands exit. Supply comes to market.
Volatility contracts. The price swings narrow. Pullbacks get shallower. Volume dries up. Sellers become exhausted.
A pivot forms. A clearly defined level where supply has repeatedly capped price. Demand overwhelms the remaining supply. Price expands with force.
This is not theory. You can see this pattern in:
- The historical winners O’Neil documented in How to Make Money in Stocks
- The VCP examples in Trade Like a Stock Market Wizard and Think and Trade Like a Champion
- The box breakouts Darvas described in How I Made $2,000,000 in the Stock Market
- The stair step momentum runs Kullamägi studied across thousands of charts
Now here is something most traders misunderstand. None of these legends required a high win rate.
Minervini has stated his win rate often sits around the 50 percent range. O’Neil reported similar figures in strong markets. Kullamägi has publicly stated his win rate has been as low as 25 to 35 percent. Darvas documented frequent small losses before catching major trends. Different decades. Different personalities. Same math.
The edge was never accuracy. It was controlled risk and asymmetric reward. If your average loss is small and your average winner is multiple times that loss, you only need a modest win rate to compound aggressively.
The variable is not whether breakouts work. The variable is entry precision and risk containment. That is where the legends diverge. Let’s break them down.
1. Mark Minervini and the Volatility Contraction Pattern
Minervini’s edge begins before the breakout. He does not trade random strength. He focuses on Stage 2 uptrends. A proper long candidate must show:
- Price above rising 50 and 200 day moving averages
- Higher highs and higher lows
- Institutional sponsorship
- Relative strength leadership
The 200 day moving average must be rising. Not flat. Not declining. This filter alone eliminates most stocks.
The Volatility Contraction Pattern (VCP)
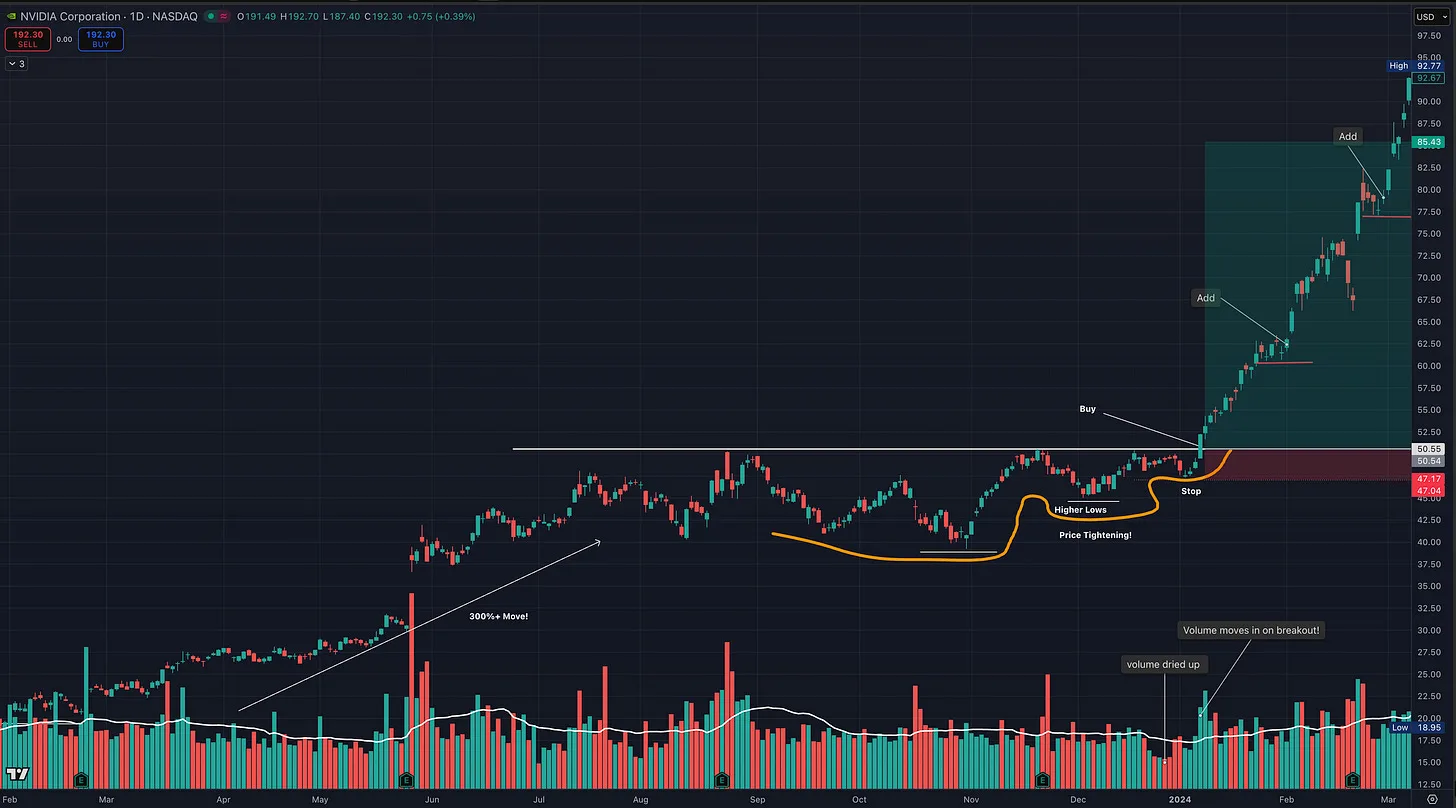
The Volatility Contraction Pattern is a sequence of tightening pullbacks. Typical example:
- First pullback 15 to 25 percent
- Second pullback 8 to 12 percent
- Third pullback 3 to 8 percent
Each contraction becomes smaller. Each selloff becomes weaker. Volume declines during pullbacks. This is supply leaving the system.
The tighter the final contraction, the better the risk control.
The Entry
Minervini enters as price moves through the pivot high of the final contraction. He does not wait for a strong close. He enters as the stock moves through resistance, often intraday. Volume expansion must confirm the move.
The Stop
The stop goes below the most recent contraction low. Risk is often 3 to 7 percent. This is what creates asymmetric opportunity. Small defined risk. Potential for 20, 50, even 100 percent gains in true leaders.
Key Principle
Tightness precedes expansion. Minervini will trade biotech. He will trade volatile names. But he will not trade wide and loose patterns. Structure determines everything.
2. William O’Neil and the Cup With Handle
William O’Neil did not guess. He researched. He studied thousands of the greatest stock market winners over more than a century of market history. His conclusion was consistent. Before their biggest advances, the true leaders showed:
- Strong quarterly and annual earnings growth
- Accelerating sales
- Institutional accumulation
- Relative strength leadership
- Proper base structures before breakout
The entry was never random. It occurred at a precise structural point. The pivot.
The Cup With Handle
A proper Cup With Handle has criteria.
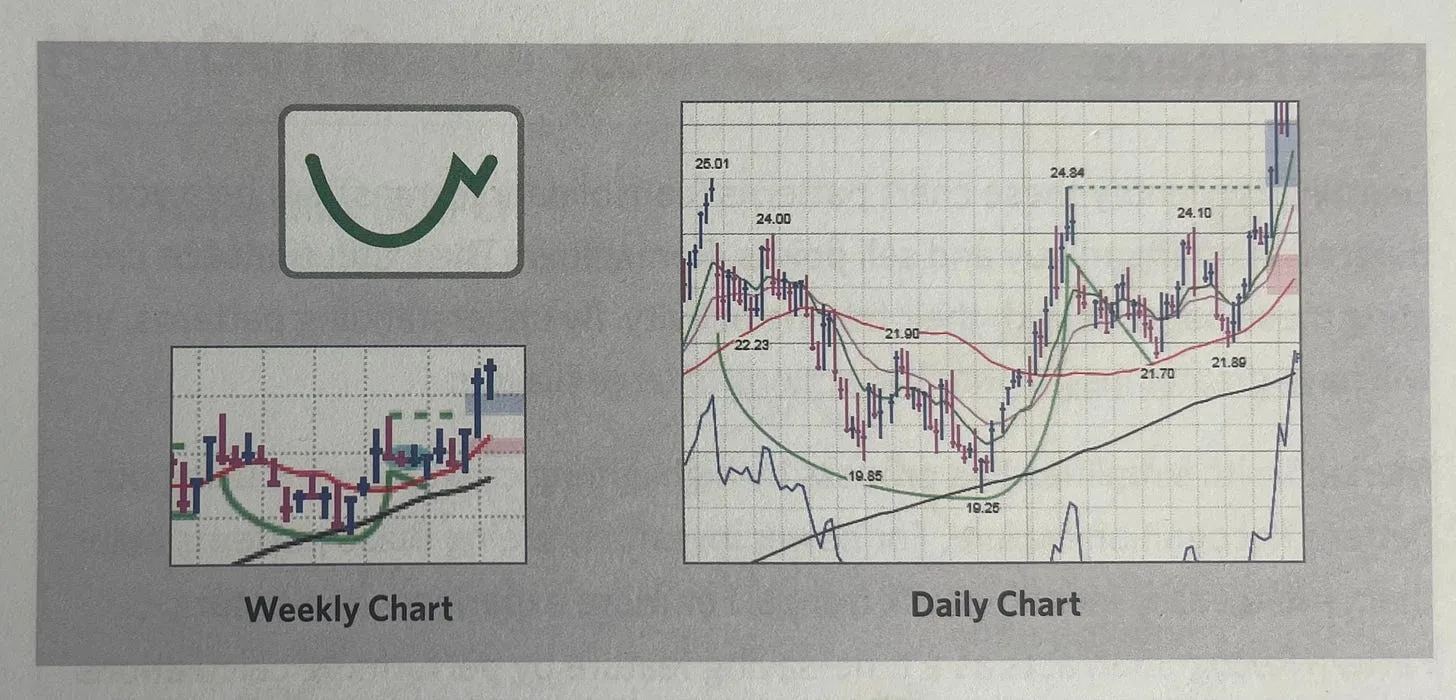
- A meaningful prior uptrend
- A controlled correction, typically in the 12 to 33 percent range
- A rounded U-shaped bottom rather than a sharp V recovery
- A base forming over at least 7 weeks, often 8 to 12 weeks or longer
- A handle forming in the upper half of the base
- The handle drifting slightly downward on light volume, typically correcting no more than 8 to 12 percent
- Volume drying up during the handle before the breakout
The handle represents the final shakeout of weak holders. Supply is being absorbed. The stock tightens. Pressure builds. When price approaches the prior high, very little supply remains overhead. That is the setup.
The Entry
The buy point is the highest point of the handle.
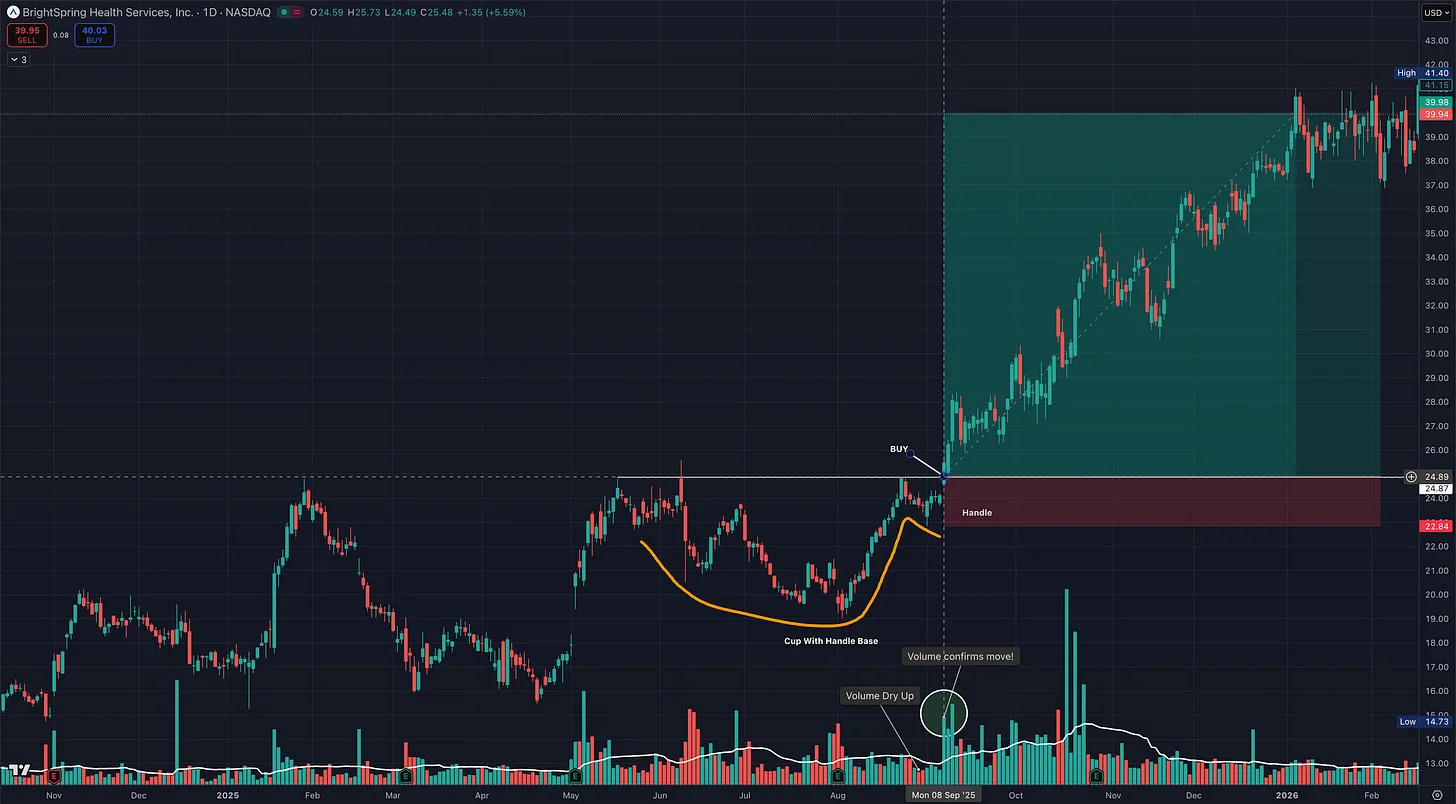
As price clears that pivot, volume should expand meaningfully above average. That volume surge signals institutional demand entering aggressively.
O’Neil emphasized buying as close to the pivot as possible. The further you chase above it, the worse your risk to reward becomes. Precision matters. You are not buying because the stock “looks strong.” You are buying because supply has been absorbed and demand is taking control at a clearly defined level.
The Stop
O’Neil’s loss rule was simple. Cut losses at roughly 7 to 8 percent below your purchase price. If the breakout fails quickly, you exit quickly. No averaging down. No hoping. No negotiating with the market.
Losses must remain small so capital can rotate into the next opportunity. The math is unforgiving. Large losses require disproportionately large gains to recover. Small losses keep you in the game.
What Separates O’Neil and Minervini
Mark Minervini has openly credited O’Neil’s work as foundational in his development. The philosophical core is identical:
- Leadership stocks
- Institutional sponsorship
- Breakouts from proper bases
- Strict risk control
Where they diverge is refinement. O’Neil accepts broader base structures as long as the fundamental story supports the move. Minervini evolved that foundation into the SEPA framework and placed greater emphasis on volatility contraction, tighter price structures, and extremely controlled risk entries.
Same architecture. Different calibration. Both are exploiting the same imbalance: Demand overwhelming supply at a well defined pivot.
3. Nicolas Darvas and the Box Breakout
Nicolas Darvas developed his system while traveling the world as a professional dancer. He did not sit on trading desks. He did not watch financial television. He built a rules based method around strength.
Darvas focused on stocks making new highs. But he did not buy random names. He sought companies in exciting, expanding industries. In his era that meant electronics, aerospace, and emerging growth businesses. He wanted stocks that institutions were clearly accumulating. He avoided thin, illiquid names and laggards. Strength first. Story second. Execution third.
When a stock hit a new high and then built a defined trading range, he drew a box. The top of the box was resistance. The bottom was support. If price broke above the box on strong volume, he bought automatically.
This is structurally aligned with O’Neil’s philosophy: Leadership. New highs. Institutional demand. Breakout through defined resistance. Different visual framework. Same underlying imbalance.
The Entry
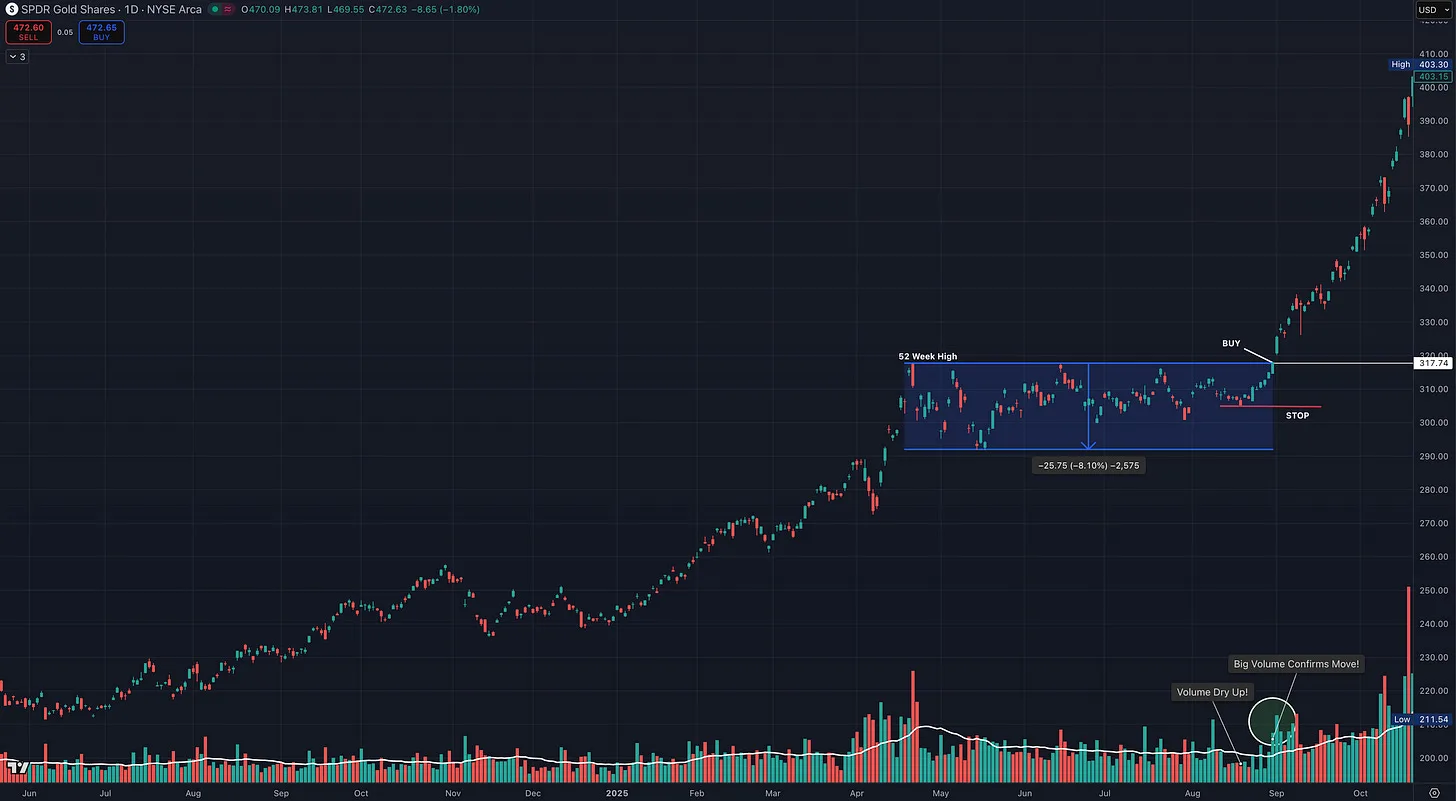
Buy slightly above the box high as price breaks into new high ground. No anticipation. No prediction. You do not debate the breakout. You let price trigger the decision. Volume expansion confirms demand.
The Stop
The stop is placed at a logical support level within or just below the box. In many cases, this meant below the lower boundary of the box. In tighter formations, Darvas would sometimes place the stop just under a recent higher low or structural support inside the box to keep risk reasonable.
If price reentered the box and broke down decisively, the breakout had failed. Loss is predefined. Risk is controlled. Capital is preserved. Darvas was ruthless about exiting quickly when wrong.
The Real Power: Pyramiding
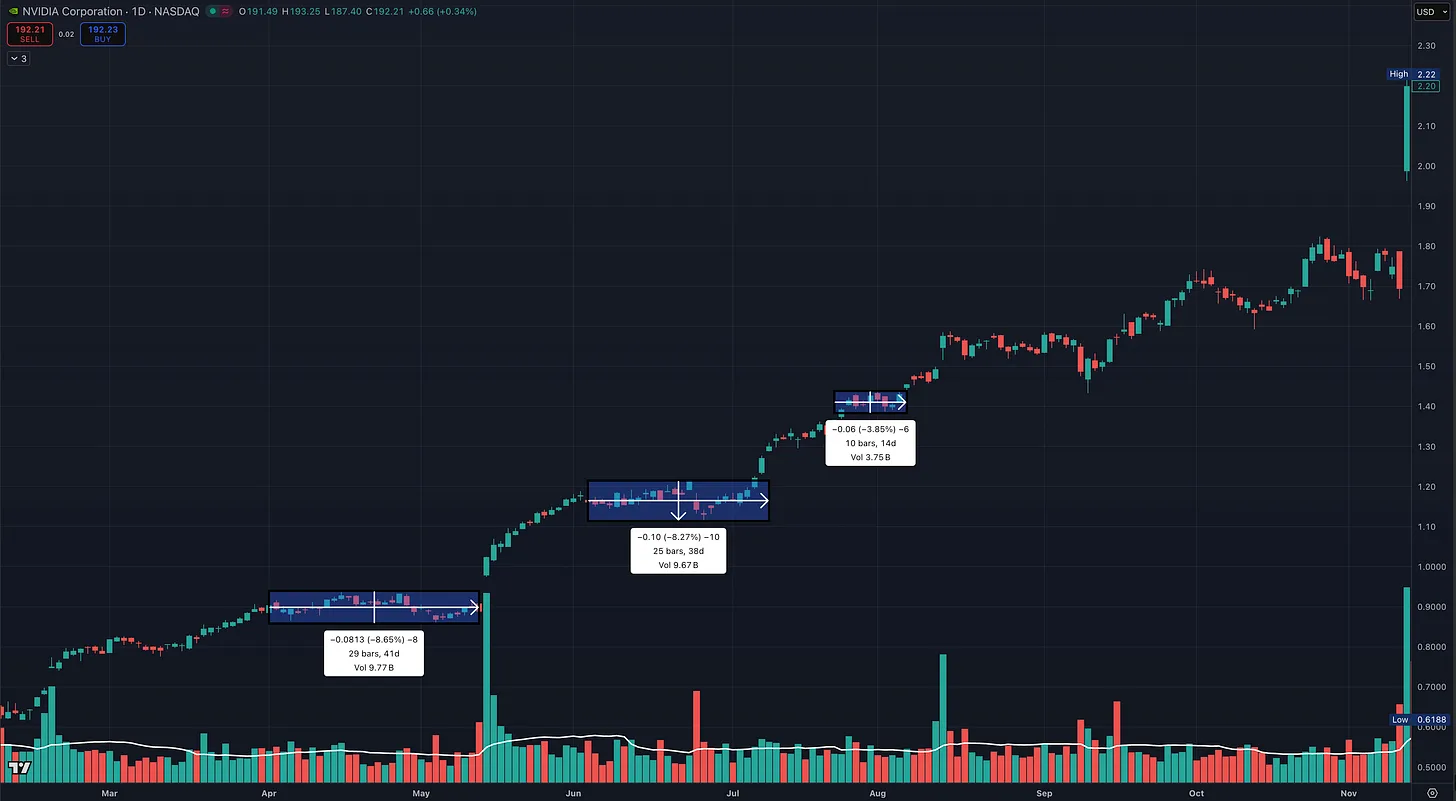
Darvas did not stop at one entry. When a stock advanced and formed a new box at higher levels, he added again. Each new consolidation created another opportunity. Advance. Consolidate. Breakout. Repeat.
He raised his stops beneath each new box. This allowed him to concentrate capital into his strongest positions while continually defining risk. That is how he built million dollar positions in a handful of leaders.
Core Principle
Strong stocks stair step higher. Darvas did not rely heavily on detailed earnings analysis like O’Neil. But he did rely on:
- New highs.
- Volume expansion.
- Institutional accumulation.
- Emerging growth themes.
He was trading momentum before it was fashionable. And structurally, his method fits inside the same foundation as O’Neil and Minervini: Supply contracts. Demand overwhelms. Price expands.
4. Kristjan Kullamägi and the Opening Range Breakout
Kristjan Kullamägi built his framework by:
- Studying William O’Neil and StockBee
- Researching historical market leaders
- Building a massive personal chart database
- Reviewing thousands of momentum cycles
He emphasizes that stocks move in stairs. A leg higher. A consolidation. A volatility contraction. The next leg.
He focuses exclusively on the strongest stocks in the market across multiple timeframes. He scans for the top percentage performers over one, three, six, and twelve month periods. Strength begets strength.
Price First. Fundamentals Second.
Kullamägi is primarily a price-driven trader. He does not build trades from deep fundamental analysis. However, the stocks that surface in his scans often overlap heavily with O’Neil-style leaders. Why? Because his filters naturally capture:
- High relative strength
- Recent expansion
- Strong earnings reactions
- Institutional accumulation
He does not start with fundamentals. He starts with price. But the names he trades frequently align with leadership characteristics found in CANSLIM. The philosophy overlaps. The execution is different.
The Setup
He looks for:
- Strong prior expansion
- Orderly pullback
- Higher lows
- Tight consolidation
- Volume contraction
- Relative strength versus the market
He especially likes leaders that hold up during market pullbacks. If the market declines and a stock stops going down and builds higher lows, that is information. That relative strength is often the tell.
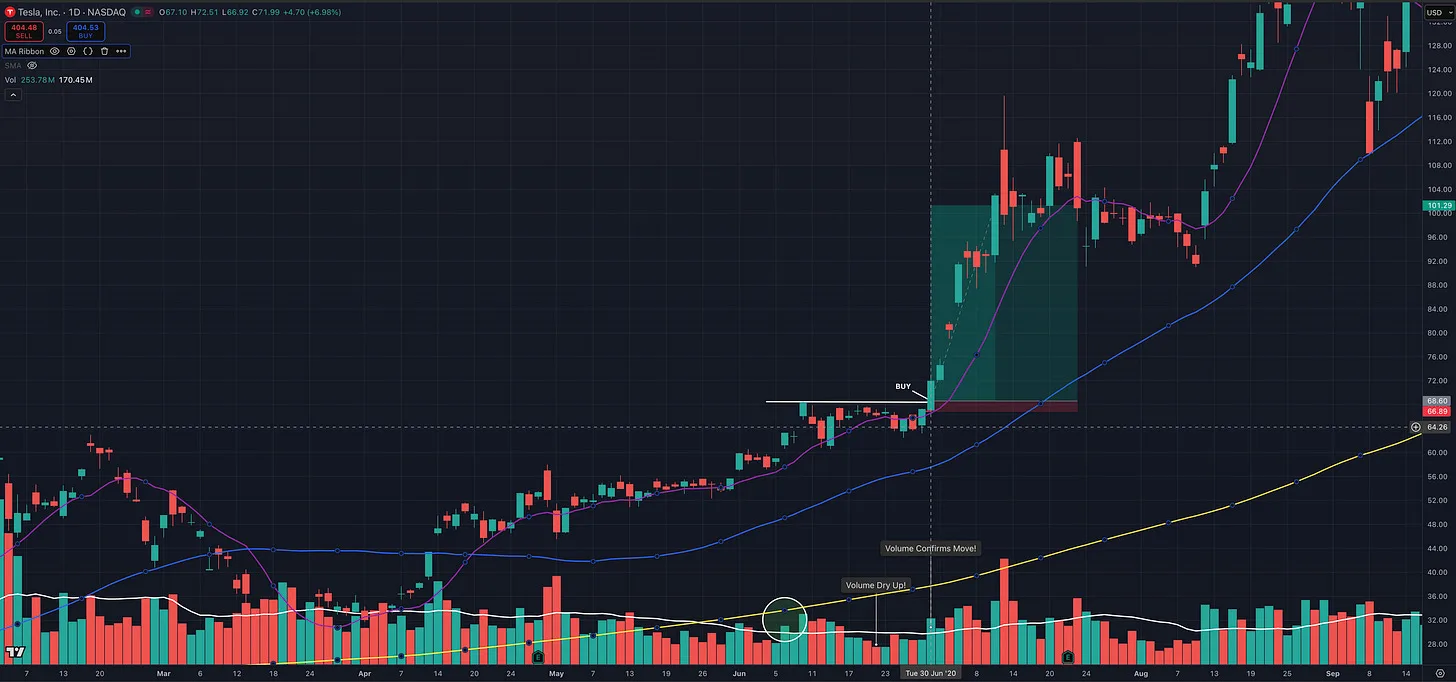
The Entry: Opening Range Breakout
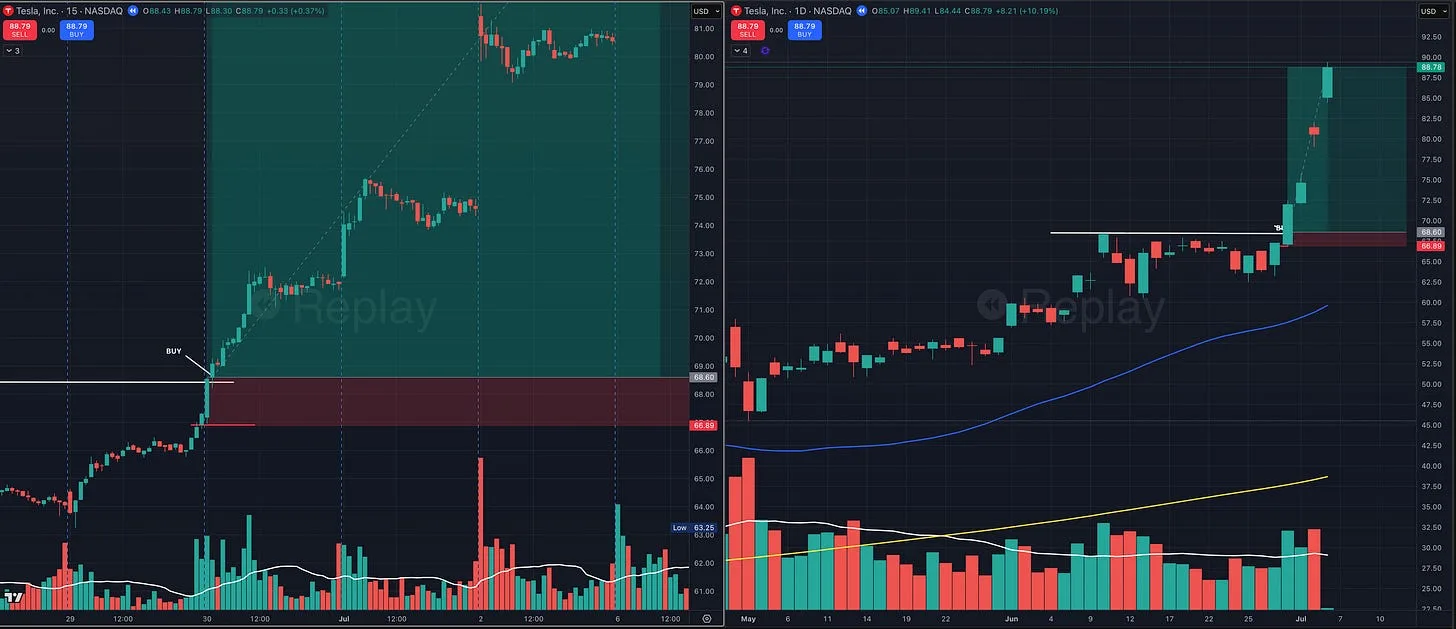
Even though he is primarily a swing trader, he times entries intraday. He buys:
- The break of the 1 minute opening range high
- Or the 5 minute
- Or sometimes the 30 to 60 minute range
But only when the daily chart is already in position for a true breakout. He does not anticipate. He reacts.
The stop is typically placed at the low of the day. Risk is often 2 to 3 percent. This allows larger size while keeping dollar risk tightly controlled.
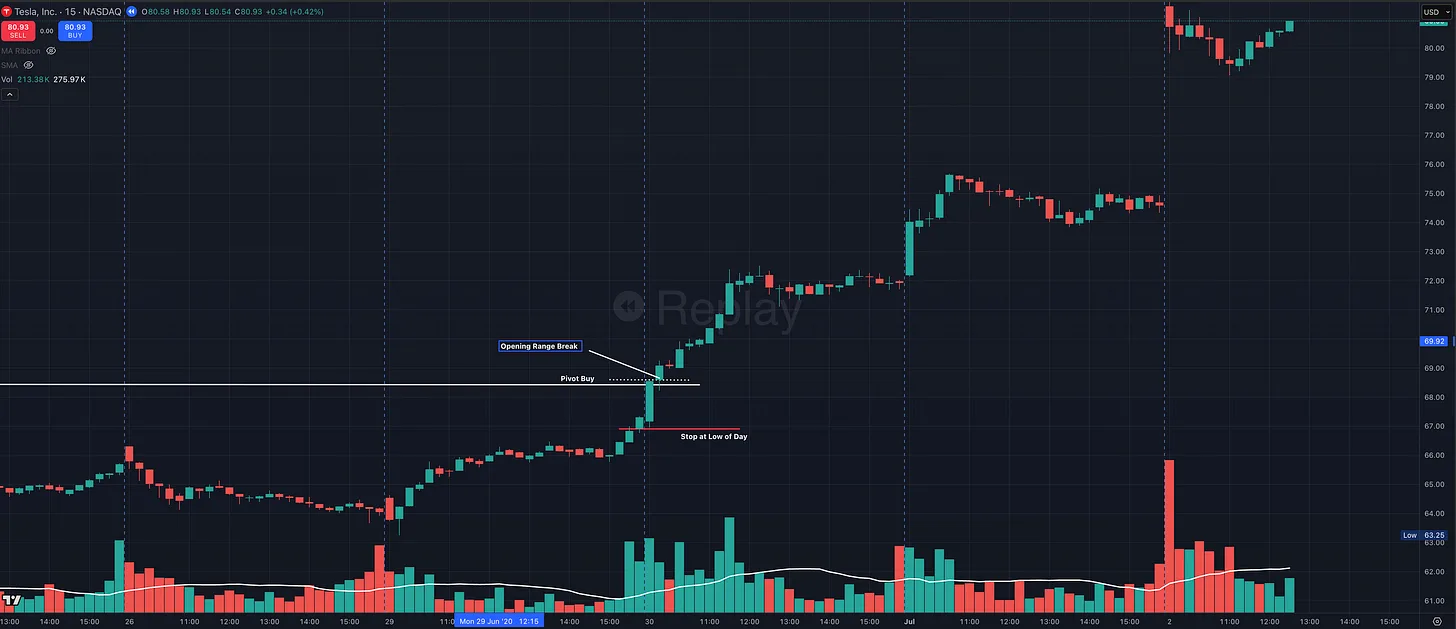
Daily breakout confirmed on intraday opening range break. Stop placed at low of day. Expansion follows immediately.
Managing the Move
Once price expands, he shifts from entry precision to momentum management. He often:
- Sells partial into the first burst
- Holds the remainder
- Trails against the rising 10 or 20 day moving average
He does not mechanically sell the first touch of the moving average. He waits for structural deterioration. Typically that means: a decisive close below the moving average combined with momentum loss.
He exits when the trend changes. Not because of noise.
Win Rate Reality
Kullamägi openly states his win rate can be 25 to 35 percent. It does not matter. His edge comes from asymmetry. Small predefined losses. Large expansion phases. A single 50 to 100 percent move can pay for multiple failed breakouts. This is pure momentum mathematics.
Market Environment Matters
He is explicit about one thing. Breakout systems do not work in downtrending markets. They thrive:
- In confirmed uptrends
- After corrections
- When leadership reemerges
Context is everything. Momentum needs fuel. Without it, precision does not matter.
The Unifying Principle
Minervini’s Volatility Contraction Pattern. O’Neil’s Cup With Handle breakout. Darvas’s Box. Kullamaggie’s Opening Range Breakout. They are not different strategies. They are different entry triggers built around the same structural condition.
Supply must contract before price can expand. That contraction may take shape over:
- 12 or more weeks in a Cup With Handle
- Multiple tightening waves in a VCP
- An 8 week Darvas Box
- A 5 day tight flag
- Even 30 minutes in an Opening Range
The timeframe changes. The underlying auction mechanics do not. Weak hands exit. Volatility compresses. Volume dries up. A pivot forms. Demand overwhelms remaining supply. Price expands.
The legends did not invent different edges. They engineered different ways to enter the same one.
How This Applies Across Timeframes
The patterns do not change. Only the compression of time changes.
Position Traders
Use O’Neil-style bases and Darvas boxes on weekly and daily charts. Let the larger structures form. Enter on proper breakouts. Add when new bases form higher. This is how major trends are captured. Time is expanded. Noise is reduced.
Swing Traders
Use VCP structures and daily breakout formations. Enter at the pivot or use Opening Range timing for precision. Manage the position against the rising 10 or 20 day moving average. This is the middle ground. Tight risk. Faster rotation. Compounding through repeated expansions.
Day Traders
These same principles apply intraday. Markets are fractal. A 30 minute compression on a 5 minute chart is structurally identical to a 10 week contraction on a daily chart. Supply contracts. Volatility tightens. Breakout expands. The mechanics do not change.
However, alignment across timeframes dramatically increases probability. When a weekly structure is bullish, the daily chart is breaking out, and the intraday chart offers an Opening Range trigger, that is where the edge compounds.
For example, NVDA during late 2023 into early 2024 showed volatility contraction on both the weekly and daily charts while offering precise intraday breakout entries. Multi timeframe alignment amplified the move. The more timeframes pointing in the same direction, the more powerful the expansion phase tends to be.
The Real Edge
The edge is not prediction. The edge is entering when:
- Structure is tight
- Risk is defined
- Leadership is clear
- Volume confirms
- Market environment supports breakouts
All four traders obsess over risk control. Every one of them cuts losses quickly. Every one of them lets winners compound. That is the common denominator.
Final Thoughts
Momentum trading looks simple. It is simple. It is not easy. The discipline to:
- Only trade true leaders
- Wait patiently for contraction
- Enter precisely at the pivot
- Cut losses without hesitation
- Hold winners through volatility
That is rare. The patterns have repeated for more than a century. The names change. The tickers change. The industries rotate. Supply and demand do not.
And understand this clearly. These four setups are not the entire playbook. They are four structural expressions of the same edge.
William O’Neil did not only trade Cup With Handle bases. He also traded flat bases, double bottoms, and ascending bases. Mark Minervini does not only trade VCP. He trades other contraction and expansion structures within his SEPA framework. Darvas refined his box logic across multiple variations. Kullamägi uses different momentum triggers depending on structure and context.
Each legend had a toolkit. But they mastered one core concept first.
If you are a beginner, start with one setup. One framework. One style. One execution model. Master it. Build screen time. Build pattern recognition. Build emotional control.
You can always expand your toolkit slowly over the years. But depth beats variety. Precision beats quantity. Execution beats theory.
The opportunity is not finding new patterns. The opportunity is executing proven ones better than the average trader.
Video Breakdown
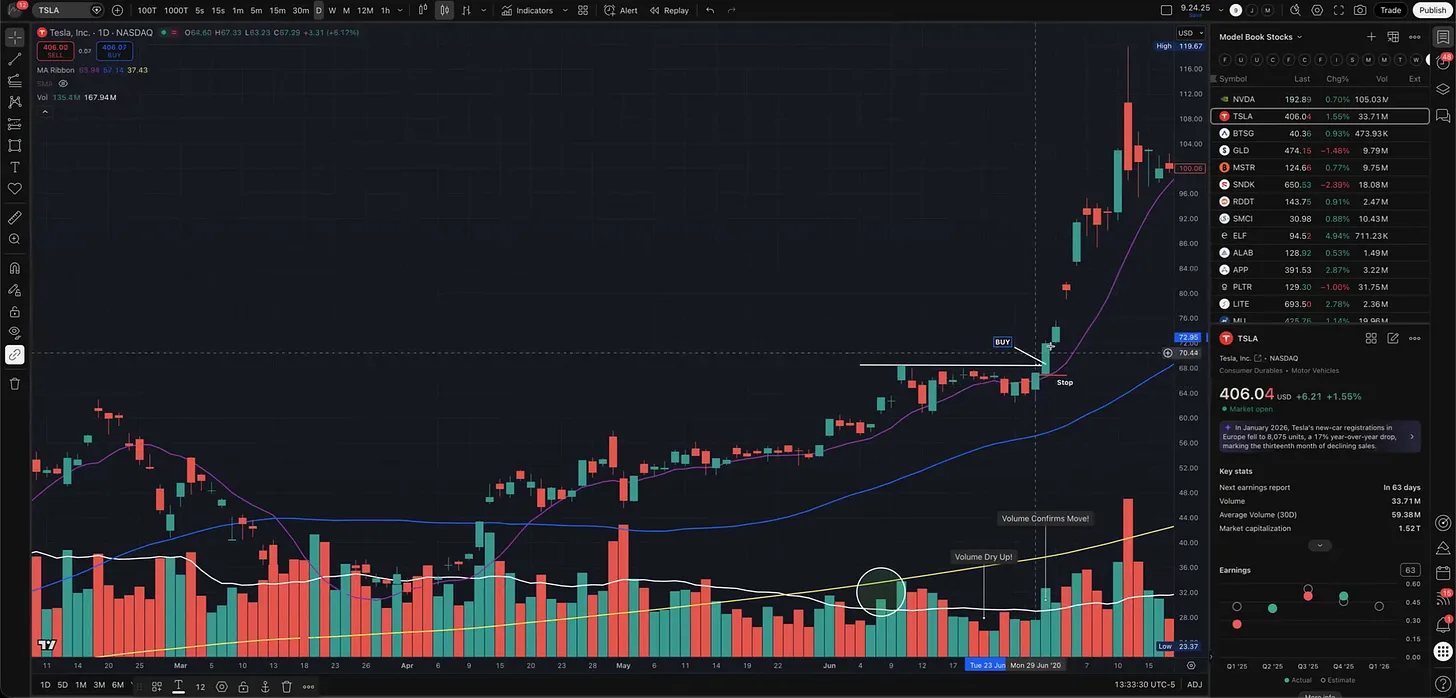 4 Legendary Traders. 4 Breakout Entry Tactics.How Minervini, O’Neil, Darvas, and Kullamägi approach breakout entries, illustrated through real charts, volume clues, and defined risk.Sep 17, 2026 · Read the article →
More in Legendary Traders
All Legendary Traders articles →Sep 17, 2026 · Legendary Traders
4 Legendary Traders. 4 Breakout Entry Tactics.
A chart-by-chart breakdown of Minervini’s VCP, O’Neil’s cup with handle, Darvas’s box breakout, and Kullamägi’s opening range breakout.
- how to make money in stocks
- IBD
- Momentum Trading
- VCP
- technical analysis
- CANSLIM
- Trading Setups
- position trading
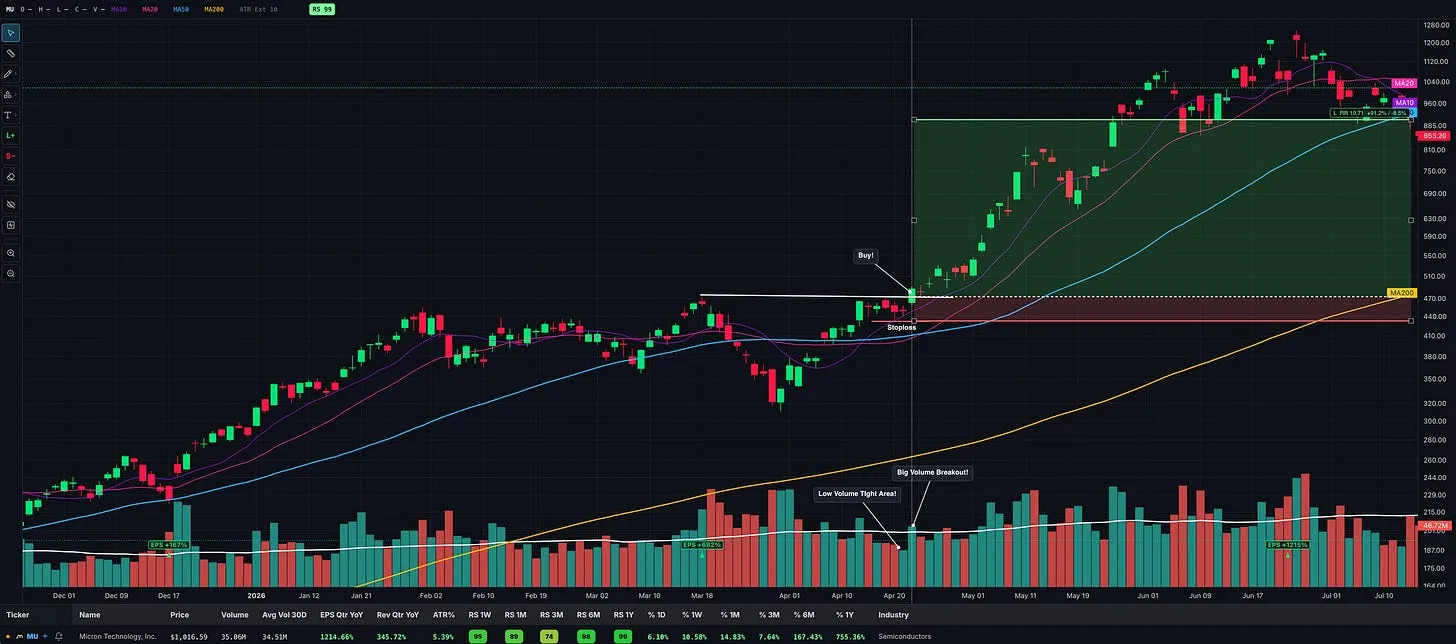
Sep 6, 2026 · Legendary Traders
Market Wizard David Ryan: How He Made 1,379% in Three Years
Inside the growth-stock approach of William O’Neil’s protégé and three-time U.S. Investing Champion, from precise entries to holding major winners.
- IBD
- fundamental analysis
- Learn Trading
- technical analysis
- position trading
- David Ryan
- Market Wizard
- CAN SLIM
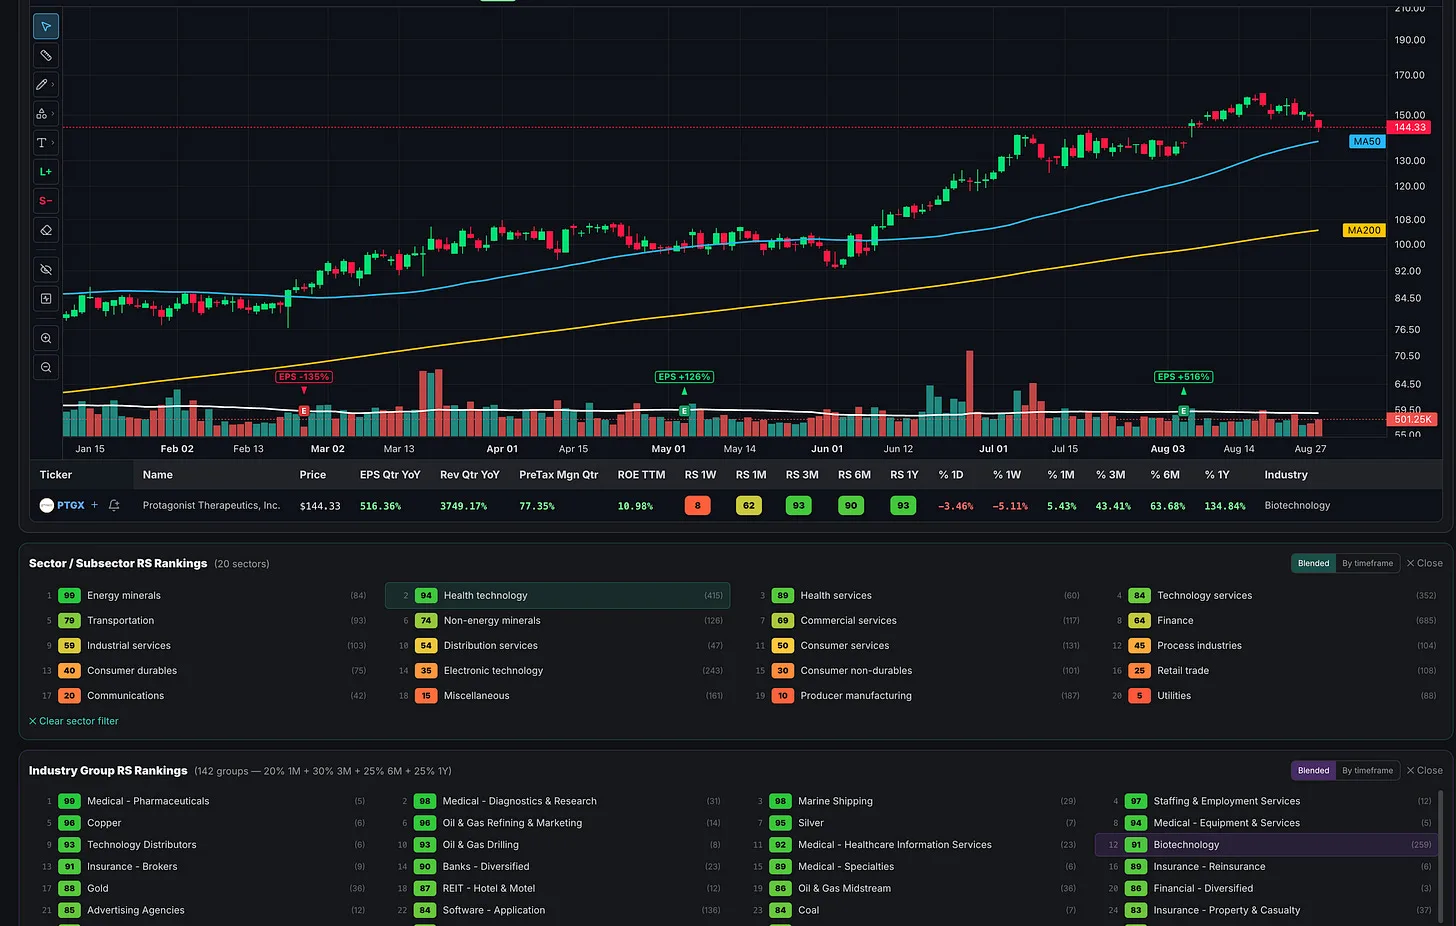
Aug 29, 2026 · Legendary Traders
Why the Market’s Biggest Winning Stocks Rarely Move Alone
Lessons from Nicolas Darvas, William O’Neil, and Mark Minervini on using industry-group strength and relative strength to find new market leaders without getting whipsawed.
- growth stocks
- CANSLIM
- position trading
- David Ryan
- stock trading
- Kristjan Kullamägi
- Nicolas Darvas
- industry groups