
Trading articles/The 3 Trading Setups That Turned Kristjan Kullamägi From Security Guard to $100M Trader
Mar 8, 2026 · Momentum Trading Strategy
The 3 Trading Setups That Turned Kristjan Kullamägi From Security Guard to $100M Trader
How Kristjan Kullamägi (Qullamaggie) Uses Breakouts, Episodic Pivots, and Parabolic Shorts to Capture the Market’s Biggest Momentum Moves
Originally published on Substack.
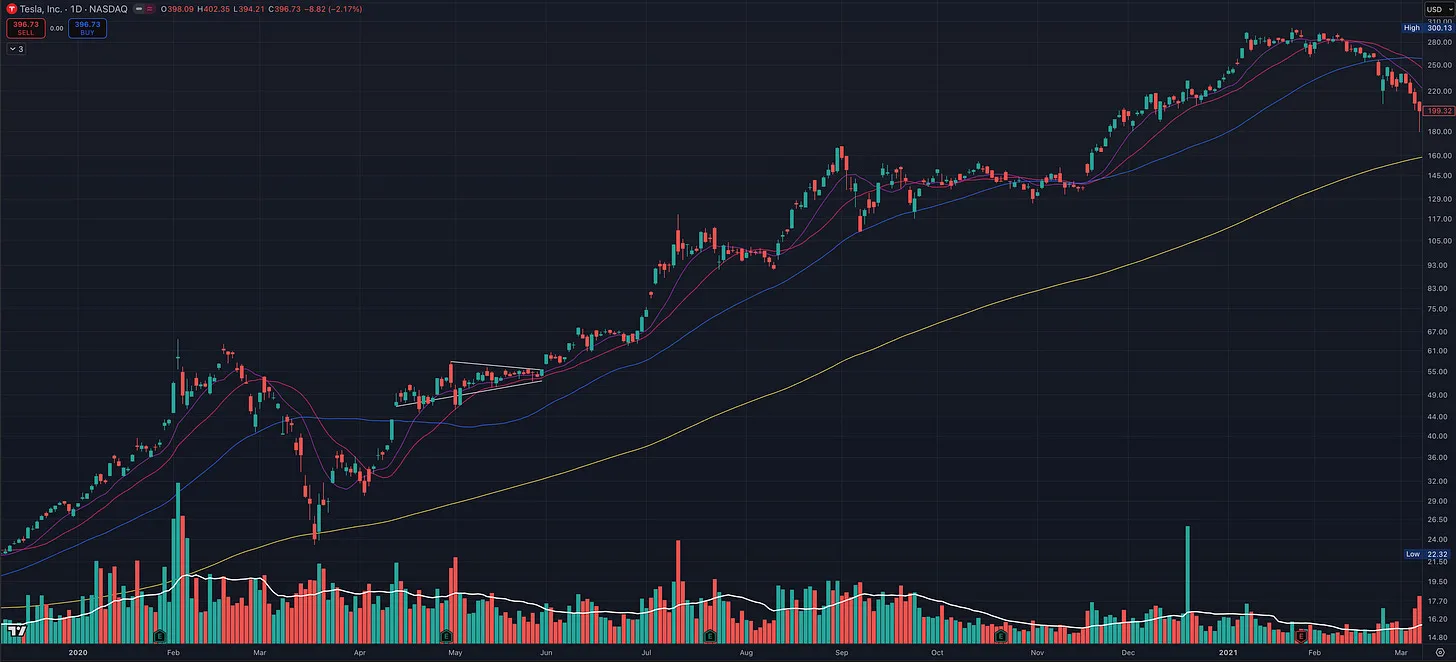
Most traders already know they are making this harder than it needs to be.
They know too many indicators usually mean too much noise.
They know jumping from Discord to Discord, alert to alert, and setup to setup is not a plan. It is disguised randomness.
They know the biggest stock market winners rarely come from clever opinions. They come from catching a handful of real leaders at the right time and managing them correctly.
And they know that if a trader can take a small account and compound it into life-changing money, it almost never happens because he discovered some magical indicator no one else knows.
It happens because he found an edge, proved it to himself through thousands of examples, and repeated it with discipline.
That is the story of Kristjan Kullamägi, known online as Qullamaggie.
He started trading in 2011 with a small account and no real system. Early on he blew up multiple accounts. Like many beginners, he traded too frequently, risked too much, and had no real understanding of position sizing or risk management.
Over time he stepped back and started studying charts obsessively. Instead of chasing alerts, he went through thousands of historical charts and built a massive database of screenshots showing what the biggest winning stocks looked like before they made their huge moves.
That work eventually paid off.
His trading account reportedly grew from $9,100 in 2013 to over $80 million by 2021, and his trading style has since become one of the most studied momentum frameworks online.
But the most interesting part is not the number.
It is the simplicity.
After years of studying the market, Kullamägi realized that the biggest opportunities kept appearing in just three repeatable setups:
- Breakouts
- Episodic Pivots
- Parabolic Shorts
These patterns appeared decades ago.
They appeared during the dot-com bubble.
They appeared during the COVID rally.
And they continue appearing today.
The Philosophy Behind the Strategy
At its core, Kullamägi’s approach is based on one simple idea.
Stocks move when demand overwhelms supply.
That demand usually shows up in one of three ways:
• A stock is already a leader and tightens before another major move higher
• A new catalyst forces the market to rapidly revalue the stock
• A stock becomes so extended that the move eventually snaps back
Those are simply three different expressions of the same force: demand overwhelming supply as capital flows aggressively into or out of a stock.
Kullamägi discovered these patterns through thousands of hours of chart study.
He went through thousands of U.S. stocks across decades of market history, saving screenshots and studying the setups that appeared before the largest price moves.
Over time those patterns became second nature.
That pattern recognition became the edge.
But the strategy works because of something even more important.
Risk management.
Risk Management: The Hidden Engine Behind the Strategy
Most traders focus only on entries.
Professional traders focus on risk.
Kullamägi’s risk framework is simple and strict:
• Most trades risk 0.25% to 1% of the account
• Most positions are 10–20% of the portfolio
• He avoids holding more than 30% of his account overnight in a single stock
This structure allows him to survive long losing streaks while still being positioned to capture massive winners.
Because the goal of the system is not to be right often.
The goal is to catch occasional moves that deliver 10x, 20x, or more relative to the initial risk.
When winners are that large, even a low win rate can produce exceptional results.
Standing on the Shoulders of Giants
Kullamägi didn’t develop his approach in isolation.
Like most great traders, he built his framework by studying the work of those who came before him.
His breakout philosophy is heavily influenced by William O’Neil’s classic book How to Make Money in Stocks, which emphasizes buying leading growth companies with strong earnings and sales as they break out of tight consolidations near new highs.
The Episodic Pivot concept was influenced by trader Pradeep Bonde of Stockbee, who popularized the idea of trading major gap ups caused by earnings surprises and other powerful catalysts.
Many professional traders and prop firms also focus on similar “stocks in play” situations where fresh news or earnings force the market to rapidly reprice a stock.
His use of the opening range breakout (ORB) as an entry tactic is also not new. Variations of the ORB have been used by traders for decades, including traders like Dan Zanger during the momentum markets of the 1990s.
What makes Kullamägi unique is not that he invented these ideas, but that he studied thousands of historical charts, refined these concepts, and distilled them into three simple, repeatable setups.
As Isaac Newton famously said:
“If I have seen further, it is by standing on the shoulders of giants.”
Trading works the same way. The market rewards those who study what has already worked, refine it through experience, and execute it with discipline.
Kullamägi built on these ideas and left traders with a clear framework that anyone willing to do the work can study and apply.
Setup #1: The Breakout
The breakout setup is the foundation of momentum trading.
If you study the biggest winning stocks over the past century, you will notice they rarely move in a straight line.
Instead they move in stair steps.
A strong advance.
Then a pause or pullback.
Then another advance.
This repeating structure is the basis of the breakout strategy and how many leading stocks behave during powerful trends.
Kullamägi primarily scans for these setups on the daily chart, since he trades them as swing trades. However, the same pattern can appear across multiple timeframes, including weekly charts and intraday charts.
What the Pattern Looks Like
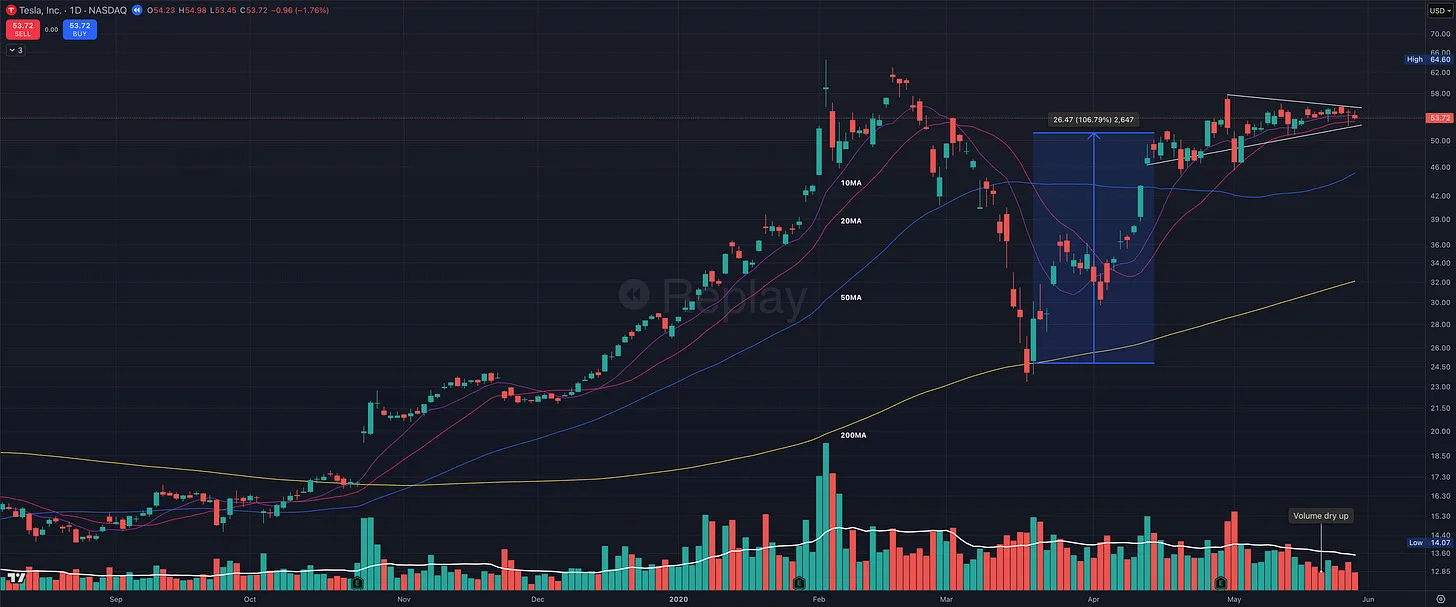
The breakout setup usually has three phases.
1. A powerful prior move
The stock rallies strongly over the previous 1–3 months.
This move is often 30% to 100% or more, typically occurring over a few days to several weeks.
This initial surge shows that strong demand has already entered the stock and that it may be emerging as a market leader.
2. A controlled consolidation
After the rally, the stock pulls back or moves sideways for several weeks.
During this phase the chart typically shows:
• Higher lows
• A tightening price range
• Price holding above the 10-day or 20-day moving average, and sometimes the 50-day
The consolidation usually lasts two weeks to two months.
During this period the stock often appears to “surf” along its rising short-term moving averages while volatility contracts.
3. The breakout
Eventually the stock expands out of that consolidation.
This range expansion is the breakout.
It marks the moment when demand begins overwhelming supply again and momentum traders look to enter.
Breakout Scanner Criteria
To find these setups, Kullamägi scans for stocks that are already leading the market.
He focuses on the top 1–2% of performers across three timeframes:
• 1-month
• 3-month
• 6-month
These scans help identify the stocks showing the strongest relative performance right now.
Additional characteristics traders look for include:
• Strong relative strength
• High volume during the prior advance
• Tight consolidations after the move
• Higher lows forming inside the base
The goal is to identify stocks that have already proven they can move and are simply pausing before the next leg higher.
Traders typically build a watchlist before the market opens, set alerts, and already know the position size they intend to take if the breakout triggers.
Breakout Entry
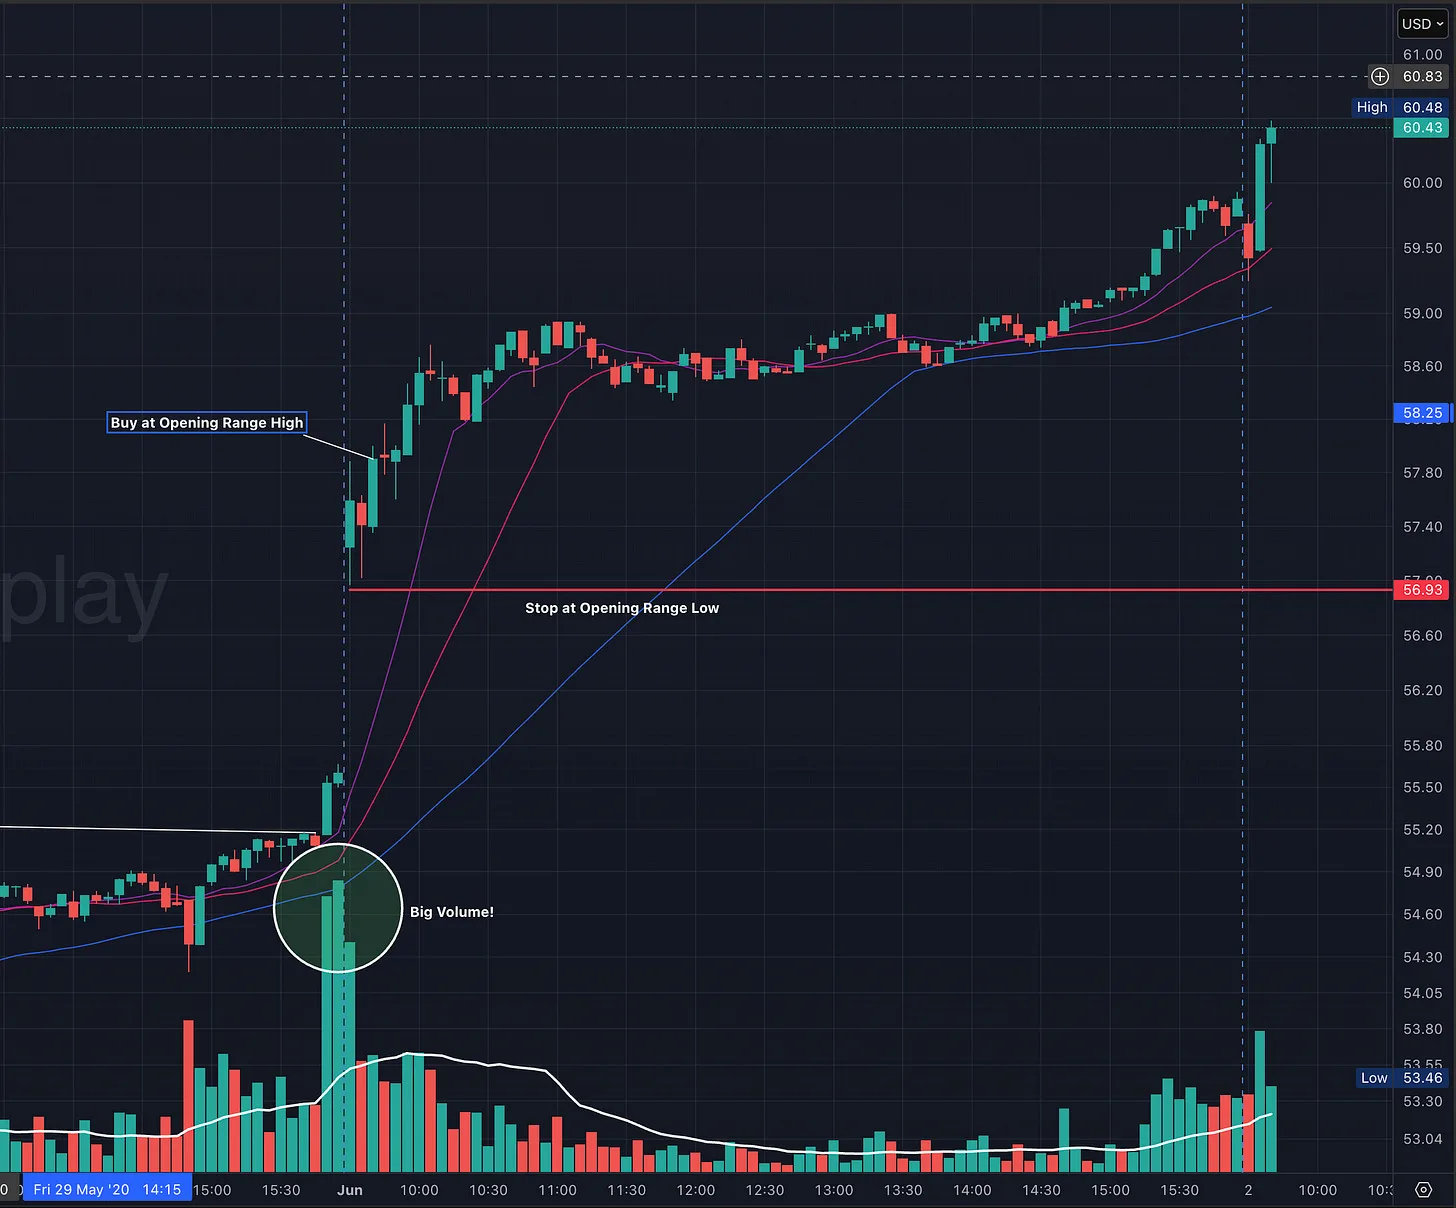
Kullamägi typically enters the trade using the opening range highs.
This means buying when price breaks above the high of the first:
• 1-minute candle
• 5-minute candle
• or the first 60-minute range (where the first candle is 30 minutes from 9:30–10:00)
Traders may use one or a combination of these timeframes.
However, intraday charts are not always necessary. The setup can also be traded directly from the daily chart when price begins expanding out of the consolidation.
Some traders try to anticipate the breakout early, but Kullamägi notes that this requires more experience and is generally less reliable.
Breakout Stop
Risk is defined immediately.
The stop is placed at the low of the day.
However, there is an important rule that protects the risk-reward profile.
The stop should not be wider than the stock’s ATR or ADR.
This ensures the trade maintains strong asymmetry.
For example:
• If a stock’s ADR is 5%, the stop should not be wider than about 5%.
• If a stock’s ATR is $0.50, the stop should not be wider than roughly $0.50.
If the stop required to stay in the trade is wider than the stock’s typical daily movement, the risk-reward profile becomes unattractive, and the setup is often best avoided.
Breakout Profit Management
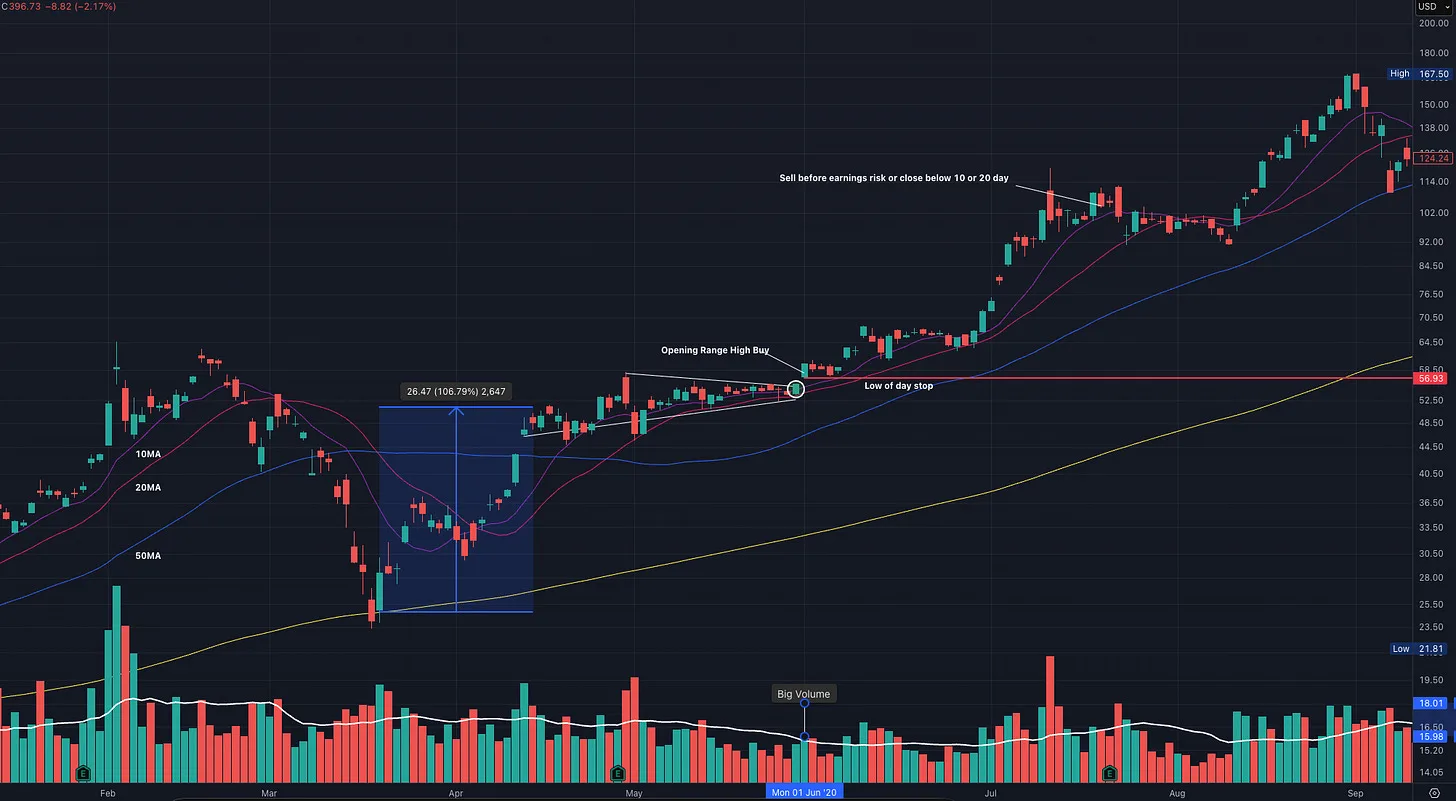
Once the trade begins working, the focus shifts to managing the position.
Kullamägi typically manages winners using the following framework:
• Sell one-third to one-half of the position after 3–5 days
• Move the stop on the remaining shares to break-even
• Trail the remaining shares using the 10-day or 20-day moving average
The choice of moving average depends on how fast the stock is moving.
For newer traders, he recommends using the 10-day moving average because it keeps the rules simple while still allowing the stock room to trend.
Importantly, exits are based on the first close below the moving average, not just an intraday move below it.
In strong bull markets, well-selected breakout trades can generate 10–20 times the initial risk, which is why the strategy can remain profitable even with a relatively modest win rate.
Setup #2: The Episodic Pivot
The Episodic Pivot, often called the EP, is one of Kullamägi’s most powerful setups.
While breakout setups usually appear in strong growth companies showing accelerating earnings and sales, often with CANSLIM-style characteristics that Kullamägi learned from studying William O’Neil’s How to Make Money in Stocks, Episodic Pivots are different.
They are triggered by major catalysts that suddenly change how the market values a company, forcing the market to rapidly reprice the stock.
When unexpected good news hits a stock, especially one that has been neglected or trading sideways, it can trigger a powerful move that lasts for months and sometimes even years.
Common EP Catalysts
There are many types of events that can trigger an Episodic Pivot:
• Earnings surprises
• Earnings guidance increases
• Government or regulatory developments
• Political or macroeconomic catalysts
• Biotech developments such as FDA decisions or drug trial results
• Major contracts or partnerships
Among these, Kullamägi focuses most heavily on earnings and earnings guidance, since they are the most consistent and easiest to trade.
What an Episodic Pivot Looks Like
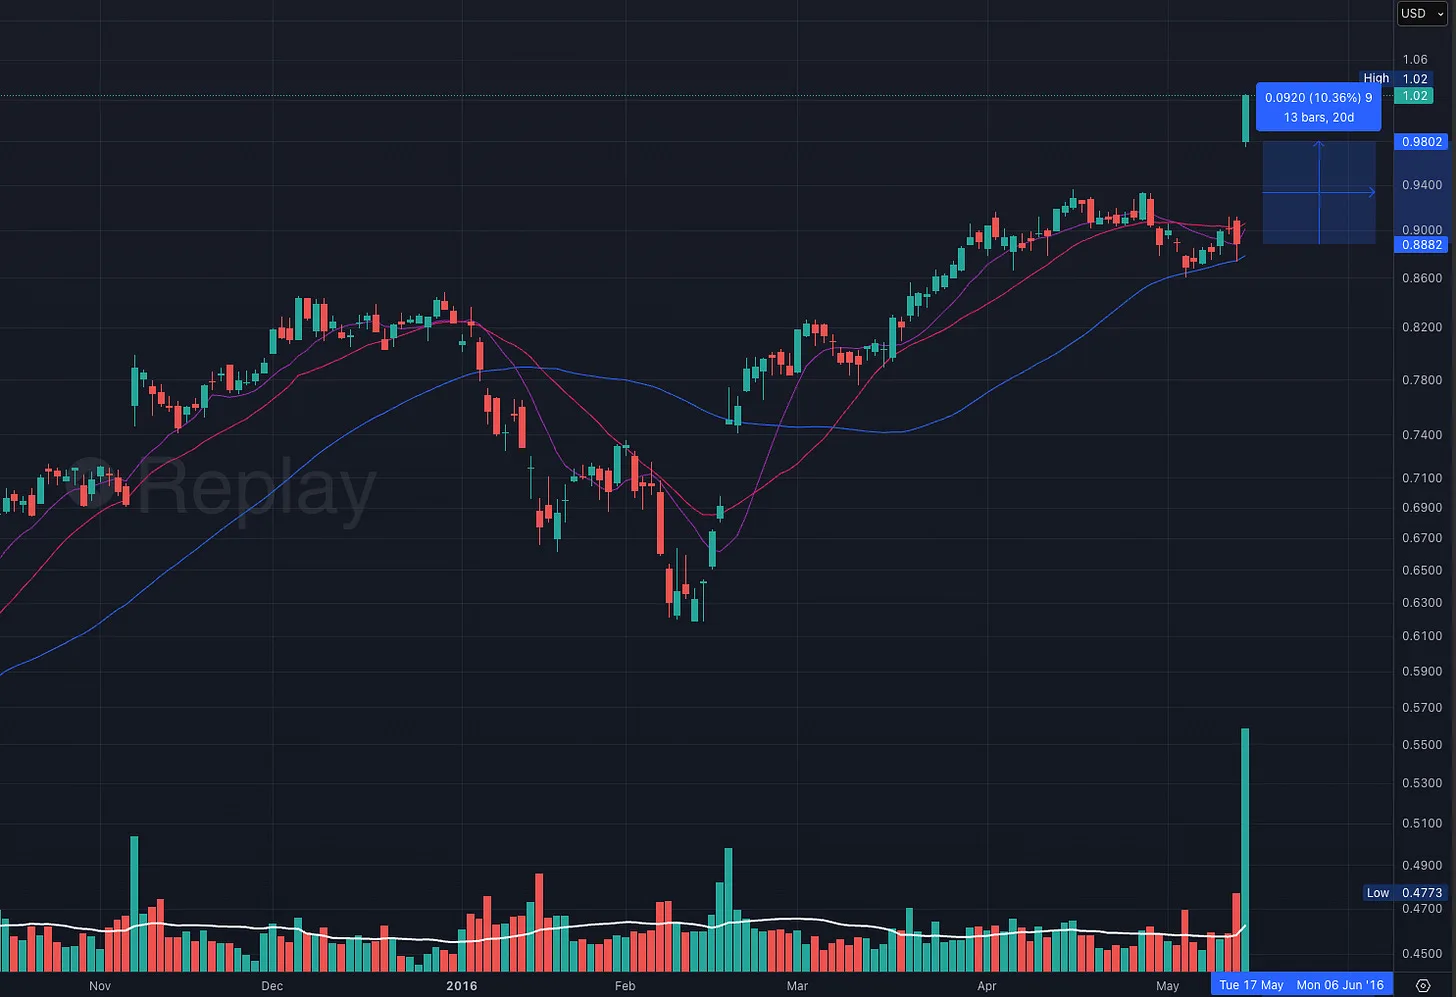
A true EP has several defining characteristics.
First, the stock must gap up 10% or more. This large gap reflects a sudden change in how the market values the company after the new information becomes public.
Second, the move must be confirmed by big volume. Ideally, strong volume appears in premarket trading. If not, it needs to show up immediately after the open. Many of the best EPs trade a large portion of their average daily volume within the first 15–30 minutes of the session.
Third, the catalyst must represent a genuine surprise to the market. In earnings-driven EPs, that usually means strong EPS growth, strong revenue growth, and a meaningful beat relative to analyst expectations. Many of the best examples show mid-double-digit, high-double-digit, or even triple-digit growth.
Finally, the stock should not already be extended. The strongest EPs often occur in stocks that have been trading sideways or consolidating for several months. If a stock has already rallied significantly during the prior 3–6 months, the move may be less powerful because the market may have already started pricing in the positive developments.
Episodic Pivot Scanner Criteria
To find EP setups, traders typically scan for:
• Stocks gapping up 10% or more in premarket or at the open
• Heavy volume, often far above normal levels
• A clear earnings, guidance, or news catalyst
• Strong relative volume, with heavy trading appearing in the first 10–20 minutes after the open
• Stocks that have not already made a large multi-month run
EP Entry
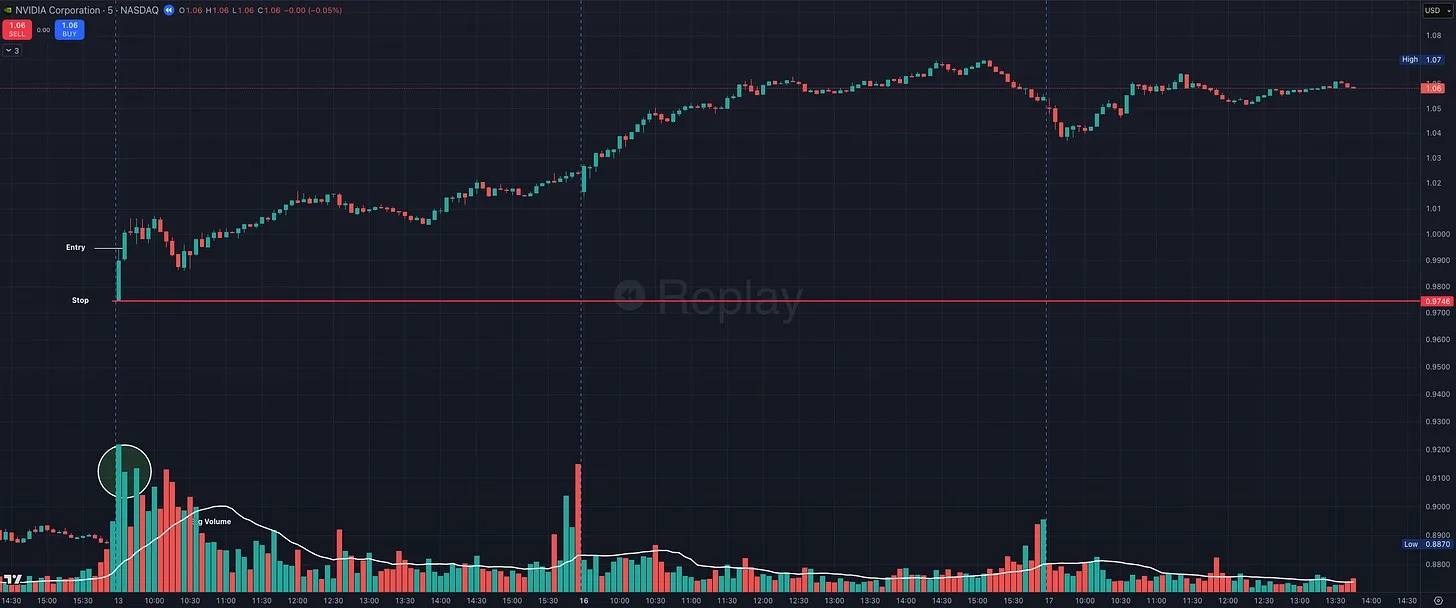
Entries again focus on the opening range highs.
Traders watch the first:
• 1-minute candle
• 5-minute candle
• or 60-minute range
Once price breaks that range with strong volume, the trade is triggered.
Kullamägi notes that many EP setups can be identified in after-hours or premarket trading, since traders are specifically looking for stocks gapping on major news or earnings.
EP Stop
The stop is placed at the low of the day.
This creates a clearly defined risk box and allows traders to size the position around a relatively tight level of risk.
EP Trade Management
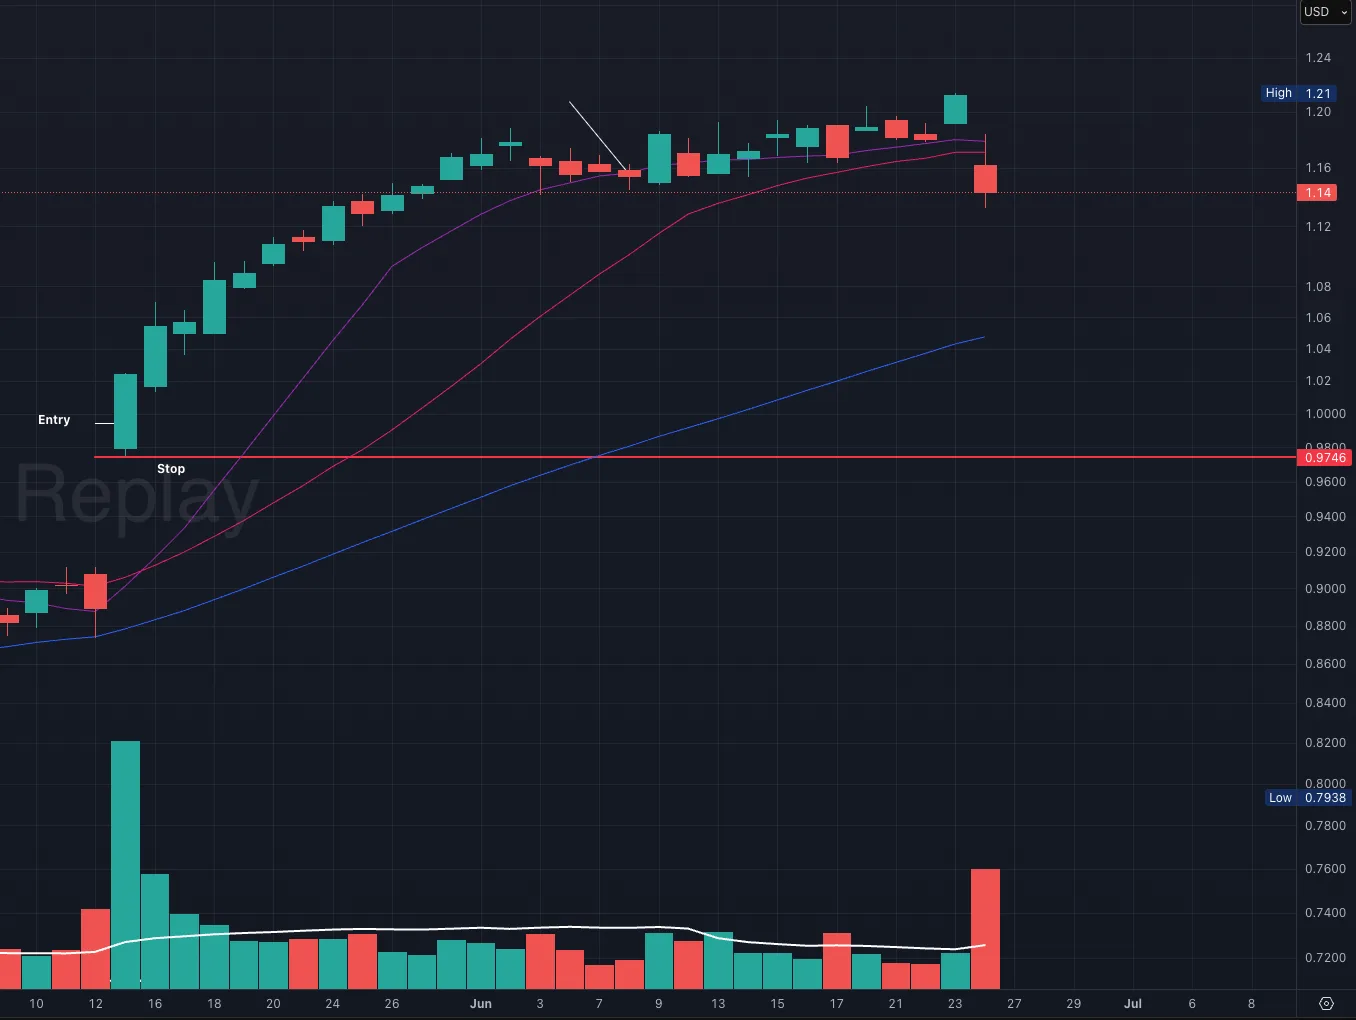
Once the stock begins trending, traders typically trail the position with the:
• 10-day moving average
• 20-day moving average
Some traders may also choose to use the 50-day moving average, depending on how long they want to hold the position.
These trends can sometimes last for months as sustained buying pressure continues to push the stock higher.
The Learning Curve
Kullamägi emphasizes that this setup takes time to master.
He says it often takes four to eight earnings seasons, or roughly one to two years, to become skilled at identifying and trading EPs consistently.
Once the pattern becomes familiar, the process becomes much easier. Instead of constantly searching for trades, the strongest EP setups begin to stand out naturally.
Setup #3: The Parabolic Move (Short and Long)
The third setup in Kullamägi’s playbook focuses on extreme momentum moves that become unsustainable.
Most of the time this appears as a parabolic short, where a stock rises so quickly that the move eventually exhausts itself and snaps back.
But the same concept can also appear in the opposite direction. After a successful parabolic short move, when a stock collapses rapidly and becomes extremely oversold, it can set up a parabolic long bounce.
In other words, it’s the same setup, just mirrored.
Parabolic Short
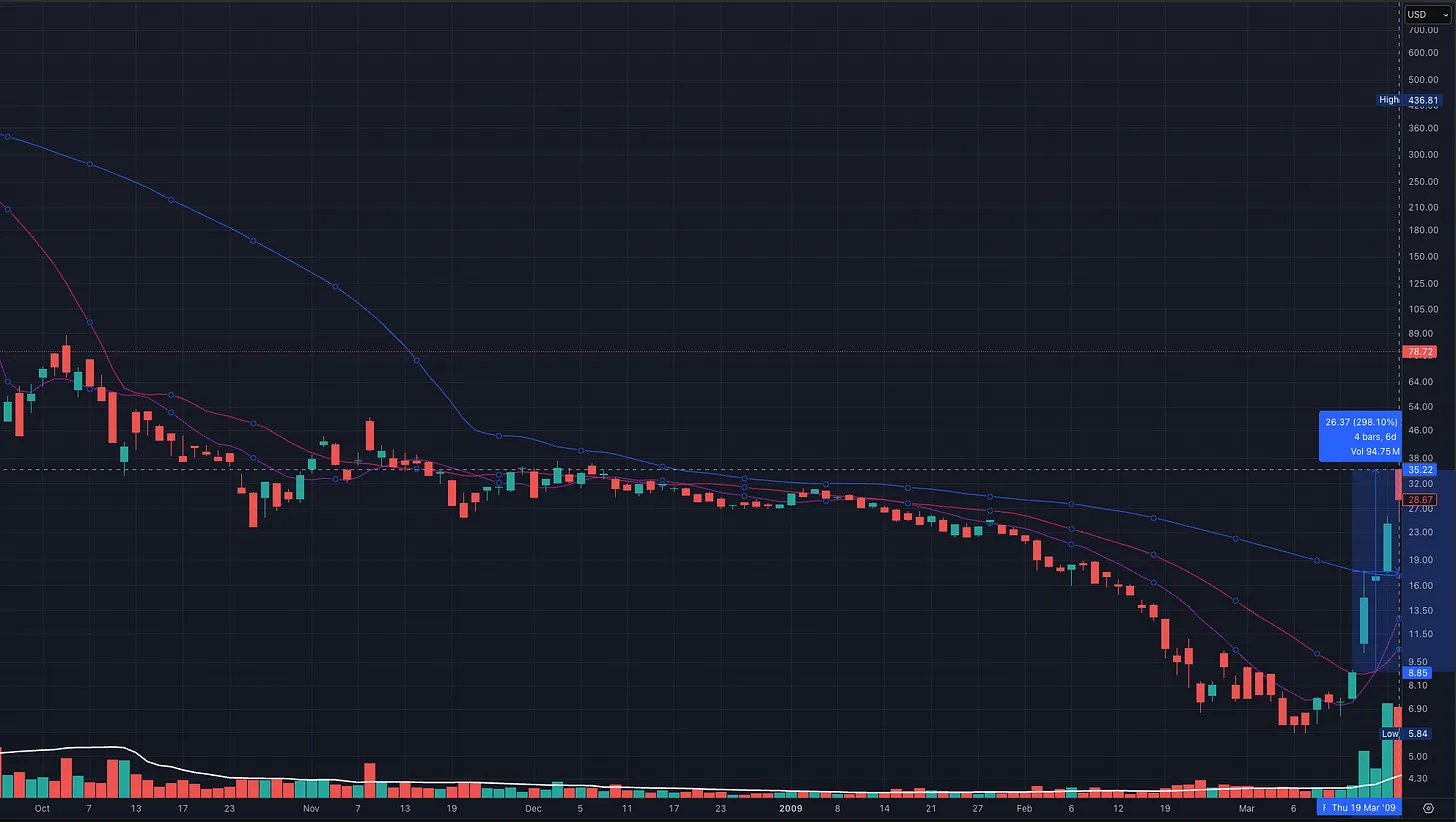
The parabolic short setup appears when a stock becomes extremely extended in a very short period of time.
Typical characteristics include:
• A stock up 50–100% or more in a few days or weeks
• Smaller stocks sometimes up 300–1000%+ in a short time
• 3–5 or more consecutive up days
• Increasingly vertical price movement
These explosive moves are often driven by speculation, hype, short squeezes, or sudden bursts of momentum. As the move accelerates, late buyers pile in, pushing the stock far beyond any reasonable short-term equilibrium.
Importantly, the longer-term trend does not matter. A stock does not need to have been trending higher for months to form this setup. In many cases it may have been weak, sideways, or even trending down before suddenly exploding higher over a very short period.
What matters is how far and how fast the stock has moved in the short term.
Eventually the move becomes stretched and unstable. Momentum begins to slow, buyers become exhausted, and the first signs of weakness appear.
That initial crack in the move is what traders look for when identifying a potential parabolic short setup.
The key is not to short too early. The edge comes from waiting until the stock shows clear signs that the parabolic move is breaking before entering the trade.
Parabolic Short Entry
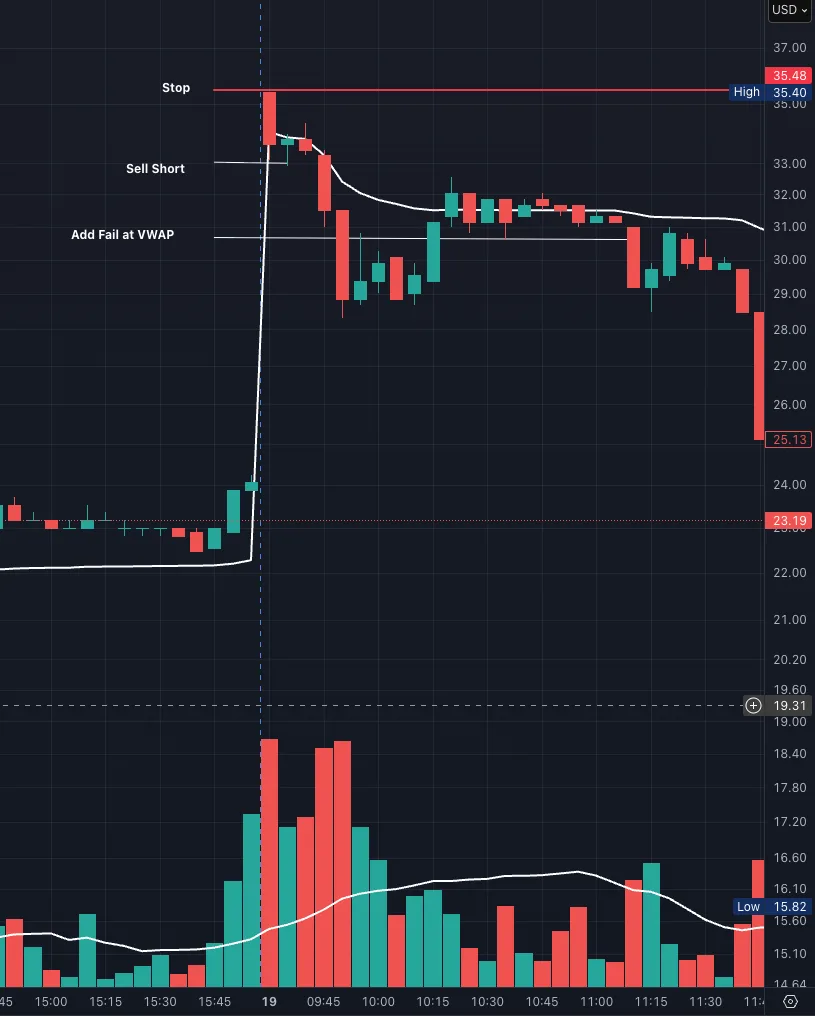
Kullamägi waits for signs that the move is starting to fail.
Common entry triggers include:
• The opening range low breaking
• The first red 5-minute candle
• A bounce into VWAP followed by rejection
VWAP is one of the few intraday indicators he uses for this setup.
Parabolic Short Stop
Stops are usually placed:
• At the high of the day
• Or just above VWAP when entering on a VWAP rejection
Parabolic Short Target
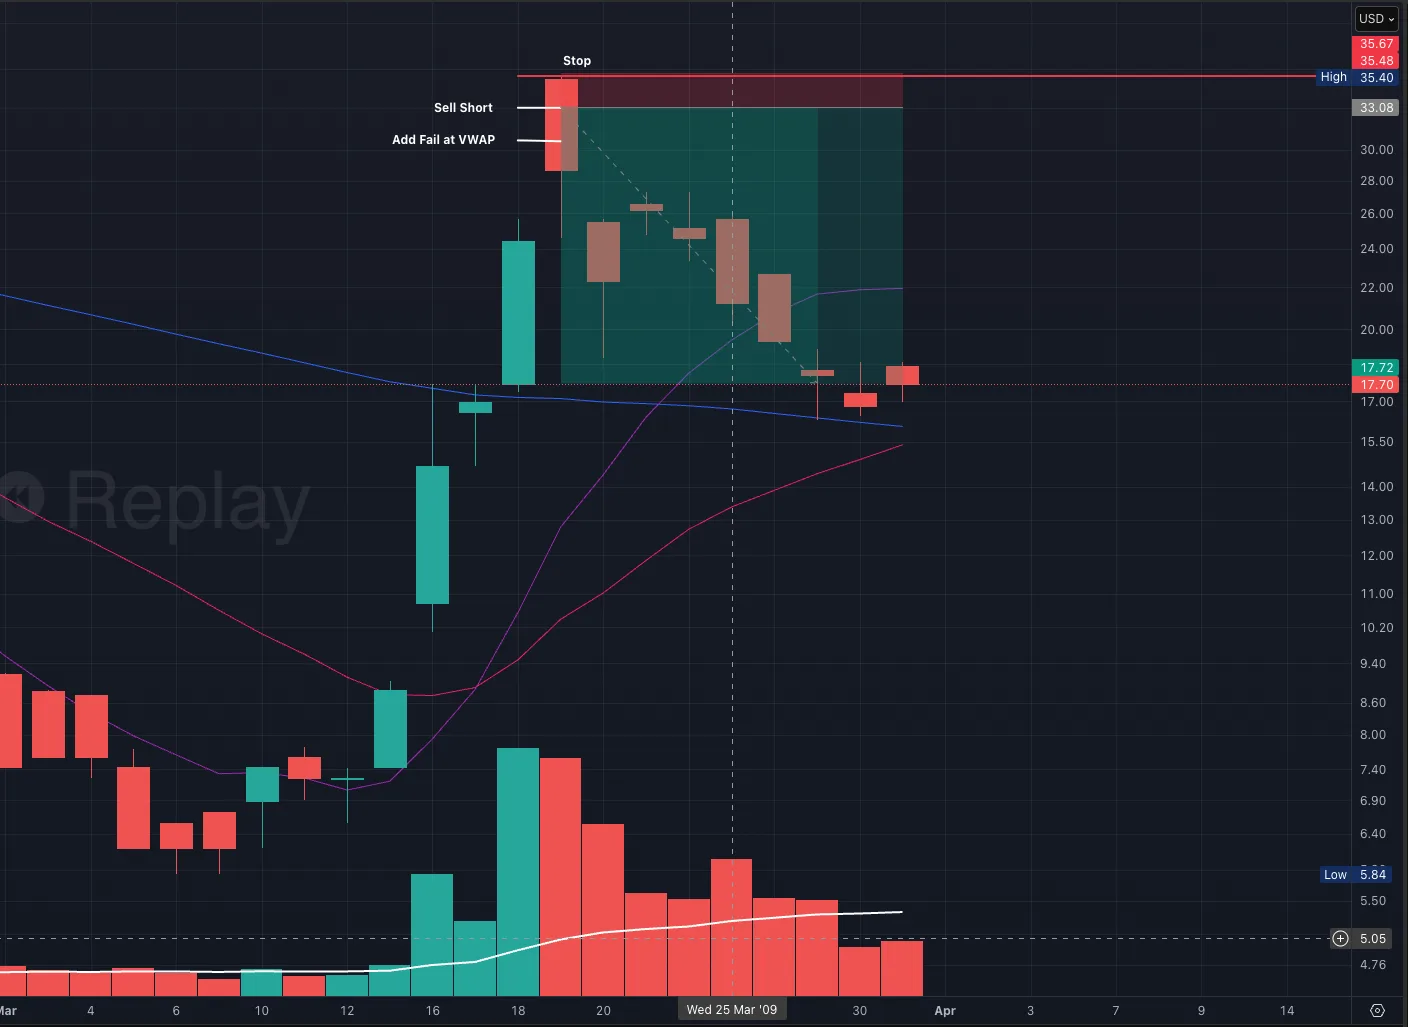
Most parabolic moves eventually retrace toward:
• The 10-day moving average
• The 20-day moving average
These setups often produce 5–10x the initial risk when timed correctly.
Parabolic Long
The parabolic long is simply the reverse situation.
If a stock collapses 50–60% or more in just a few days, it can become extremely oversold and produce a violent bounce.
Entry methods can include:
• The opening range high
• The first green 5-minute candle
• A range break to the upside if the stock consolidates briefly
These bounces can sometimes produce 50–100% moves in a few days.
The Key Rule
The most important rule for parabolic setups is patience.
Many traders try to short too early during the rise or buy too early during the collapse.
Kullamägi waits for clear signs that momentum is starting to fail before entering the trade.
The Real Secret: Pattern Recognition
All three setups are simple.
But they only work if you develop the ability to recognize them quickly.
Kullamägi spent years building a massive library of chart examples to train his pattern recognition.
He studied thousands of stocks and saved screenshots of the biggest winners before and after their moves.
Over time, those patterns became obvious.
That work is what separates professional traders from beginners.
Final Takeaway
Kristjan Kullamägi’s strategy is not complicated.
It’s a powerful example of how to swing trade with intraday precision using opening range breakouts on lower timeframes while managing winners on the daily chart.
Strip away the story and the account size, and the framework looks like this:
Find leaders.
Find growth stocks.
Find catalysts.
Find stocks in play.
Enter at tight inflection points.
Keep risk small.
Take partial profits.
Let winners run.
Because when losses are kept small and winners are allowed to run, the math begins working in your favor.
Kullamägi has said on multiple streams that his win rate can sometimes be around 30%, yet the strategy can still produce exceptional returns.
Why?
Because the losing trades are small, while the winning trades can be 5x, 10x, or even 20x the initial risk.
Three setups.
Relentless discipline.
Thousands of repetitions.
That is his winning playbook.
The edge isn’t complexity. The edge is discipline.
More in Legendary Traders
All Legendary Traders articles →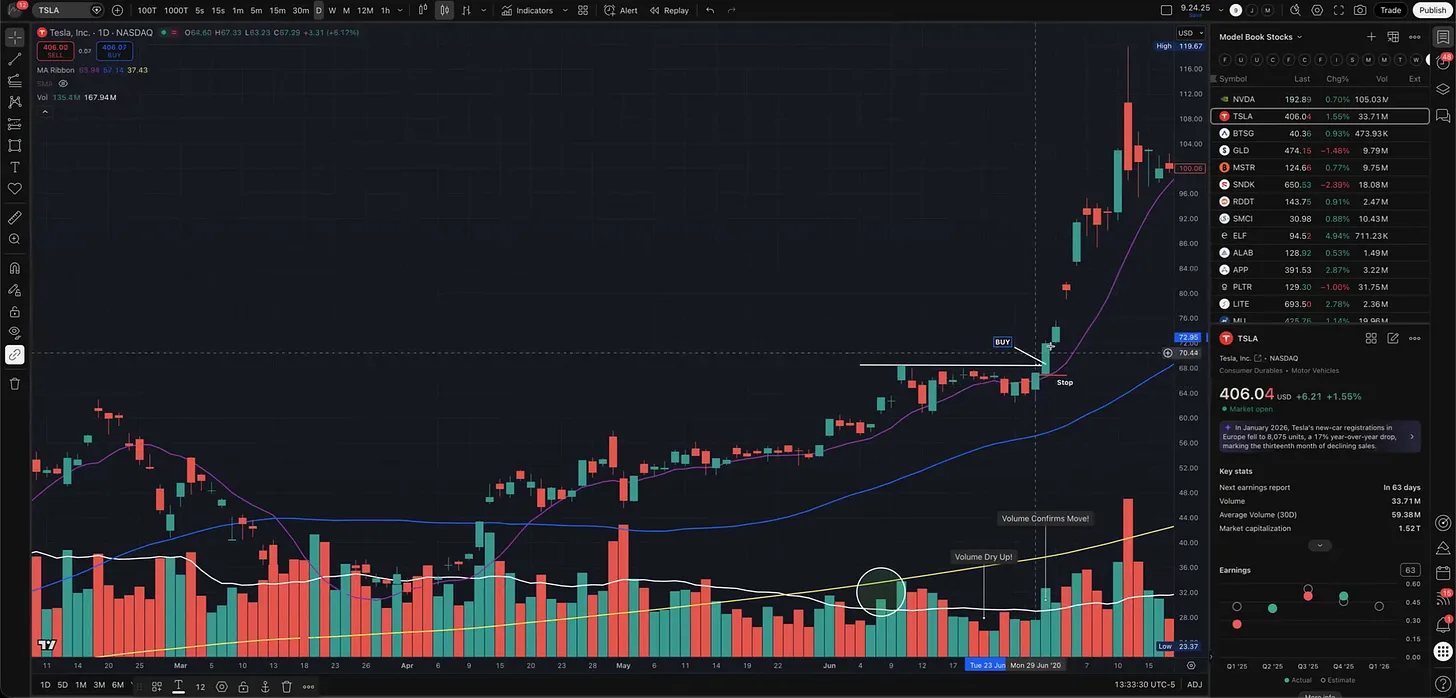
Sep 17, 2026 · Legendary Traders
4 Legendary Traders. 4 Breakout Entry Tactics.
A chart-by-chart breakdown of Minervini’s VCP, O’Neil’s cup with handle, Darvas’s box breakout, and Kullamägi’s opening range breakout.
- how to make money in stocks
- IBD
- Momentum Trading
- VCP
- technical analysis
- CANSLIM
- Trading Setups
- position trading
Sep 6, 2026 · Legendary Traders
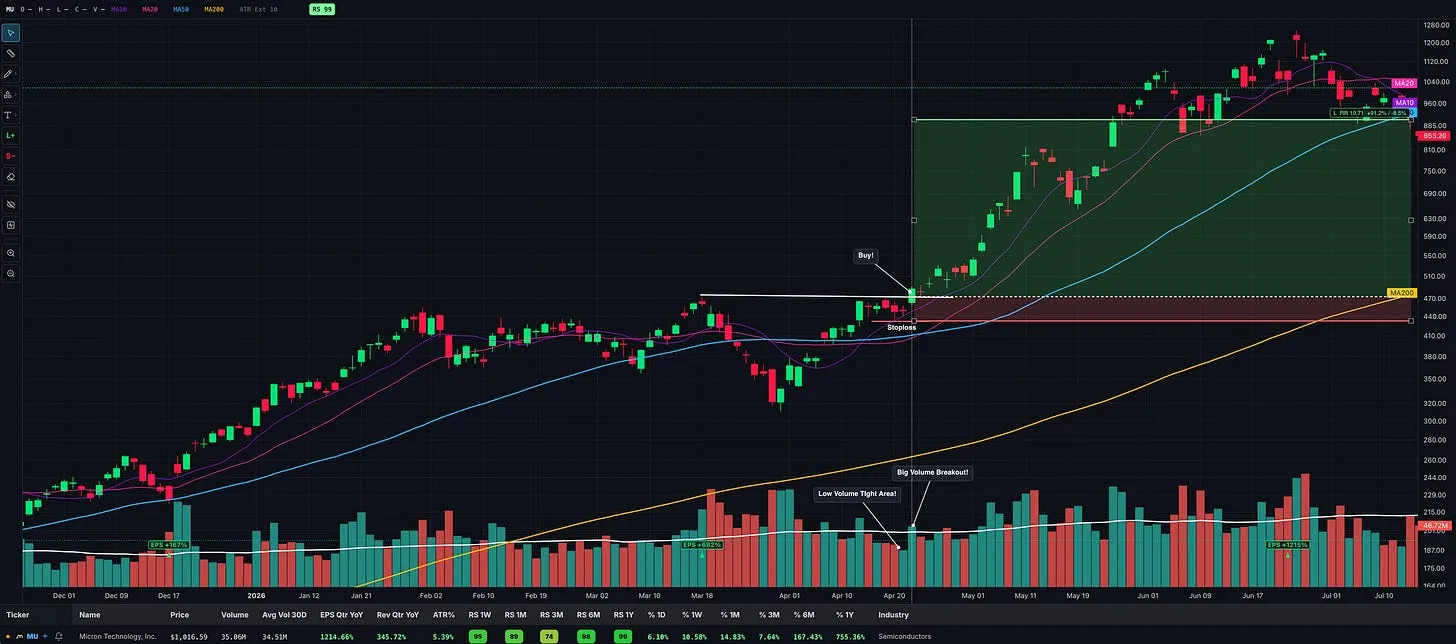
Market Wizard David Ryan: How He Made 1,379% in Three Years
Inside the growth-stock approach of William O’Neil’s protégé and three-time U.S. Investing Champion, from precise entries to holding major winners.
- IBD
- fundamental analysis
- Learn Trading
- technical analysis
- position trading
- David Ryan
- Market Wizard
- CAN SLIM
Aug 29, 2026 · Legendary Traders
Why the Market’s Biggest Winning Stocks Rarely Move Alone
Lessons from Nicolas Darvas, William O’Neil, and Mark Minervini on using industry-group strength and relative strength to find new market leaders without getting whipsawed.
- growth stocks
- CANSLIM
- position trading
- David Ryan
- stock trading
- Kristjan Kullamägi
- Nicolas Darvas
- industry groups