Momentum Trading Strategy

Notes

Chart Setups & Entries

When and where to buy a stock you have already found: chart patterns, buy points and entry tactics.

Showing 101–120 of 185 notes

View on Substack ↗

Why Great Setups Stop Working… And Then Start Again

The hidden cycle most traders never understand

Someone once asked Mark Minervini:

“If these setups work so well, what happens when everyone starts using them?”

It is a great question.

Because on the surface, it feels logical…

If everyone knows the setup, shouldn’t the edge disappear?

His answer was simple.

Sometimes they do stop working.

But then something interesting happens.

Traders move on.

They abandon the setup. They look for something new. They chase what is working now.

And once that happens…

The original setup starts working again.

Just like no single strategy works all the time, no single pattern works all the time.

And if you are relying on just one…

You either need to be patient and wait for conditions to come back, or you will eventually hit a wall.

That is why I built a toolkit of setups over the years.

Not one setup.

A playbook.

There are bull cycles where certain setups dominate.

And others where they barely work at all.

The edge comes from knowing:

what is currently working and adapting accordingly

The goal is not to find a perfect setup.

The goal is to stay aligned with what is working right now, while still grounding yourself in what has worked for decades.

View on Substack ↗

Chart Patterns Are Not Magic They Are Math in Your Favor

Why the best setups are about risk first and reward second

Somebody asked me recently…

“What is the real importance of chart patterns?”

It is a fair question.

Because yes, people have studied patterns for decades. They have tried to assign probabilities. They have tried to label what works and what does not.

That is not why I use them.

I use them because they create asymmetric opportunity.

They show me exactly:

where I am buying where I am wrong and what I stand to gain if I am right

If I am wrong, I lose small. If I am right, I make multiples of what I risk.

That is the game.

And this is not new.

Traders like Mark Minervini, Dan Zanger, and Kristjan Kullamägi have used variations of these setups for decades. William O’Neil was documenting these patterns going back over 100 years.

This is not reinventing the wheel. This is following what already works.

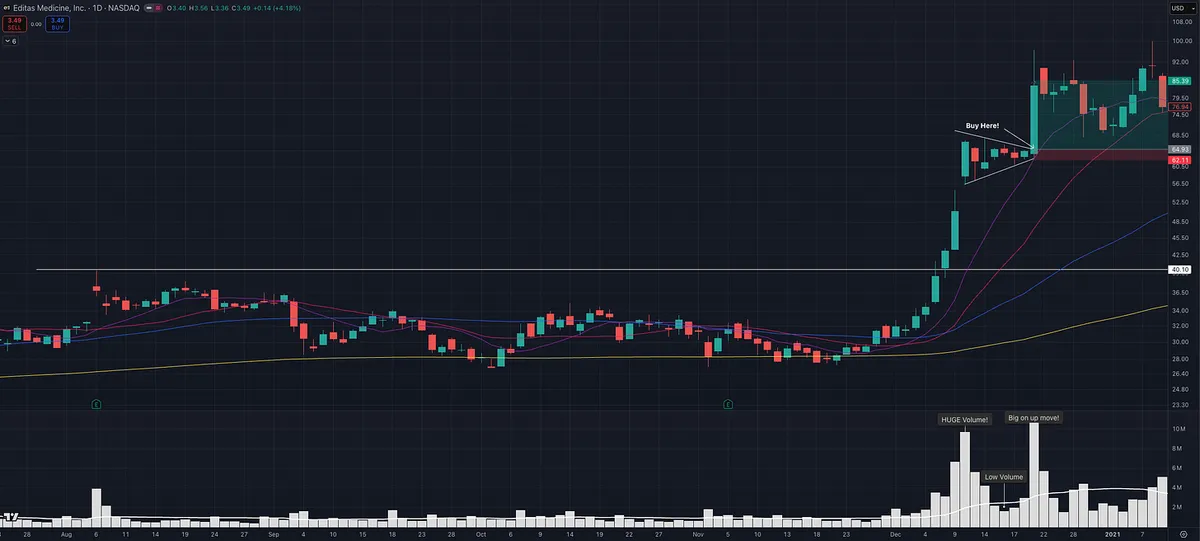
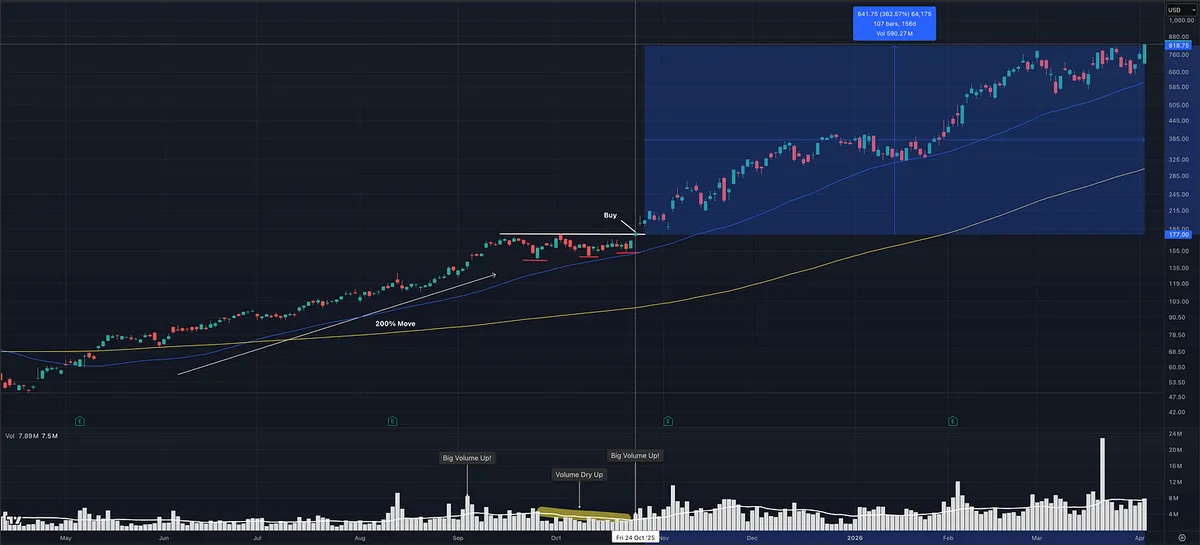
Take this example, EDIT.

You have a stock that explodes higher on massive volume, breaking out of a long base.

Then instead of collapsing, it does something very specific.

It goes sideways. Price tightens. Lower highs. Higher lows.

A squeeze.

That is where the opportunity forms.

That is where risk becomes defined.

That is where the trade becomes asymmetric.

In this case, you are risking roughly 4 percent. If you enter intraday using an opening range breakout, that risk can shrink to 1 to 2 percent.

If you are right, the upside can be 7 to 10 times that risk (or more!).

That is not about being right all the time.

That is about being right enough with the math on your side.

This specific setup is a variation of the Power Play concept from Mark Minervini.

It shows up over and over again.

Different names. Different markets. Same behavior.

And once you understand what you are actually looking at, you stop chasing trades…

and start positioning for opportunity.

👉 This is one of the core setups I break down inside the Momentum Trading Strategy Course.

View on Substack ↗

How to Spot Institutional Buying Before the Big Move

Most traders try to predict the next big move.

The best traders?

They follow the money.

Dan Zanger said it best:

“I want to go with the institutions when they go… I see massive volume, not just petty volume. If a stock is trading 4 or 5 million shares a day and all of a sudden it’s trading 15 or 20 million…”

That’s the tell.

Not opinions. Not headlines. Not indicators.

Volume.

But not just any volume…

Unusual volume. Massive volume.

Zanger takes it a step further:

He looks for percent change in volume. If a stock normally trades 4M shares and it’s already traded that in the first couple hours… it could finish the day at 12M, 16M or more. That’s a 300%–600% surge.

That doesn’t happen by accident.

Retail doesn’t do that.

Institutions do.

Hundreds of millions of dollars flowing into a name…

That’s what creates real trends.

And when you combine that with:

• Strong earnings and sales growth

• High relative strength

• A stock breaking out or acting right

You don’t just have a stock…

You likely have a market leader.

This is where most traders mess up.

They look for “cheap” setups. They overanalyze indicators. They ignore the one thing that actually matters:

Demand.

Massive demand.

If institutions want it badly…

You want it badly.

If they’re not there…

You shouldn’t be either.

Scan for volume.

Look for 300%+ spikes.

Find the leaders.

Then follow the money.

View on Substack ↗

“Volume Doesn’t Matter.”

I’ve heard that from people for years.

But after going through thousands of winning stocks and setups…

I keep seeing the same thing over and over:

Low volume on the pullbacks.

Explosive volume on the way up.

Quiet selling. Aggressive buying.

But yeah… I guess that doesn’t matter 😉

View on Substack ↗

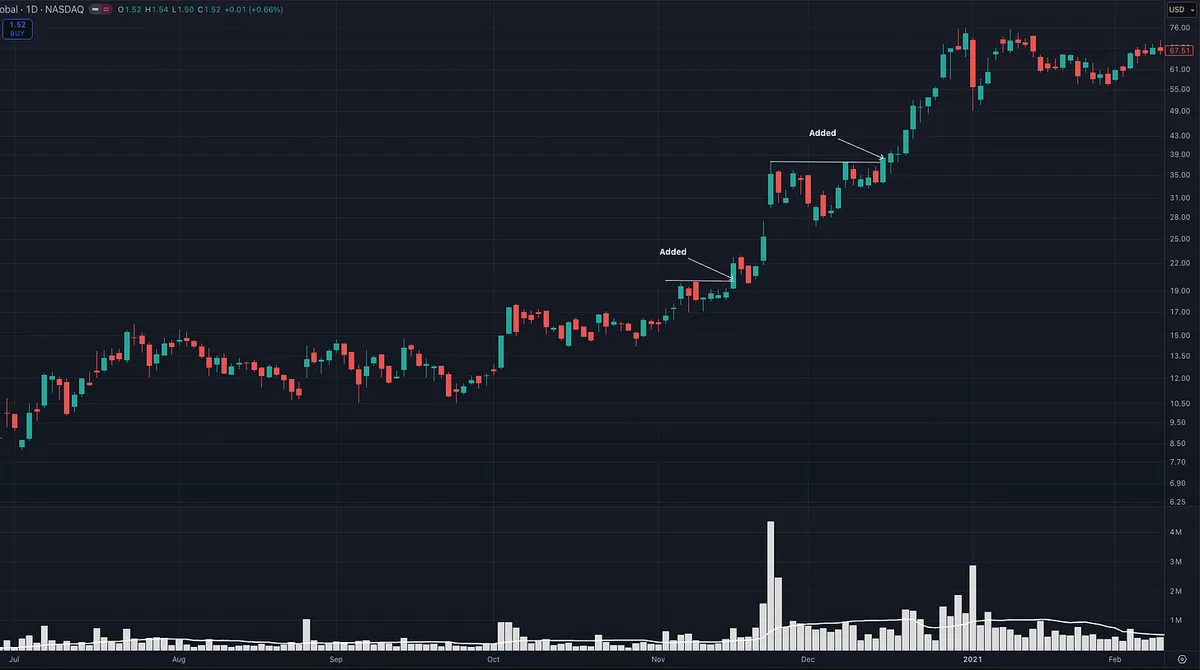
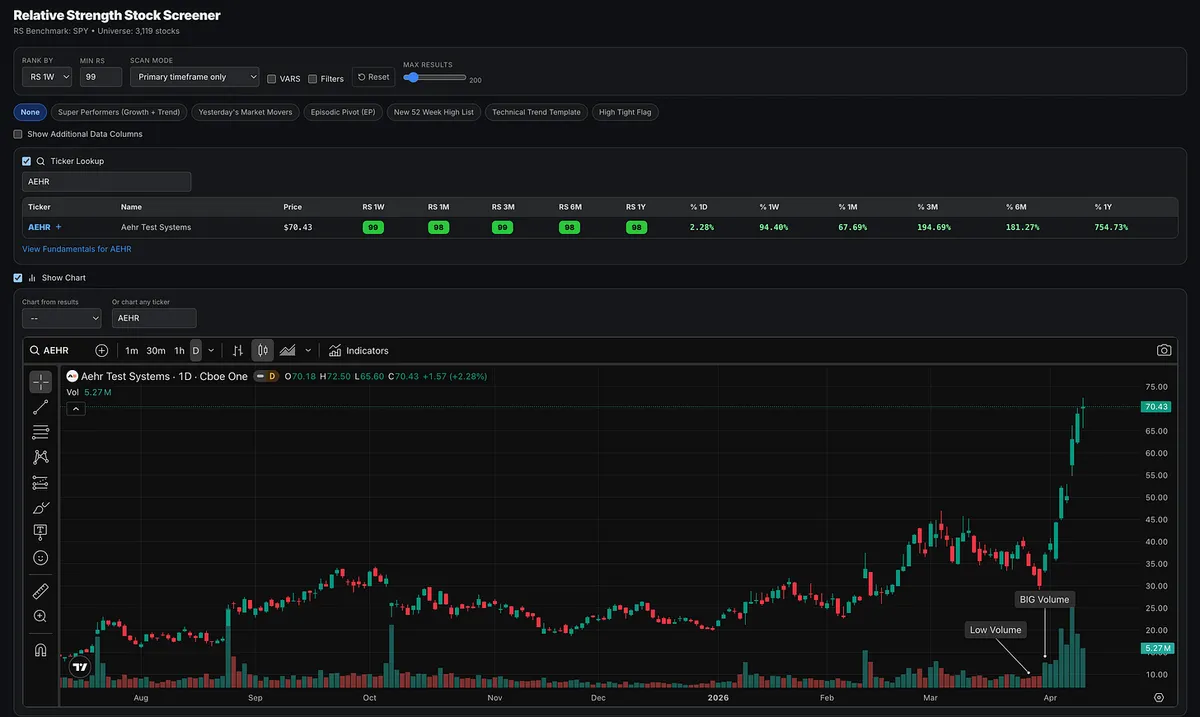
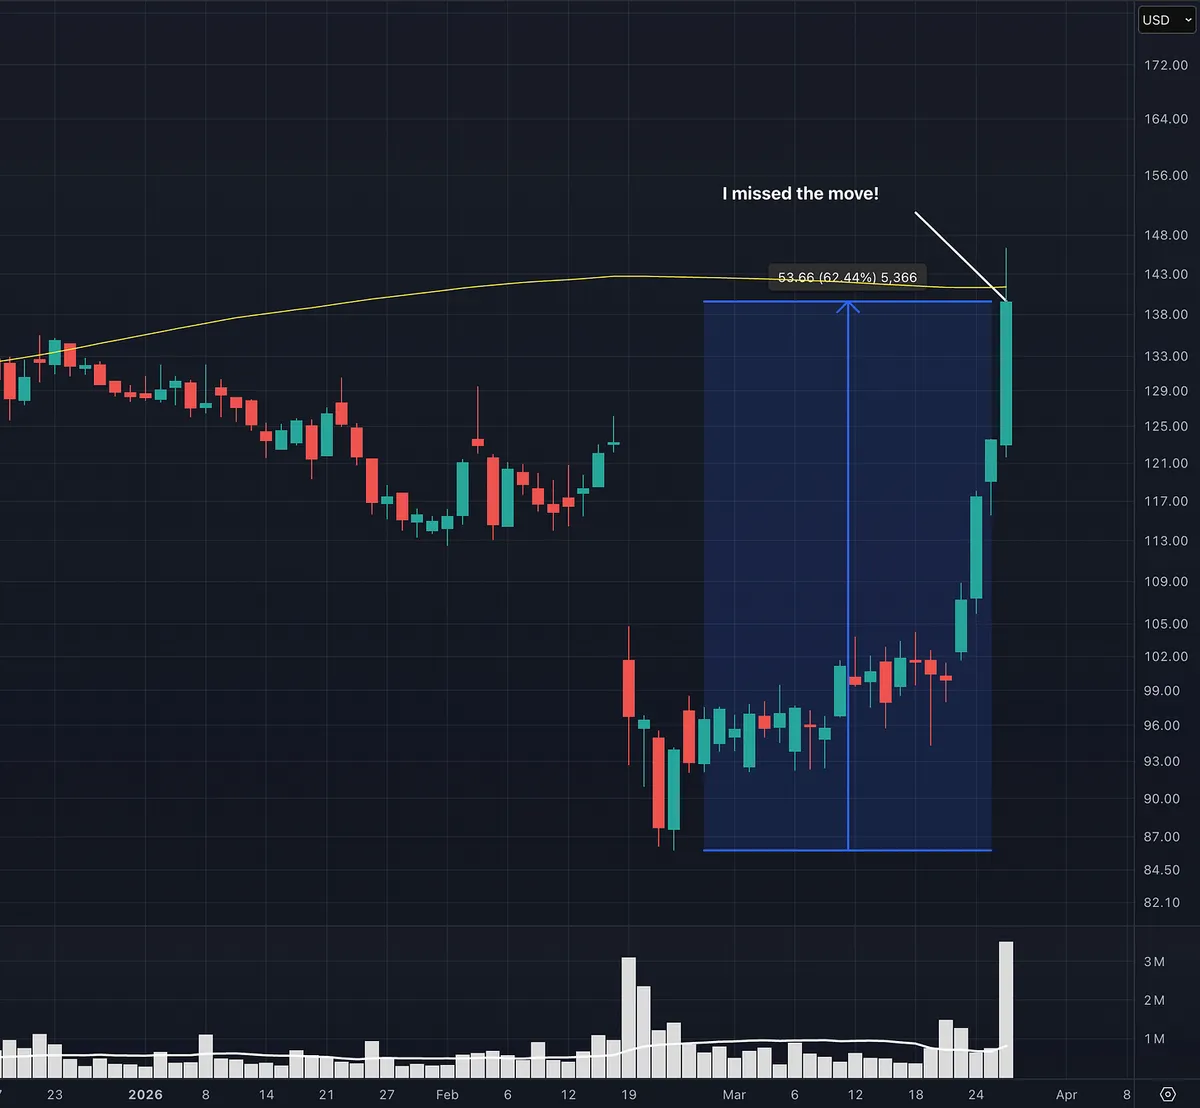
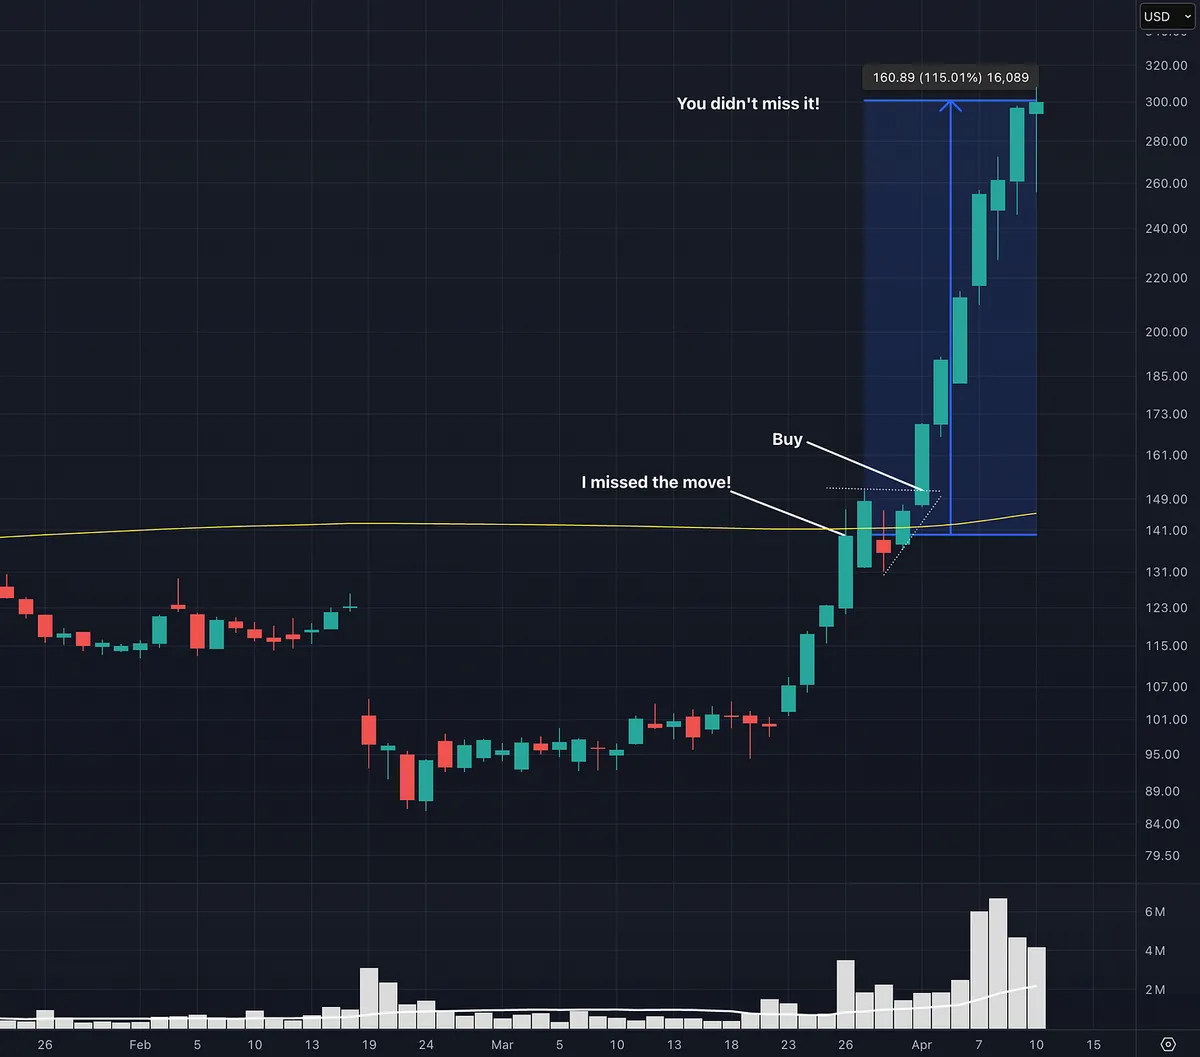
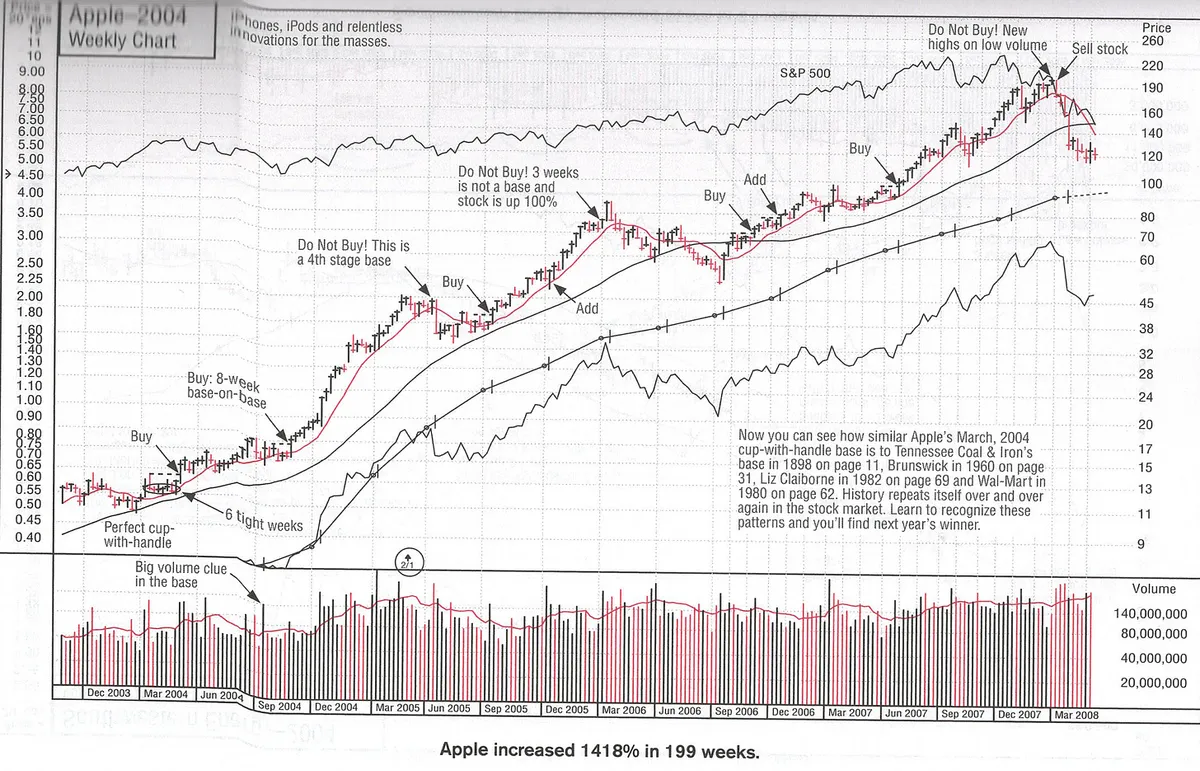
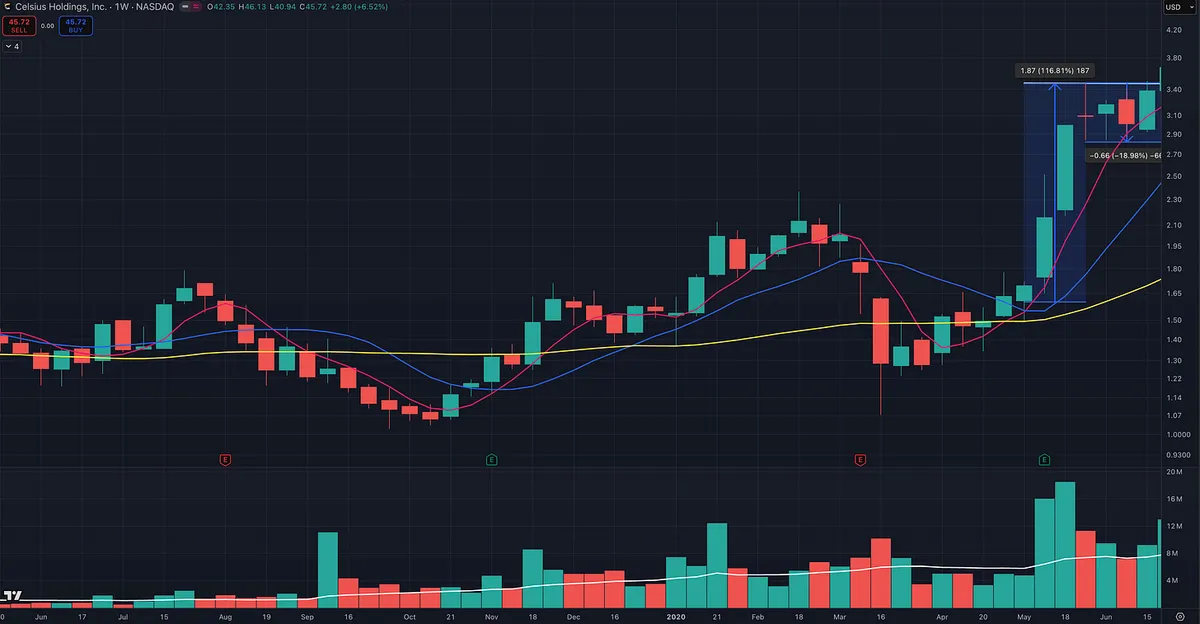
You Didn’t Miss the Move

Most traders think they missed it.

The stock is already up. It feels extended. So they move on.

But what they think is “the move”…

Is usually just the signal.

see image 1.

That first push, especially with strong relative strength and volume, is not the end.

It’s the heads-up.

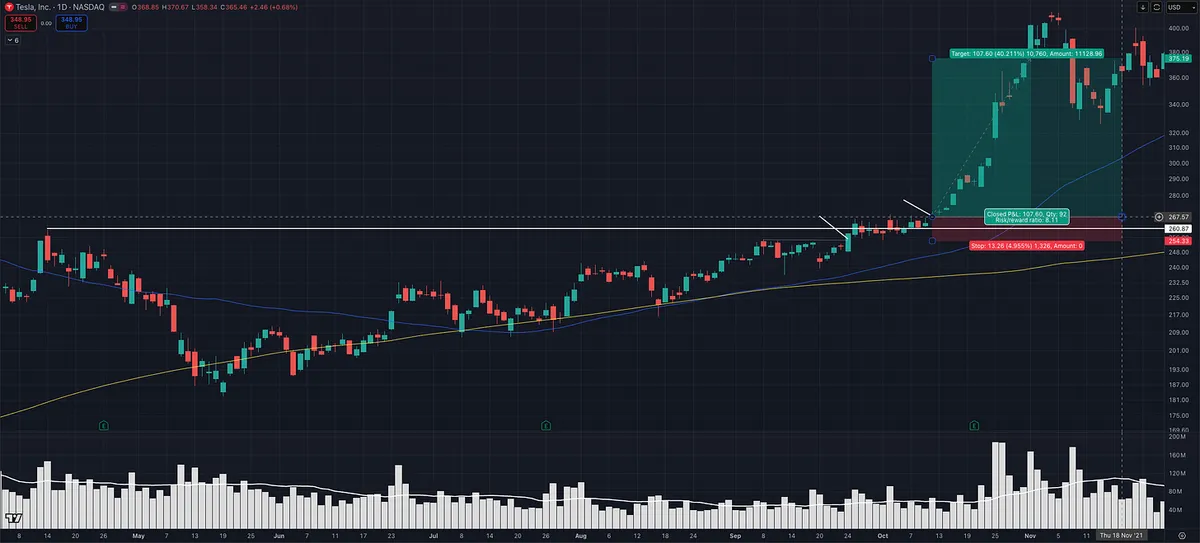
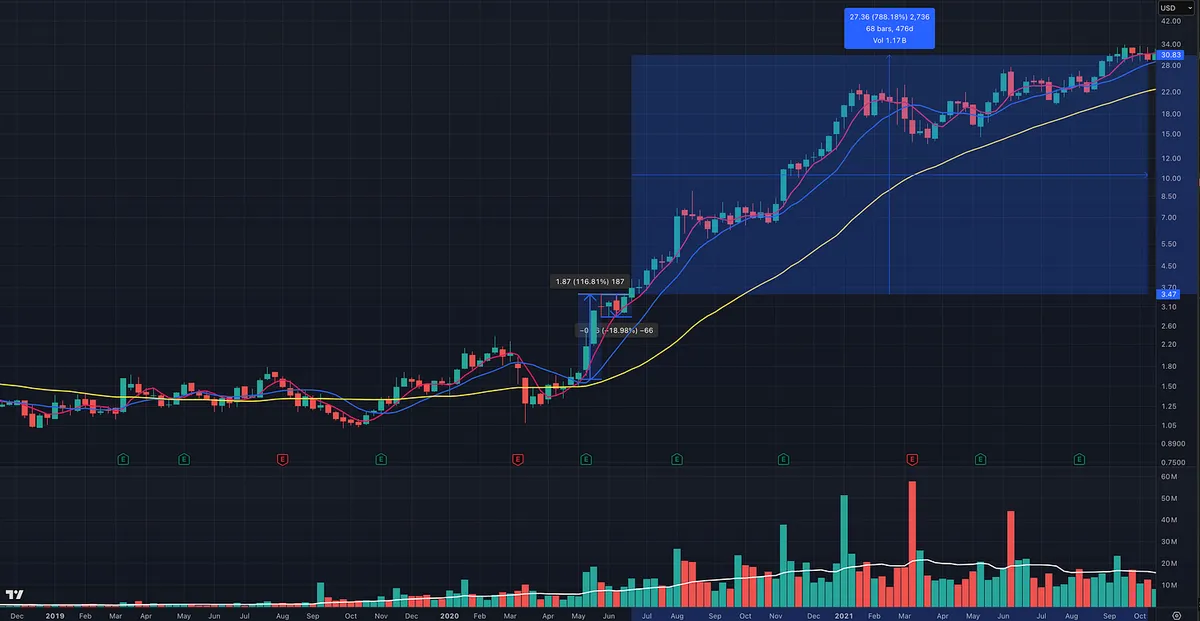
see image 2.

The real move often comes after.

The best stocks don’t move once. They move in stages.

If you’re waiting for it to look comfortable…

You’ll miss it every time.

Follow the strength.

$CAR

View on Substack ↗

Is a 5% Stop Too Tight in Today’s Market?

I got a great comment recently:

“It’s just that -5% is not much in today’s markets. Not enough not to get whipsawed. What’s your view?”

Here’s my answer.

I disagree.

There are still plenty of setups where you can risk 5 percent or less.

If that wasn’t the case, traders like Kristjan Kullamägi wouldn’t be as successful as they are.

Same with Mark Minervini. He won the U.S. Investing Championship in 2021. He’s still finding tight entries in today’s market.

It comes down to tactics and timing.

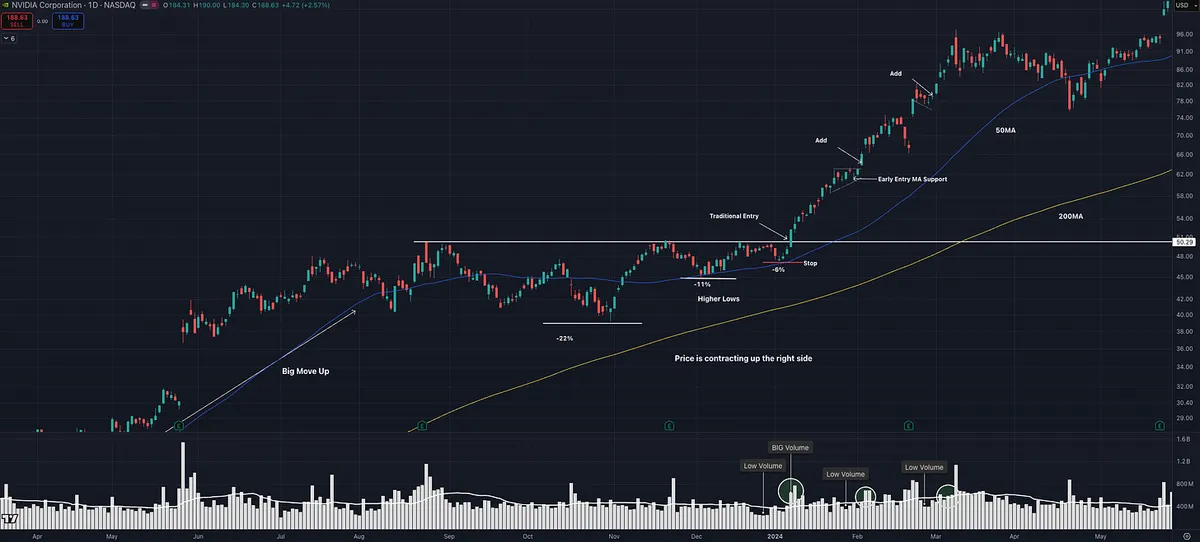
This TSLA example is a good illustration.

On the right side of the base, price was tightening and structure was clean. That created multiple opportunities where risk could be kept at 5 percent or less.

Recently (2025-2026), with many of the big winners already extended in Stage 2 uptrends, it’s a different environment.

If you’re only buying standard breakouts here, then yes, your stop likely needs to be 7 to 10 percent.

But that’s just one way to play it.

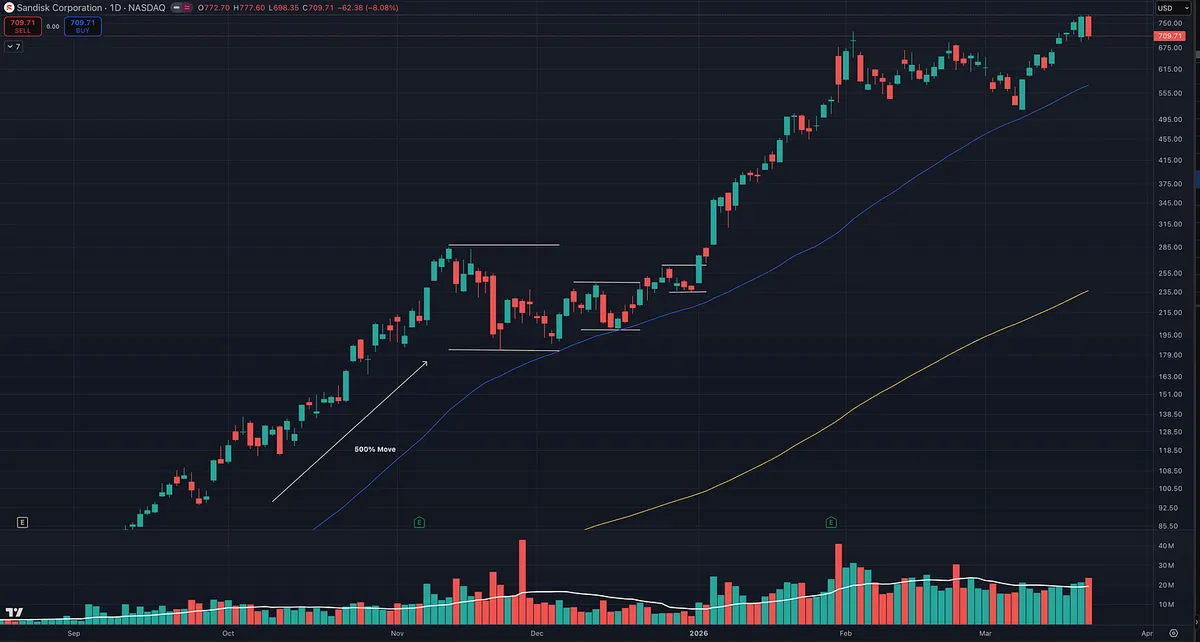
A lot of the big winners from 2025 to now in areas like computer data storage and telecom, names like LITE, SNDK, MU, CIEN, WDC, were harder to trade with tight risk using traditional breakout entries.

Their ADR% was higher, and there was less contraction into the pivot, so traders had to adapt.

Pullback entries. Low cheats. Intraday entries like ORB.

Those allow you to define risk much tighter and still participate without getting shaken out.

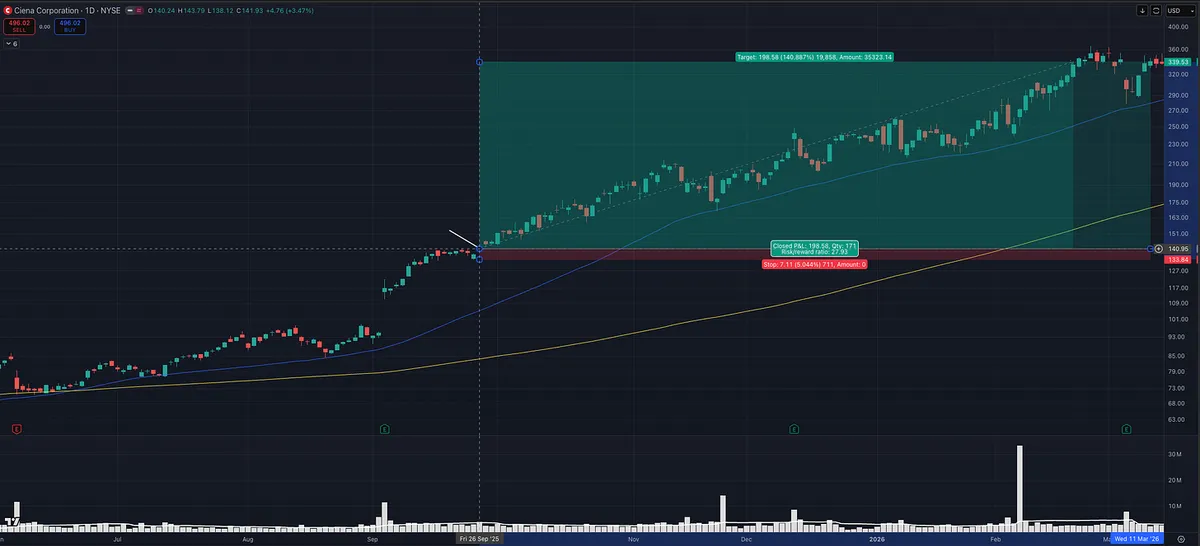
CIEN is another good example.

After an episodic pivot on earnings, price ran, then tightened sideways. That created a clean opportunity to enter with defined, tight risk.

This isn’t about forcing a fixed 5 percent stop on every trade.

It’s about finding entries with proven setups where tight risk actually makes sense.

Timeframe matters. Setup matters. Execution matters.

And just like Minervini, I’m not rigid with it.

Some trades might be 3 percent risk. Some 5 percent. Some 6 to 8 percent depending on the setup.

I’ll even go up to 10 percent and adjust position size, but I prefer tighter risk when the setup allows it.

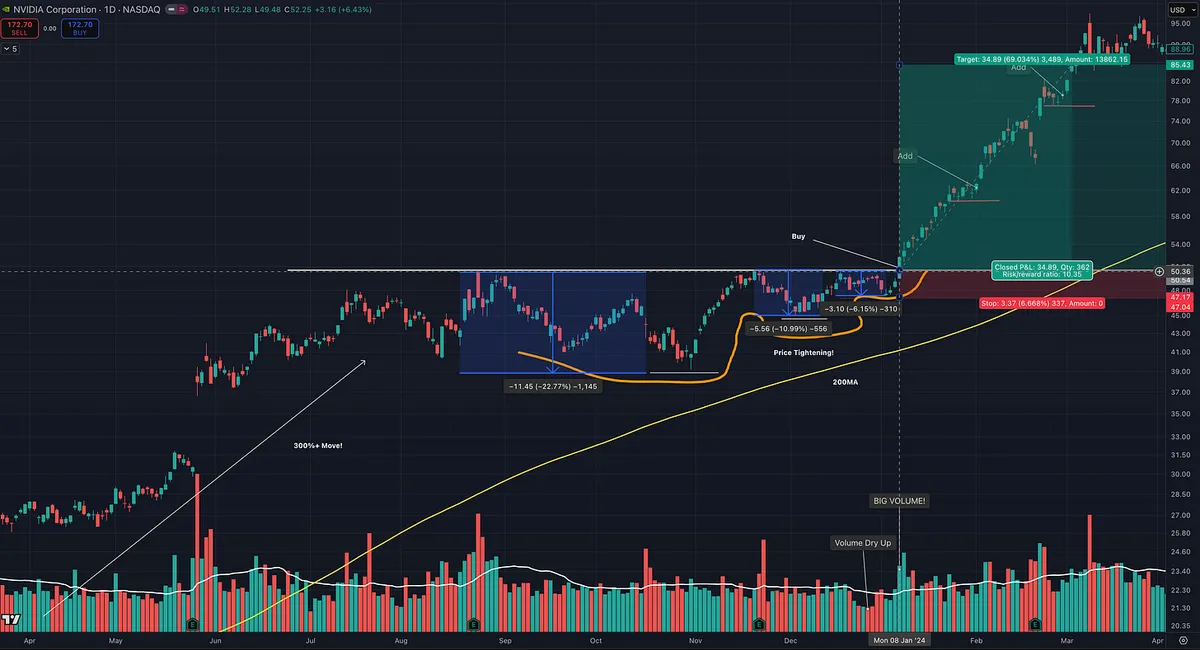
Another good example is NVDA in 2024. I had about 6 percent risk. Someone else could have taken the same trade and used the breakout day opening range low as a stop and risked closer to 1.82 percent and likely wouldn’t have been stopped out.

Like David Ryan often emphasizes, the best trades tend to be hard to buy, work right away, and don’t look back.

The principle stays the same.

Keep losses small. Don’t let one trade do real damage.

And at the end of the day, we all trade differently and that’s ok.

That’s what makes a market.

Different styles can still make money.

View on Substack ↗

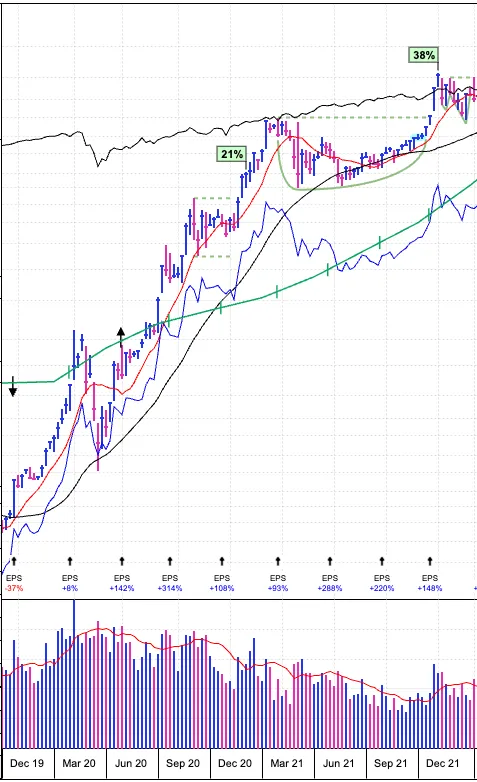
The Hardest Buys Are the Best Trades

The stocks that feel the hardest to buy are usually the ones you should be buying.

Why?

Because they’re showing real demand.

David Ryan, protégé of William J. O'Neil, said it best:

“The stocks that are hard to buy and immediately up that day, even that hour, are the ones that tend to be your biggest winners.”

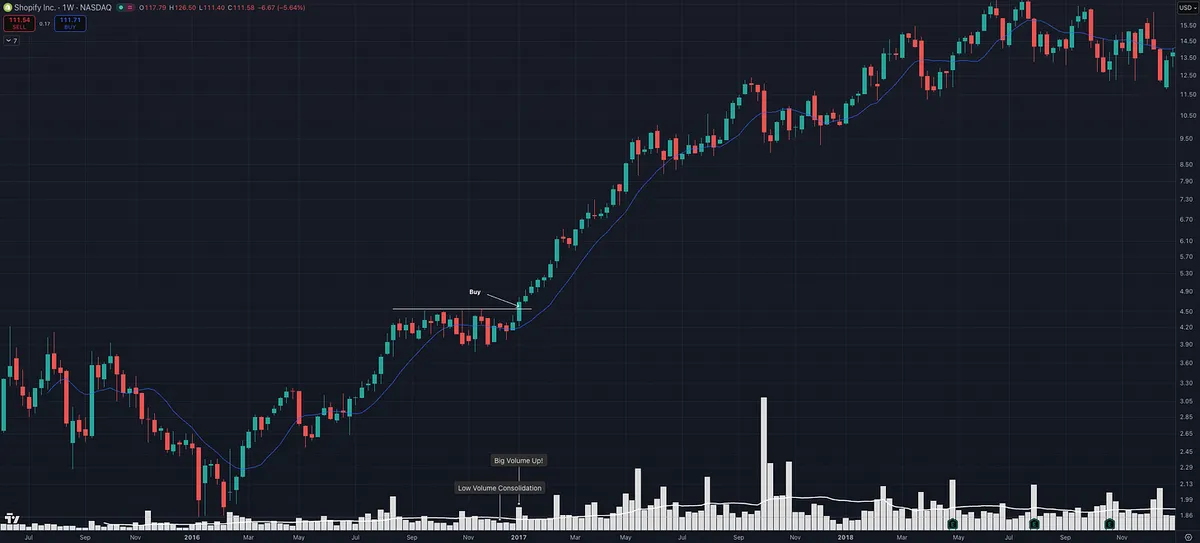
That’s exactly what you’re seeing in this chart.

Breakout on volume → immediate follow-through.

No hesitation. No pullback or second chance.

Just demand stepping in.

The best stocks are often profitable right away.

Having a profit on day one is one of the best indicators you’re going to make money on the trade.

If you’re sitting there waiting… thinking… hoping for a better price…

You’re probably looking at the wrong stocks.

The real leaders don’t wait.

They move.

And when your timing is right, you’re in the money immediately.

That’s not luck.

That’s alignment with strength.

View on Substack ↗

How Dan Zanger Turned $10K Into $18 Million With Simple Chart Patterns

Most traders look at charts every day and still miss the real move.

The edge usually is not more indicators. It is learning to recognize a small number of explosive patterns again and again.

Dan Zanger did not trade on hope. He focused on repeatable setups, managed risk, and pressed when the odds were in his favor.

That is still how top traders operate today.

Simple patterns. Strong trends. Ruthless discipline.

If you are serious about becoming a better trader, read this:

👉 https://tradingmomentum.substack.com/p/dan-zangers-golden-rules-for-trading

Study it. Screenshot it. Re-read it.

ArticleDan Zanger’s Trading Strategy: Chart Patterns, Breakouts & 10 Golden Rules
View on Substack ↗

You Can Absolutely Time the Market. Most People Just Don’t Know How

Timing the market is not impossible. It is a skill that can be developed.

For decades, the mainstream narrative has told you that you cannot time the market.

That is simply NOT true.

Does it take skill? Yes. Is it required if you want to trade at a high level? Also yes.

Timing broad indexes is more difficult. They are more efficient.

But individual stocks, especially small and mid caps, are different.

They are less efficient and that inefficiency creates more opportunity.

Great traders do not just buy good stocks. They master when to buy them.

They study supply and demand in real time.

They look for supply drying up as price tightens on the right side of a base. They watch volume contract on pullbacks and expand on advances. They wait for confirmation through higher highs and higher lows.

They align multiple timeframes. They read the tape with discipline.

This is not luck. It is pattern recognition built through repetition.

When you learn to time your entries, everything changes.

Risk gets tighter. Reward expands. Drawdowns shrink.

And most importantly, you stay in the game long enough to compound.

Timing is part of how you manage risk.

The traders who have done this for decades are not lucky. They are executing a repeatable edge.

Timing is part of that edge.

View on Substack ↗

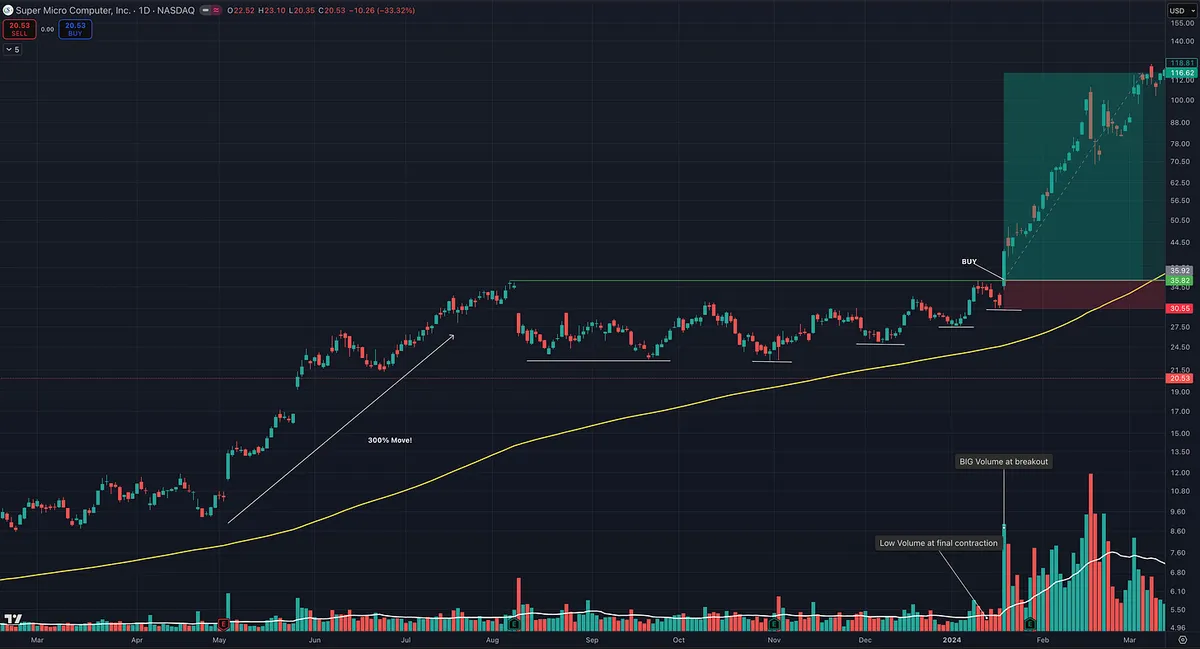
The Quiet Clue Before Every Big Move

How shrinking volume signals supply exhaustion before explosive breakouts

Most traders stare at price.

The best traders watch price and what’s disappearing.

Because the biggest moves don’t begin with excitement.

They begin with silence.

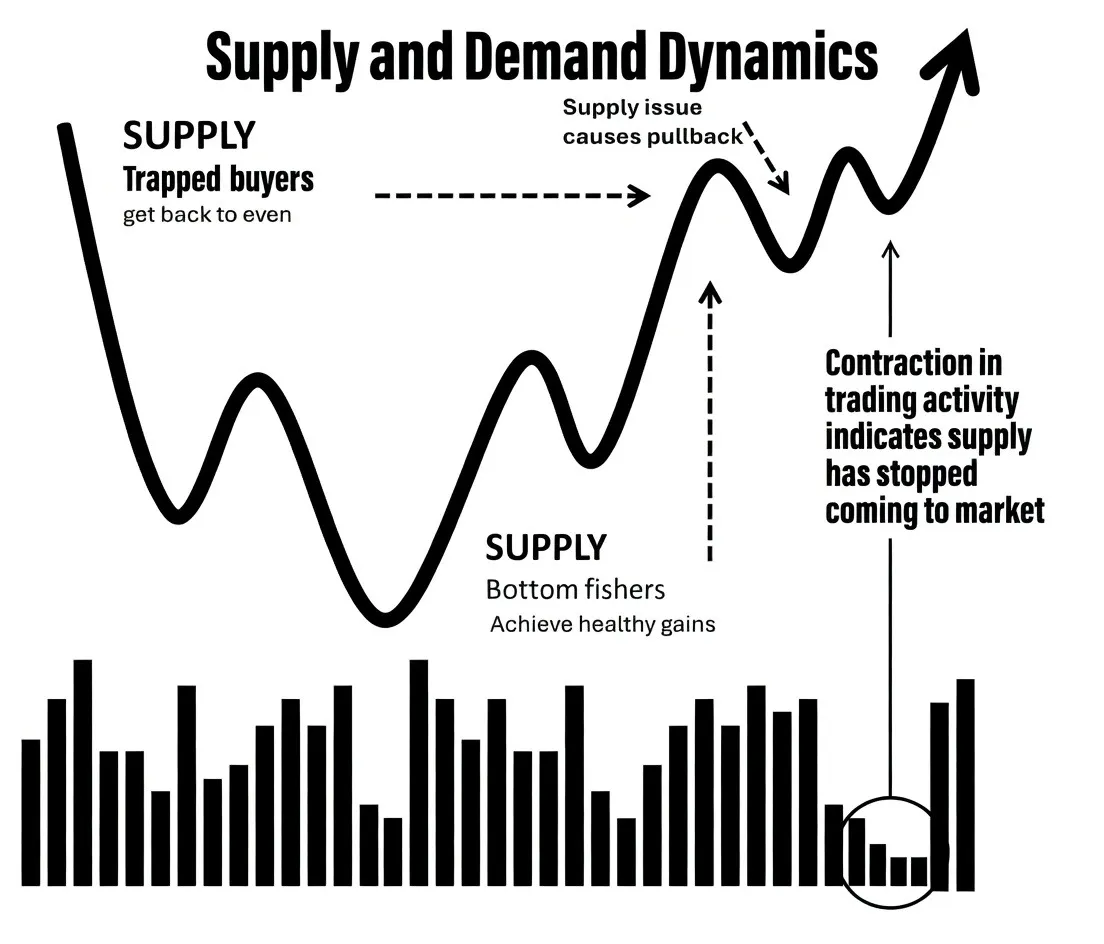
Look at the image.

Price pulls back.

Weak hands get shaken out.

Trapped buyers sell just to break even.

Supply comes into the market.

This is where most people lose interest.

But this is where the real signal begins.

Something subtle happens.

Volume starts to dry up.

That is not random.

That is the market communicating clearly:

The sellers are running out.

And when supply disappears, price does not need much demand to move higher.

This is straight from the Minervini playbook.

Early pullbacks create supply from trapped buyers.

Repeated tests absorb that supply.

Tight price action combined with declining volume signals that supply is nearly gone.

Now the equation changes.

You are no longer buying strength.

You are buying after weakness has already been removed.

That is a completely different edge.

Ask yourself this:

If nobody is left willing to sell, what happens when buyers step in?

Price expands.

Breakouts hold.

Trends accelerate.

This is how asymmetric opportunities are created.

Not by chasing.

But by waiting for pressure to disappear.

Next time you study a chart, focus on one thing:

Is supply drying up or is it still present?

Because price is just the result.

Supply and demand is the driver.

And the traders who understand that are the ones who catch the real moves early.

View on Substack ↗

The Setup Isn’t the Problem… The Environment Is

The same pattern that works today can fail tomorrow if you ignore context.

Ever notice how a setup works great for a while… then suddenly stops?

It’s not random.

It’s the environment.

Most traders obsess over patterns but ignore when those patterns actually work.

Coming out of a correction or bear phase, you will see a lot more cup and handle setups.

Why?

Because stocks are rebuilding. They need time to repair damage, shake out weak hands, and form proper bases before moving higher.

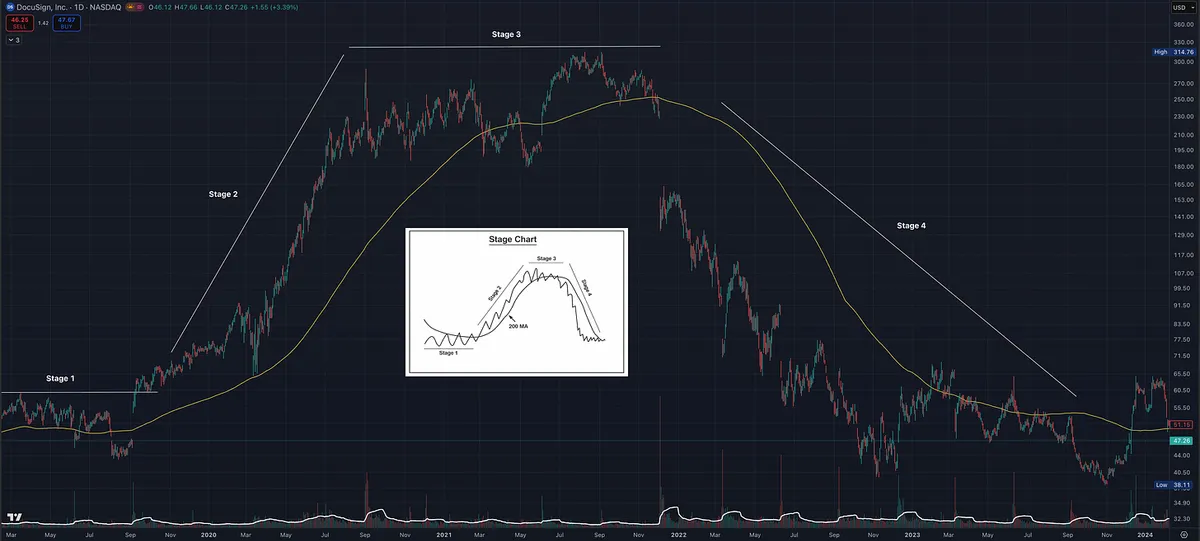
That’s Stage 1 transitioning into Stage 2.

But once you’re inside a strong Stage 2 uptrend…

You’ll typically see fewer deep cup and handles and more tight, constructive consolidations.

The market is no longer rebuilding.

It’s expanding.

Now you start seeing:

  • Flags and Pennants

  • VCPs

  • Flat bases

  • Tight area breakouts

These tend to be shorter, tighter, and shallower than early-stage bases.

These are not bottoming patterns, they are continuation patterns forming within strength.

If you’re still looking for deep bases in a strong uptrend, you’re going to feel like “nothing is setting up” when in reality, everything is.

You’re just looking for the wrong thing.

The pattern doesn’t matter as much as the quality of price action and trend strength behind it.

This is one of those simple nuances that separates amateurs from pros.

Great traders don’t just learn setups.

They learn when those setups show up.

Same bull market. Same charts. Different lens.

Completely different results.

View on Substack ↗

If You Can’t Name the Stage… You Shouldn’t Be in the Trade

Most traders overcomplicate the market.

More indicators. More opinions. More noise.

But the truth is, the market has been operating the same way for decades.

And Stan Weinstein gave us one of the cleanest frameworks to understand it in Secrets for Profiting in Bull and Bear Markets

“One glance is worth a thousand earnings reports.” -Stan Weinstein

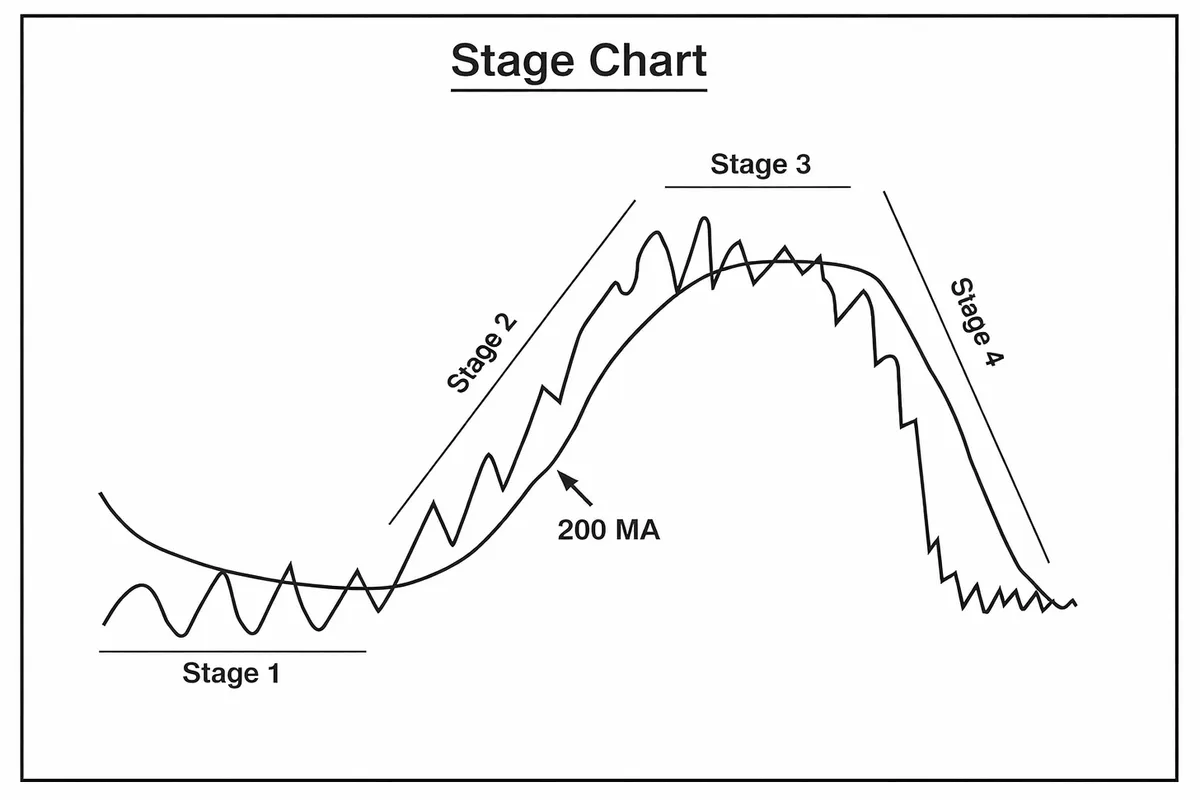
Stan Weinstein broke every stock into four stages.

Stage 1: Basing This is where a stock goes sideways. Quiet. Boring. Institutions are accumulating but price is not moving much yet.

Stage 2: Advancing This is the money phase. Price breaks out, trends higher, and demand is in control. This is where strong stocks separate from the rest. Higher highs, higher lows.

Stage 3: Topping Momentum slows. Volatility increases. The trend starts to stall as distribution begins under the surface.

Stage 4: Declining The downtrend. Lower highs, lower lows. Broken structure. This is where capital gets destroyed. Price is below the 200MA and the moving average starts declining.

Here’s the key.

You don’t need to trade all four stages.

You only need one.

Stage 2.

Weinstein made it clear that the goal is to align with strength, not anticipate it.

One of the simplest ways to identify a true Stage 2 uptrend:

Price is above key moving averages.

The 50 day is above the 150 day.

The 150 day is above the 200 day.

That alignment tells you institutions are in control and the trend is working.

This concept didn’t come out of nowhere.

Weinstein built on the work of Richard Schabacker, who studied price behavior as far back as the 1930s. The best traders don’t reinvent. They refine.

Mark Minervini took this same foundation and made it a core part of his process.

Same principle.

Different generations.

Nothing new.

If the stock is not clearly in Stage 2, you are forcing it.

And forced trades are where most losses live.

Name the stage first.

Then decide if it’s worth your attention and capital.

View on Substack ↗

Why Stage 2 Is the Only Time You Should Be Trading

Look at the market through one simple lens:

There are only four stages.

Stage 1.

Stage 2.

Stage 3.

Stage 4.

Most traders treat them all the same.

That is the mistake.

Stage 1 is where stocks go nowhere. Choppy. Sideways. No real progress.

You are not building wealth here. You are wasting time.

Stage 2 is where trends begin. Higher highs. Higher lows. Institutions stepping in.

This is where value is created. This is where money is made.

Stage 3 looks exciting. Big moves. Volatility. Headlines.

But underneath, distribution is happening.

Smart money is selling into strength.

You are not gaining an edge here. You are giving it back.

Stage 4 is where stocks break down. Lower highs. Lower lows. Weak closes.

This is where portfolios get destroyed. This is where value disappears.

So ask yourself:

Why trade in all four stages when only one actually pays you?

The best traders do less, not more.

They wait. They focus. They strike in Stage 2.

Because that is the only place you increase value without wasting time.

Everything else is noise.

Or worse.

A slow leak of your account.

View on Substack ↗

Why You Can’t Find VCPs Right Now (And Why That’s Not a Problem)

Received a great question today about VCPs that I think a lot of traders are struggling with right now.

They mentioned how hard it has been to actually find clean VCP setups, even after studying charts and screening for them.

This is a great question, and honestly what you’re experiencing is completely normal.

The first thing to understand is that most VCPs are not going to look like the textbook examples. The clean, perfectly staged contractions that many show are the exception, not the rule.

Minervini is not teaching you to find a perfect pattern. He is teaching you to recognize behavior.

What you are really looking for is:

  • volatility contraction over time

  • tighter price action

  • controlled pullbacks instead of sharp selloffs

  • volume drying up into the pivot

  • price tightening up the right side of the chart

Those things can show up in many different ways, and often they are subtle.

The second part of this is the environment.

Right now, it is harder to find clean setups. That is not a coincidence.

The best looking VCPs tend to show up earlier in a bull cycle when institutions are aggressively building positions and leadership is expanding. As the market matures, stocks become more extended, price action gets looser, and breakouts become less reliable.

So when you are scanning and thinking “these don’t look like the examples,” that is actually information.

It is telling you that either:

  • the setup is not truly there

  • or the environment is not ideal for it

A good way to think about it is this:

You are not trying to find a perfect VCP. You are trying to identify when supply is being absorbed before a potential expansion move.

Sometimes that will look very clean like NVDA earlier in 2024 or slightly less perfect like SMCI. Other times it will look much messier, like SNDK in 2025, and require more experience to recognize.

If you are struggling to find them right now, that might not be a skill issue. It is very likely a reflection of the current market conditions.

Over time, you will get better at spotting these. It comes from screen time and reviewing charts over and over. What looks unclear now will start to stand out much more with experience.

Also, you do not need to master every setup to be successful. Some traders naturally see certain patterns better than others.

For example, you might find that:

  • cup with handle setups stand out more to you

  • or flat base breakouts are easier to recognize

That is completely fine.

The goal is not to trade every setup. The goal is to find the ones you can consistently recognize and execute well, and focus on those.

View on Substack ↗

It Looks Extended… Then It Explodes

Most traders look for stocks breaking out of long bases. That’s not wrong.

Others chase extended names. That’s where they get trapped.

Some try to buy the dip… but end up catching a falling knife.

What many don’t realize is that some of the best opportunities come from stocks that already look extended.

The strongest names don’t pull back the way people expect.

They run up, pause, then run again.

Darvas wrote about this over 60 years ago. The best stocks move higher, tighten, and continue. This pattern repeats until the trend is over, and it usually lasts longer than most expect.

It pushes higher → tightens → then goes again.

Over and over.

That tight action near highs is where the opportunity is.

Not obvious. Not comfortable.

But repeatable and essential in strong Stage 2 uptrends.

This is the same structural behavior Darvas described, expressed on a shorter swing trading timeframe.

This is the Momentum Burst setup.

Add it to your trading toolkit.

Full breakdown here 👇

https://tradingmomentum.substack.com/p/the-momentum-burst-setup-how-to-capture

ArticleThe Momentum Burst Setup: How to Capture Explosive Moves Before They Happen
View on Substack ↗

Relative Strength Points You to the Leaders

Sometimes the easiest way to find a stock is to start with relative strength.

What is already outperforming everything else?

Focus on the top 1 to 2 percent of the market.

These are the names institutions are already accumulating.

I have found more leading stocks using this simple approach than any complex scan or strategy.

But here is where most traders go wrong.

Not every strong stock is immediately actionable.

Many times you will find great names that are extended or not properly set up.

That is fine.

Add them to your watchlist and be patient.

Once you identify the leaders, wait for them to set up again.

Strong stocks will often give you another opportunity after a pullback.

Look for higher lows.

Look for price tightening.

Look for price to find support at key moving averages.

Look for volume drying up as selling pressure disappears.

Look for price to move higher and volume expands.

This is how true market leaders behave in strong Stage 2 uptrends.

They make powerful, explosive moves, pause, then move higher again.

This cycle can repeat multiple times before the trend is finally exhausted.

We often make this process more complicated than it needs to be.

Find strength. Wait for a proper low risk, high reward setup. Then execute.

View on Substack ↗

Wide and Loose = Low Probability

Most Breakouts Fail for One Simple Reason

And almost nobody studies it.

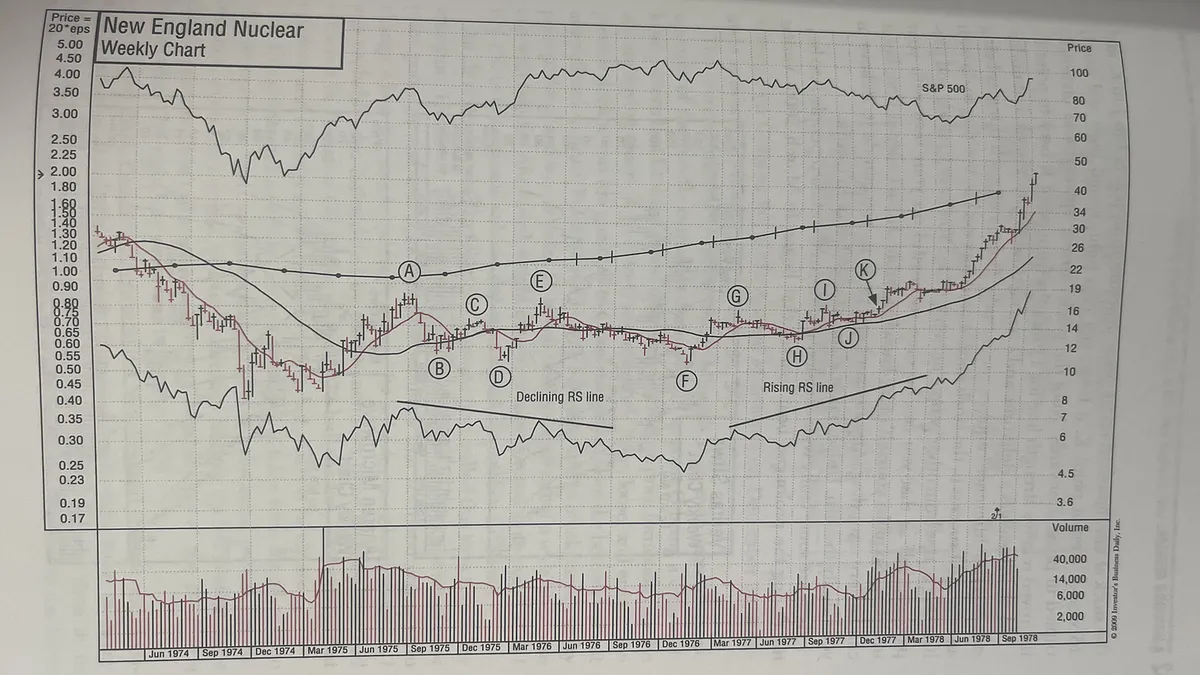
New England Nuclear looked ready three separate times.

Each time, it failed.

Not bad luck.

Not news.

Structure.

From A to E:

  • 40% correction

  • wide, erratic price swings

  • declining relative strength

This is what O’Neil called wide and loose.

And wide and loose patterns fail.

But here’s where traders get trapped:

It looks like a base.

It feels like it’s ready.

So they buy.

At E → breakout attempt → fails

At G → breakout attempt → fails again

At I → breakout attempt → fails again

Same mistake every time:

Buying before the stock proves itself.

Here’s what changed everything:

From I to K:

  • volatility dried up

  • price tightened

  • structure became orderly

  • relative strength turned up

Now demand is in control.

Now institutions are accumulating.

At K, it breaks out.

And nearly triples.

Same stock.

Different structure.

Different outcome.

The lesson most people miss:

  • Wide and loose = low probability

  • Tight and controlled = higher probability

  • Strength must prove itself over time

You don’t get paid for spotting setups early.

You get paid for waiting until they’re right.

View on Substack ↗

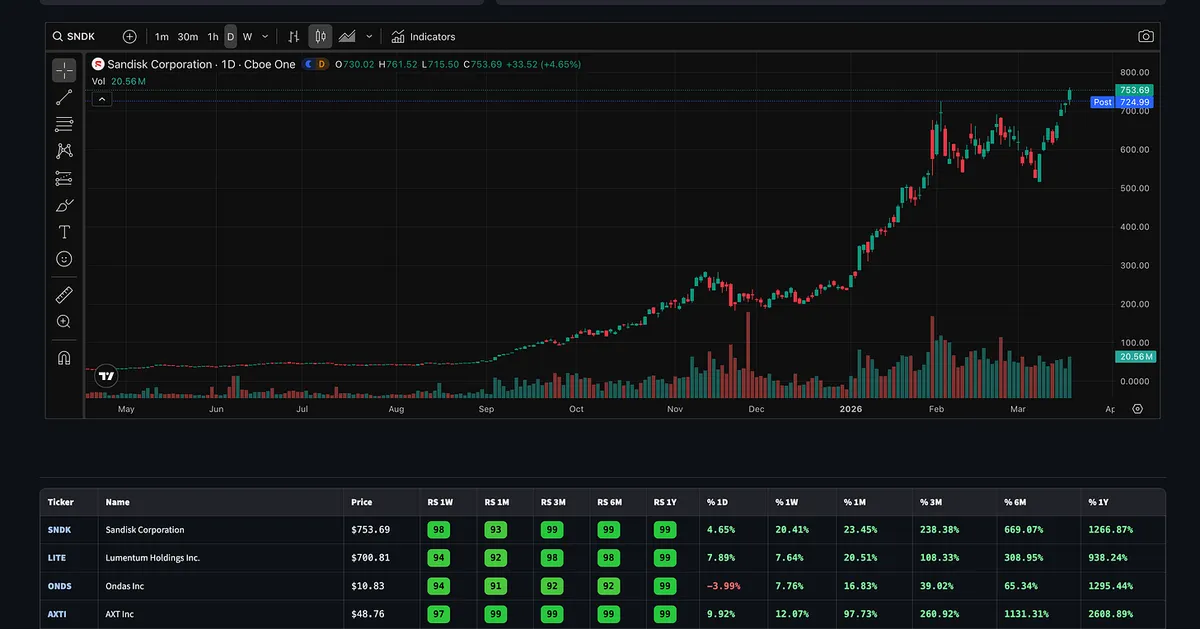
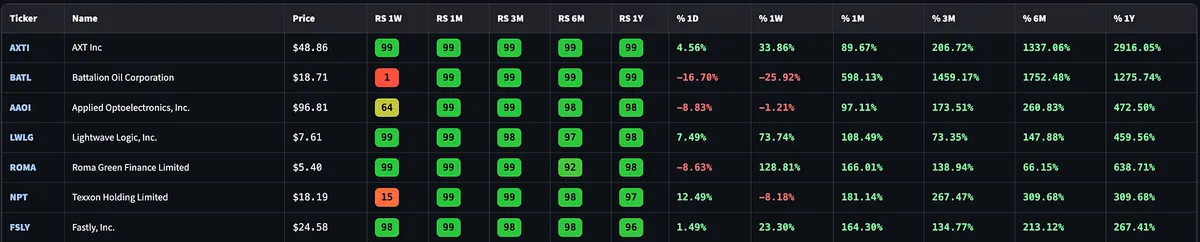
Sometimes the easiest way to find winning stocks is Relative Strength

One of the simplest things I do regularly is run a Relative Strength screener.

Not complicated.

Just looking for stocks that are outperforming the market across multiple timeframes.

When a stock shows up with RS near the top across the board, it’s usually telling you something important.

Institutions are accumulating it.

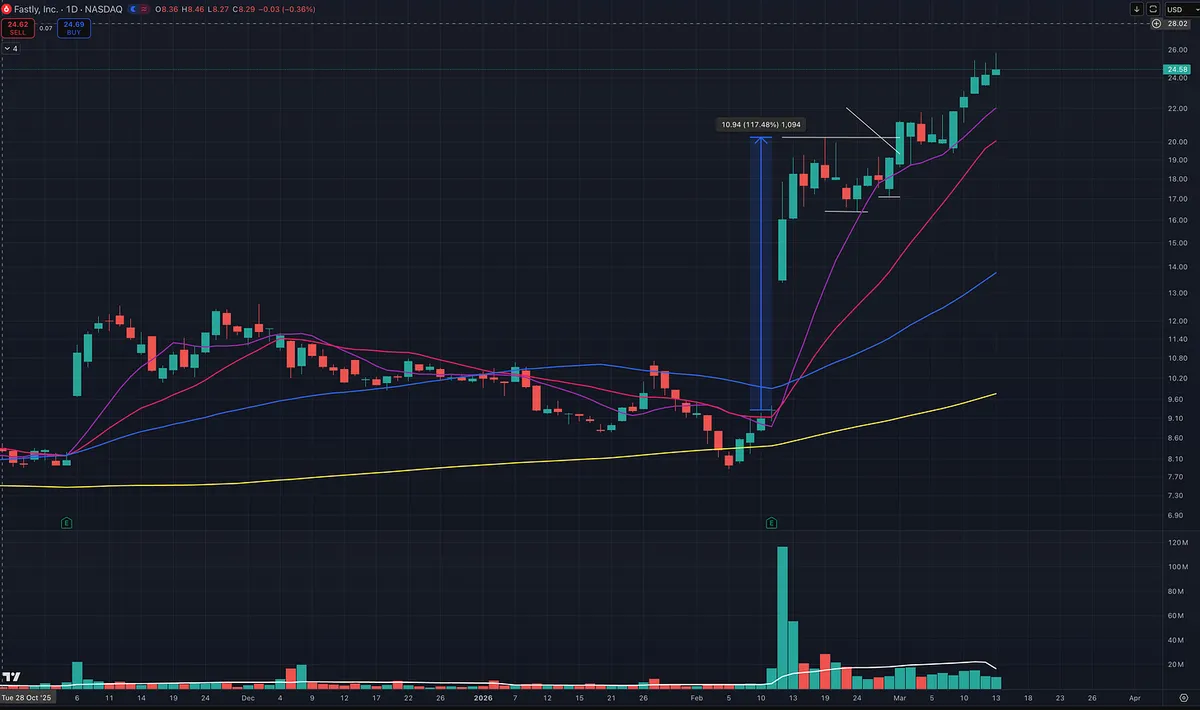
A recent example was FSLY.

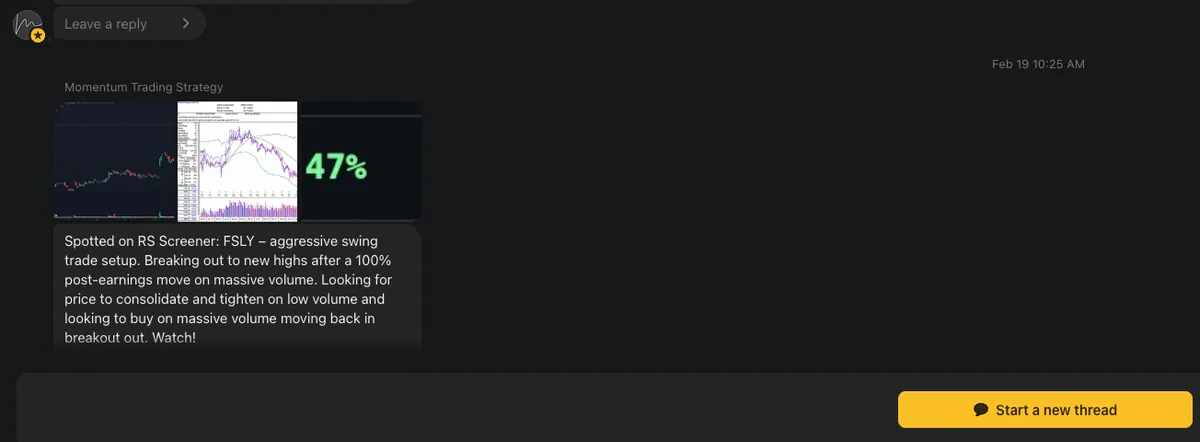
After a big earnings gap on heavy volume, it immediately showed up on the RS screener and went on watch.

When you see a move like that, the playbook is pretty simple.

Wait for the stock to tighten up and look for a continuation move.

That’s exactly what happened.

The stock consolidated after the earnings gap and found support at the 10-day moving average, which is often where strong momentum names defend during powerful trends.

From the time it was mentioned in the subscriber chat back in February, the stock has continued to show strength and is now up more than 35%.

This type of move is very similar to what traders like Kristjan Kullamägi call an Episodic Pivot.

A major catalyst hits. The stock gaps up on huge volume. Then strong relative strength keeps it near highs.

Often the next opportunity comes when the stock tightens up and continues higher.

You don’t need complex indicators or screens.

Many times the big winners are simply the stocks already showing the most strength.

That’s exactly what Relative Strength helps you find.

View on Substack ↗

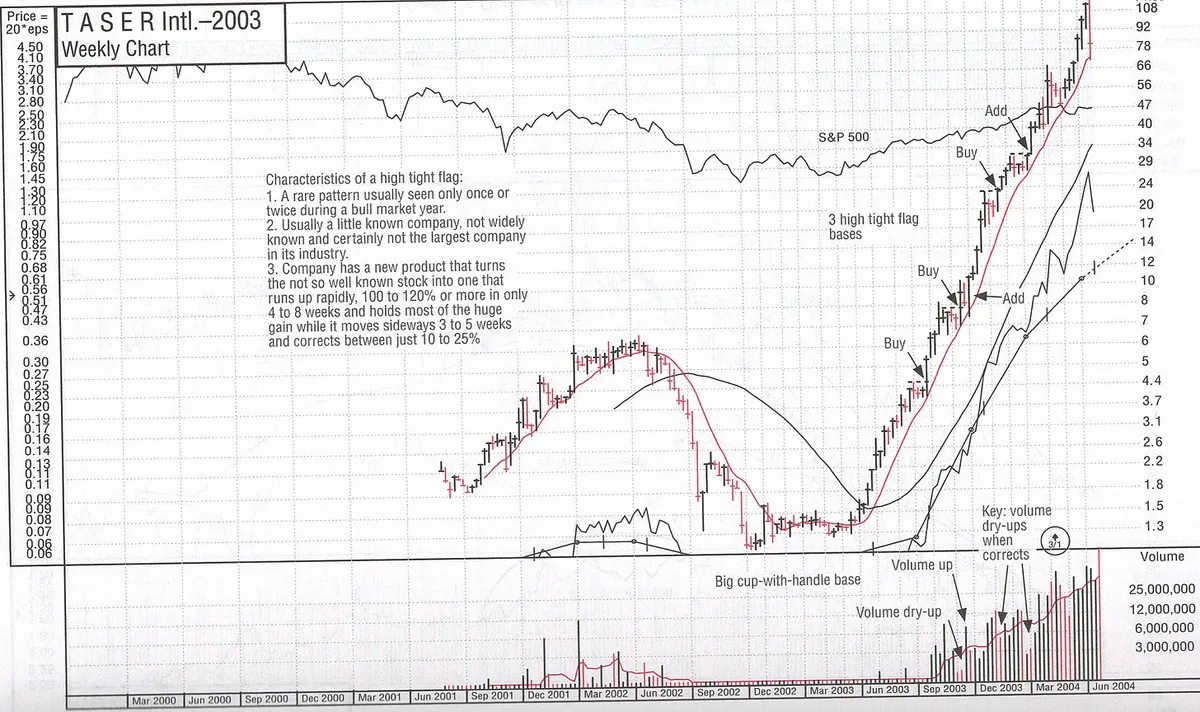
The High Tight Flag: A Rare Pattern from O’Neil That Minervini Calls the Power Play

One of the most explosive setups in growth stock trading is the High Tight Flag.

This pattern was originally described by William O’Neil in How to Make Money in Stocks and is also studied by traders like Mark Minervini, who emphasizes similar explosive momentum patterns in his work.

O’Neil pointed out that the High Tight Flag is extremely rare, appearing in only a handful of stocks during an entire bull market.

But when it appears and works correctly, the results can be extraordinary.

What Defines a High Tight Flag

The pattern begins with a massive price advance.

The stock typically rises about 100% to 120% within 4 to 8 weeks.

That type of move signals powerful institutional demand entering the stock.

After that explosive run, the stock does not collapse.

Instead, it moves sideways in a tight range, usually correcting only about 10% to 25%.

This consolidation typically lasts about 3 to 5 weeks.

That tight sideways action forms the “flag” portion of the pattern.

Why the Pattern Is Powerful

The High Tight Flag works because it reveals something unusual.

A stock that can double in a very short period of time and then refuse to give back those gains is showing that demand is overwhelming supply.

Institutions are often accumulating shares during the tight consolidation.

When the stock eventually breaks out of that sideways range, it can lead to another powerful advance.

O’Neil noted that some stocks have gone on to rise 200% or more after forming this pattern.

Why It’s Often Misinterpreted

Many traders believe they see High Tight Flags everywhere, but true High Tight Flags are very rare.

The move must be extremely fast. The consolidation must remain relatively tight and the pattern usually forms over a short time frame.

If the pullback is too deep or the consolidation drifts sideways for too long, it usually isn’t the real thing.

That rarity is exactly what makes the pattern so valuable.

When a true High Tight Flag appears, it often signals a powerful new market leader early in a major move.

View on Substack ↗

The Simple Screener That Finds Momentum Breakout Stocks

One of the biggest questions traders ask is:

“How do you actually find these breakout stocks before they move?”

The answer is simpler than most people think.

You start by narrowing the market down to the strongest stocks already showing leadership.

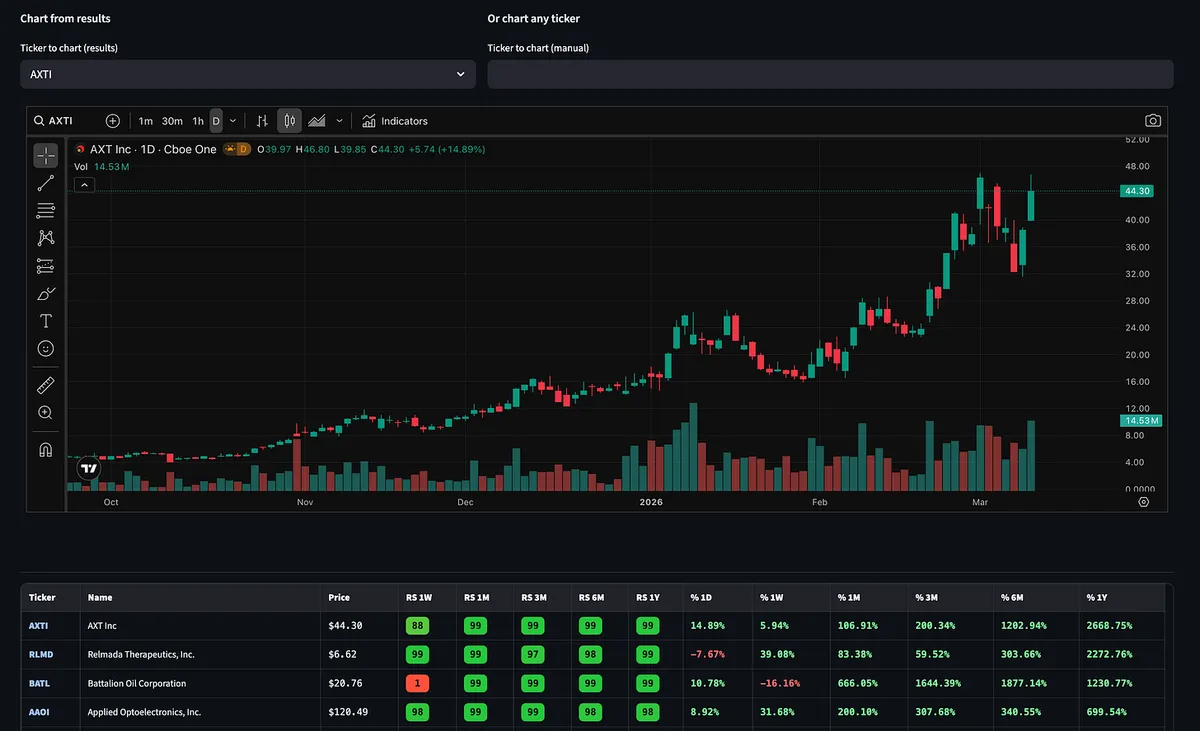
One of the fastest ways to do that is by using a Relative Strength Stock Screener.

This is the same basic idea used by momentum traders like Kristjan Kullamägi when searching for breakout setups.

The Simple Process

Use a relative strength screener and sort stocks by performance.

Move the rank by timeframe to 1 or 3 months, then set the filter to 98 or higher.

That shows you the top performing ~2% of stocks in the market.

Those are the names you want to study.

Why This Works

Because the biggest winners tend to behave in a very specific way.

As Kristjan explains:

“If you study thousands of the biggest winning stocks over the past 100 years they tend to move in stair steps. Meaning they will make a 20–50%+ move, pull back and go sideways for a while, then make another move.”

That stair-step behavior is where momentum traders find their edge.

A stock makes a strong move. Then it pulls back and consolidates. Then it breaks out again.

Those consolidations are where many of the best breakout setups form.

The key is focusing on stocks that are already proving themselves as leaders.

That’s why scanning for the top 1–2% performers is so powerful.

What to Look For Next

Once you identify leaders, start watching for technical setups such as:

• Tight consolidations

• Volatility contractions

• High tight flags or pennants

• Higher highs and higher lows

• Flat base breakouts

Other patterns that often appear in strong leaders:

• Ascending triangles

• Darvas boxes

• Wedges

• Parabolic curves

And always watch the volume behavior:

• Volume drying up during pullbacks or consolidations

• Heavy volume expansion on breakouts

This is one of the easiest ways to build a watchlist of potential momentum leaders before they make their next move.

In fact, this exact process is how I spotted LITE before it went on to move over 100%.

For Paid Subscribers

For those inside the paid subscription, you already have access to the Relative Strength Screener tool that automatically filters for these types of stocks.

It’s one of the simplest ways to quickly narrow thousands of stocks down to a handful of high-probability breakout candidates, the same type of setups momentum traders like Qullamaggie focus on.

If you're more CANSLIM / position trader focused, you can slightly loosen the relative strength filter and add Sales and Earnings growth to your screen.

Another option is to use the Super Performer preset in the screener, which combines several of those fundamental growth filters.

You’ll find the screener inside the Momentum Trading Strategy section for paid subscribers.