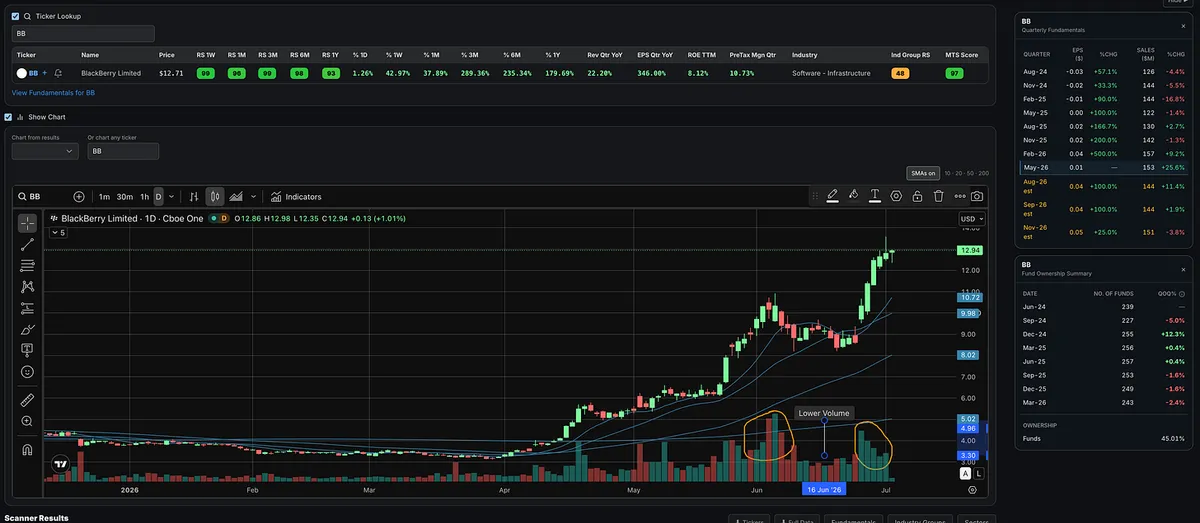
BB is showing the price and volume characteristics I like to see.
Big volume on the upside, followed by lower volume on the pullbacks.
That tells me demand is showing up on strength, while selling pressure has been relatively muted during weakness.
Notes
When and where to buy a stock you have already found: chart patterns, buy points and entry tactics.
Showing 81–100 of 185 notes
BB is showing the price and volume characteristics I like to see.
Big volume on the upside, followed by lower volume on the pullbacks.
That tells me demand is showing up on strength, while selling pressure has been relatively muted during weakness.
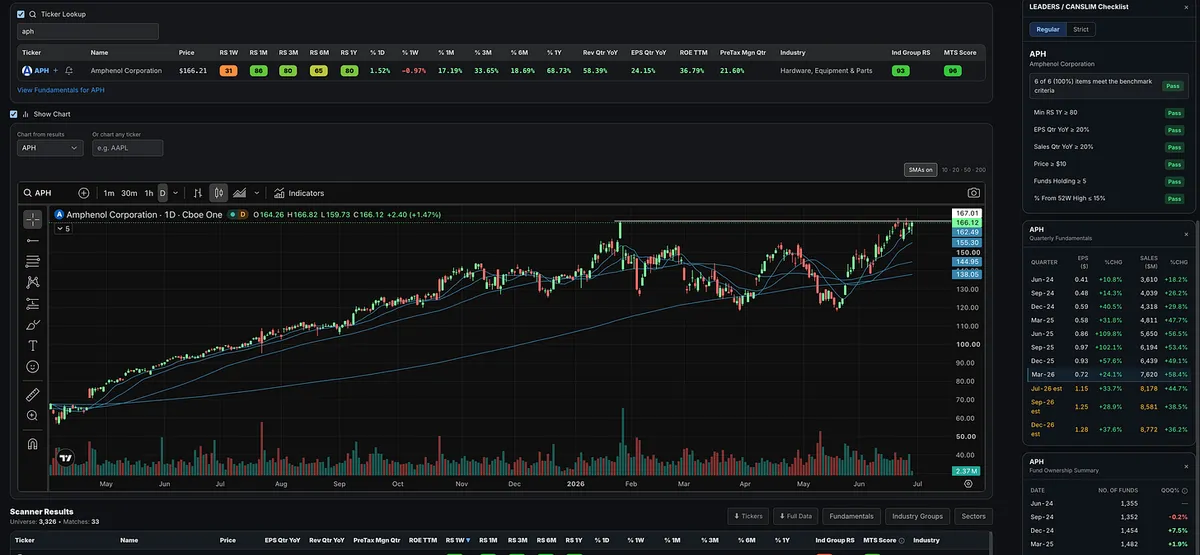
Is APH Setting Up for Another Run?
Amphenol (APH) has already been a big winner.
It was strong in 2023, followed through in 2024, and continued higher through 2025. Since setting its high in early 2026, the stock has been consolidating and forming what looks similar to a double-bottom type structure.
The fundamentals are still strong.
Earnings growth had started to decelerate, but sales have remained consistently strong. Now estimates suggest EPS growth could begin picking back up while sales strength continues.
APH currently has an RS Rating of 80, which meets the O’Neil leadership threshold. Sales growth is running near 58%, EPS growth is around 24%, ROE is 36%, and pre-tax margins are near 21%. It is also part of the Hardware, Equipment & Parts group, which has been a leading industry group.
Technically, APH is approaching new highs again after rejecting near all-time highs in late June, pulling back to the 10-day line, and now moving back up. That pullback created a higher-low shelf, giving traders a logical area to define risk.
The breakout level is around $167.
A breakout through that area on volume would be ideal. With a stop around $155.50, the setup offers a defined risk area and a potentially attractive risk/reward if buyers step in.
APH may not be the flashiest growth stock in the market, but it has the combination that matters: a long-term winning trend, strong sales, good earnings, high-quality margins, relative strength, and a technical setup near highs.
Risk/Reward Changes With Every Candle. Most Traders Realize It Too Late.
As a growth stock trader and momentum trader, I am not trying to guess the bottom.
I am also not trying to pick the top.
I wait for the market to confirm.
Then I do the same thing with individual stocks.
This is something I talk about in Module 6 of the Momentum Trading Strategy Course in the risk management section.
Risk-reward is not static.
It changes as a stock moves.
After a long consolidation, correction, or deep pullback, the first few days off the lows are always hard to trust.
You do not know if it is real yet.
It could just be another failed rally.
It could just be another bounce before the next leg lower.
But once the market gives a real green light, that is where your focus should shift.
A follow-through day.
Price reclaiming key moving averages.
Leading stocks setting up.
Stocks breaking out to new highs.
William O’Neil talked about this idea repeatedly. The goal is not to predict the market. The goal is to understand what the market has actually done and what it is doing now.
He also wrote that investors should buy stocks as they emerge from properly formed bases and begin making new highs in price.
Mark Minervini described a similar moment in Trade Like a Stock Market Wizard.
When a leading stock moved into new high ground as the general market rallied off its lows, he wrote:
“This was the green light to buy.”
You are not trying to be a hero at the bottom.
You are trying to recognize when the evidence has changed.
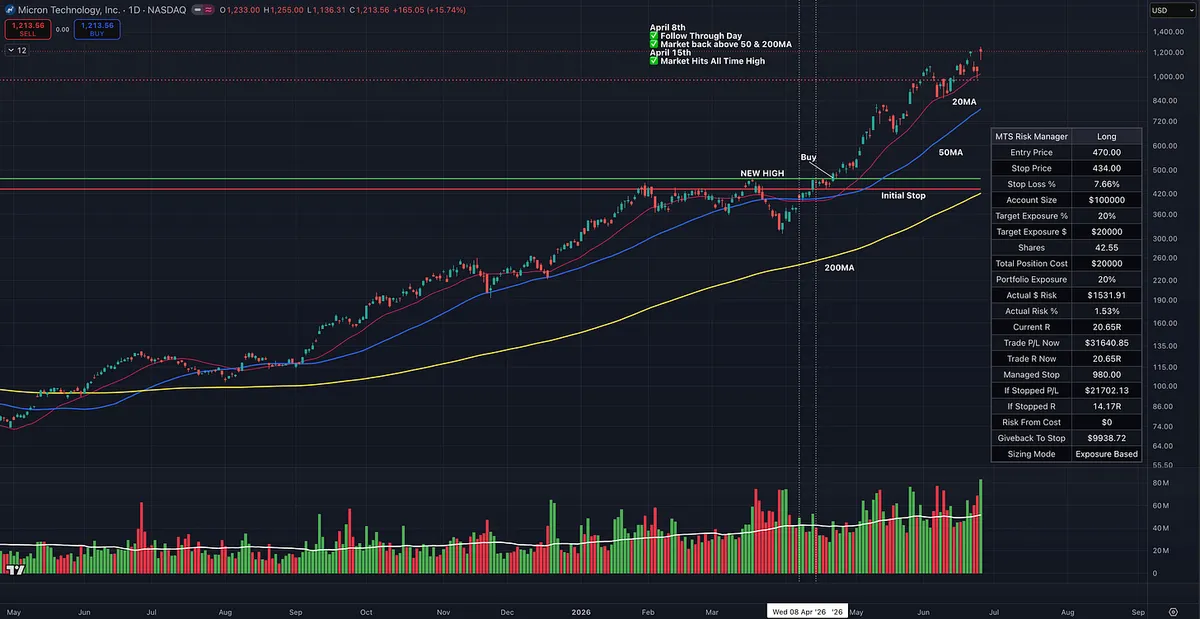
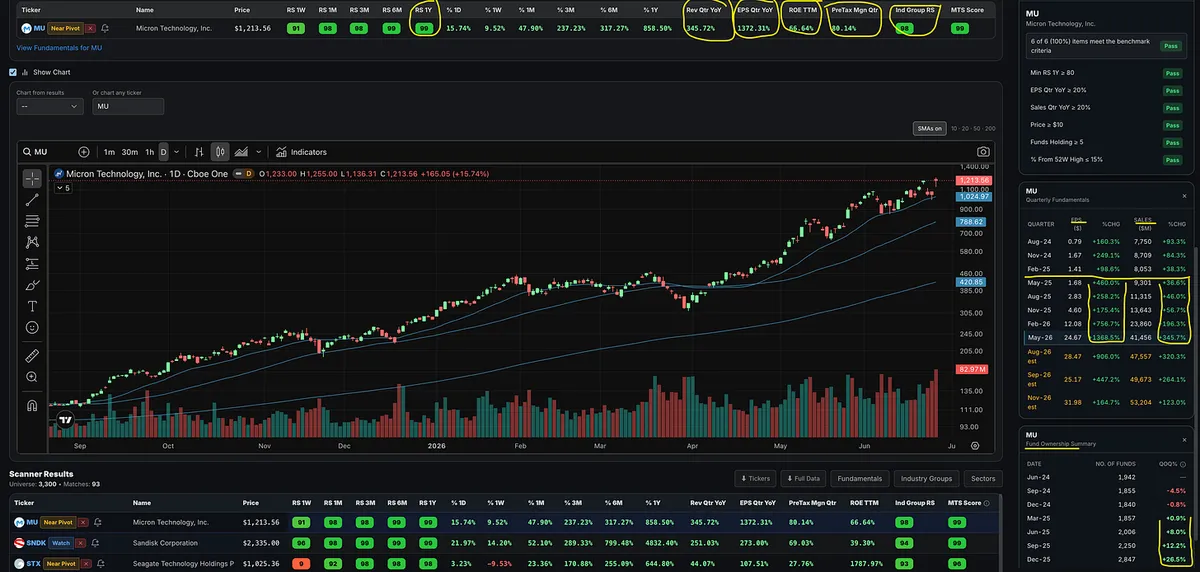
Now look at MU.
This was not some random stock waking up.
This name has been showing the characteristics of a leader for months.
Strong relative strength.
A hot industry group.
Explosive earnings.
Explosive sales.
Strong margins.
Strong institutional sponsorship.
Price above key moving averages.
A cup-with-handle type setup.
A breakout to new highs on strong volume.
Back in April, during this breakout, the risk-reward was much better.
The multi-month consolidation gave the market and MU the time it needed to reset, shake out weak holders, and build the structure for its next leg higher.
Then, after briefly breaking below the 200-day moving average and washing out many traders, the stock reclaimed key levels, tightened up, and broke out to new highs.
That kind of action can fuel a move that goes much higher and lasts much longer than most people expect.
Now the stock is up roughly 20R from the initial risk.
Could you have made money buying it later?
Sure.
But that is not the point.
The point is that the risk-reward relationship changed.
The market can still go much higher from here.
Or it may not.
Nobody has a crystal ball.
But what we can know is when the market gives us a green light, when leading stocks are setting up, and when the risk can be defined before the move becomes obvious to everyone else.
This is why experienced traders get excited after long consolidations and deep corrections.
Not because the damage is fun.
Because corrections reset the playing field.
When conditions improve and leaders begin breaking out, the risk-reward is usually far better than it is months later after everyone finally feels comfortable.
By the time the trade looks obvious, the best risk-reward is usually already behind you.
Most Traders Only Notice the Breakout After It Is Too Late
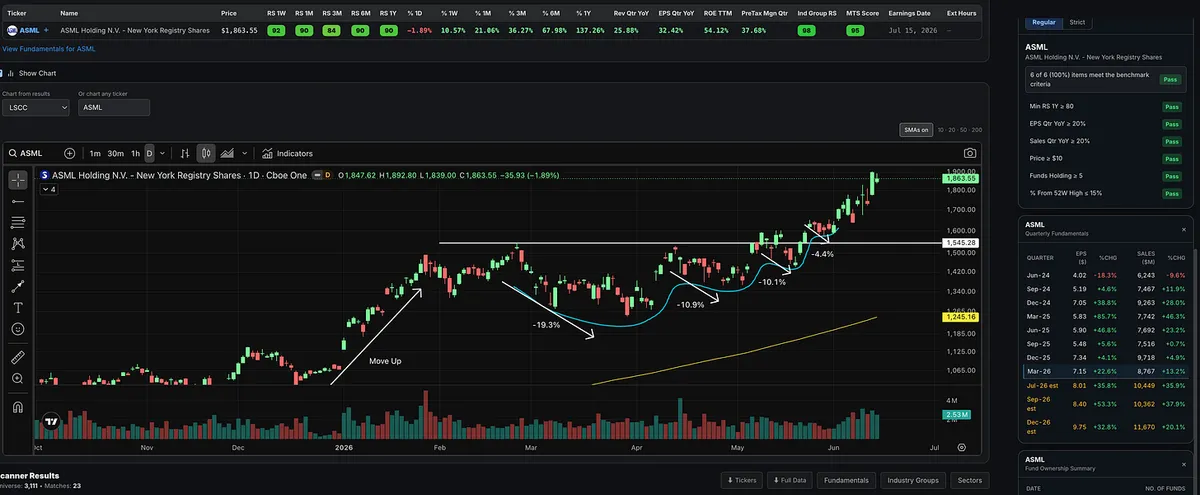
ASML is a good example of why price action matters.
Before the breakout, the stock built what looks like a Minervini-style VCP.
The contractions were roughly:
-19.3%
-10.9%
-10.1%
-4.4%
That is volatility contraction.
Not perfect, but it clearly showed the characteristics of tightening up the right side of the chart.
The stock held near the upper part of the base, tightened up, and then broke through the pivot area around $1,545.
Volume dried up on the final contraction, and demand started coming back in as price moved higher.
The breakout volume was not massive, so it was not textbook perfect, but the bigger point is that supply was drying up before the move.
That is the kind of setup growth traders should train their eyes to find.
Tighter price action.
Smaller pullbacks.
A setup that allows for tight risk and the potential to make multiples of what you risk.
“I consider trend following to be a subset of charting. Charting is a little like surfing. You don’t have to know a lot about the physics of tides, resonance, and fluid dynamics in order to catch a good wave. You just have to be able to sense when it’s happening and then have the drive to act at the right time.” -Ed Seykota
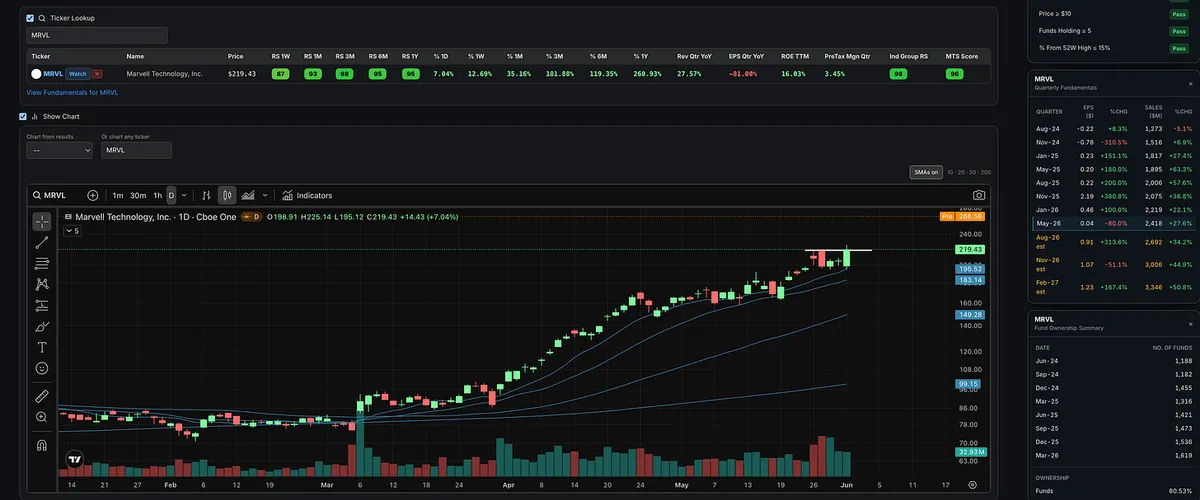
MRVL Big Gap Up.
If you bought the pullback to the 10-day moving average or entered as it broke out to new highs, you are feeling pretty good this morning.
This is why we track leaders and look for proper entries.
These types of entries are discussed in Module 5 of the Momentum Trading Strategy Course, which is free for paid subscribers.
Eventually This Pullback Will Fail
And that's perfectly okay.
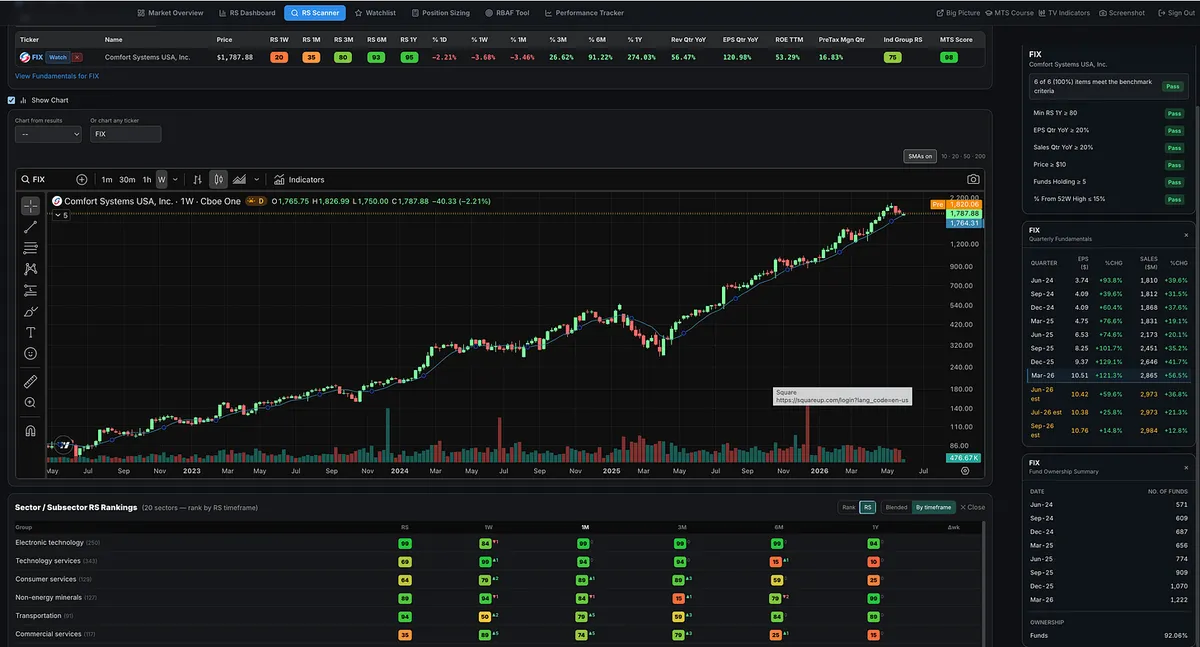
FIX is pulling back toward the 10-week moving average again. I been talking about this name for years and since I first started sharing names with subscribers.
One day, a pullback like this won't work.
One day, I'll buy a leader on a pullback, and it will fail.
I'll take a loss.
That's not a flaw in the strategy.
That's the cost of doing business.
Many new traders make the mistake of thinking they need to know exactly when a stock's run is over.
You don't.
Nobody does.
The goal isn't to predict the end.
The goal is to participate in the trend while it lasts.
Great leaders can keep working much longer than most people think is possible.
So we continue buying proper pullbacks and setups until the stock proves the trend is over.
Sometimes we'll be wrong.
We'll take a small loss and move on.
But if you've been participating throughout the trend, one small loss at the end doesn't erase the gains made along the way.
That's how this works.
We don't need to know when the run will end.
We just need to be willing to participate until it does.
Does It Bounce… or Splat?
Mark Minervini has a simple way of evaluating pullbacks:
Does the stock come bouncing back like a tennis ball?
Or does it go splat like an egg?
That visual is powerful because strong stocks usually act differently after pressure.
After a strong move up, the best stocks often:
• Pull back in an orderly way
• Hold key support
• Tighten up
• Shake out weak holders
• Then rebound with power
Like a tennis ball pushed underwater and released.
Weak stocks do the opposite.
They break support.
They get loose.
They fail to recover.
They go splat.
The pullback tells you a lot.
The rebound tells you even more.
When a stock is under pressure, pay close attention.
Does demand show back up?
Does it reclaim key levels?
Does it tighten and build power?
Or does it fall apart?
The reaction tells you everything.
The IPO Trap Most Traders Fall For
A lot of people are getting excited about a potential SpaceX IPO.
And I get it.
Big company. Big story. Big hype. Lots of emotion.
But this is where a lot of inexperienced investors get caught.
They buy on day one with no game plan.
No entry strategy.
No risk plan.
No understanding of how IPOs usually trade after the excitement fades.
Could a stock launch and just keep running higher?
Of course.
Anything can happen.
But if you study enough big IPOs, you will see the same thing over and over again.
Many sell off shortly after launch.
Some run for a few days or a few weeks, then roll over.
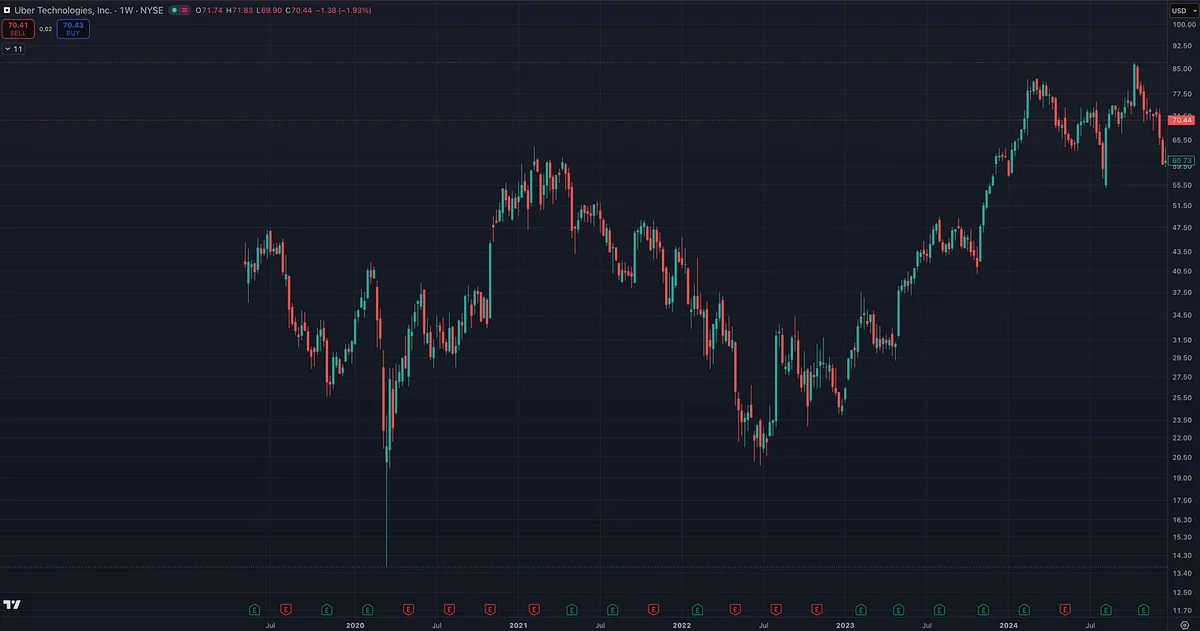
Some drop 40%, 50%, 60% or more before they ever build a real base.
That does not mean the company is bad.
That does not mean the stock can’t become a huge winner later.
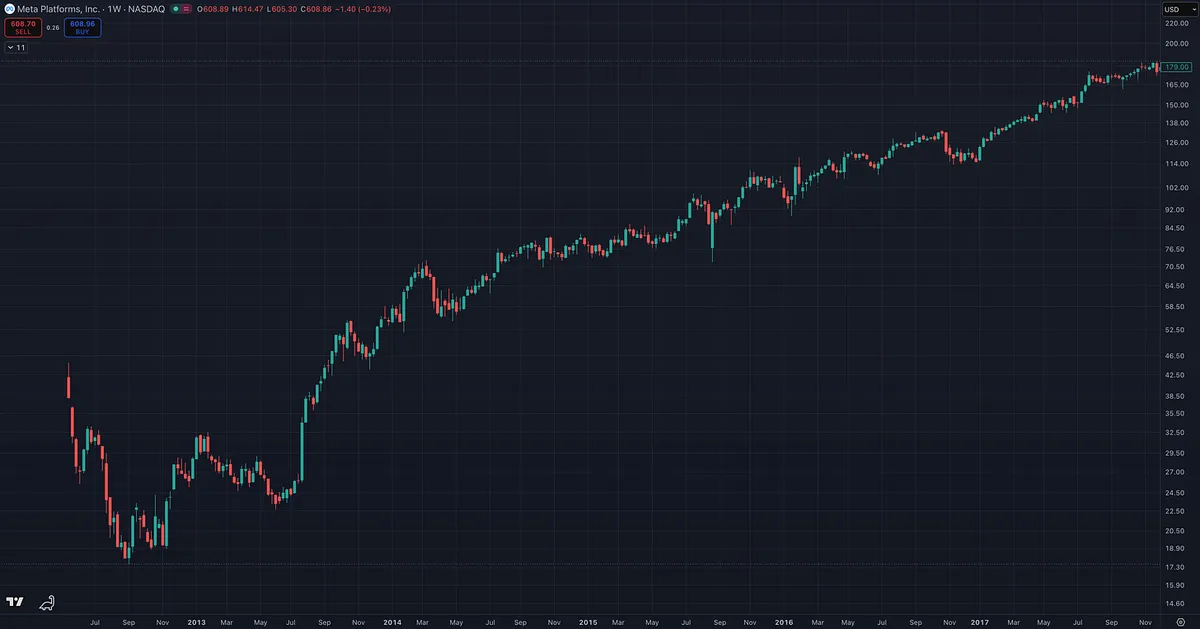
META is a great example. After its IPO, it dropped roughly 60% before eventually recovering, building, and going on a massive run.
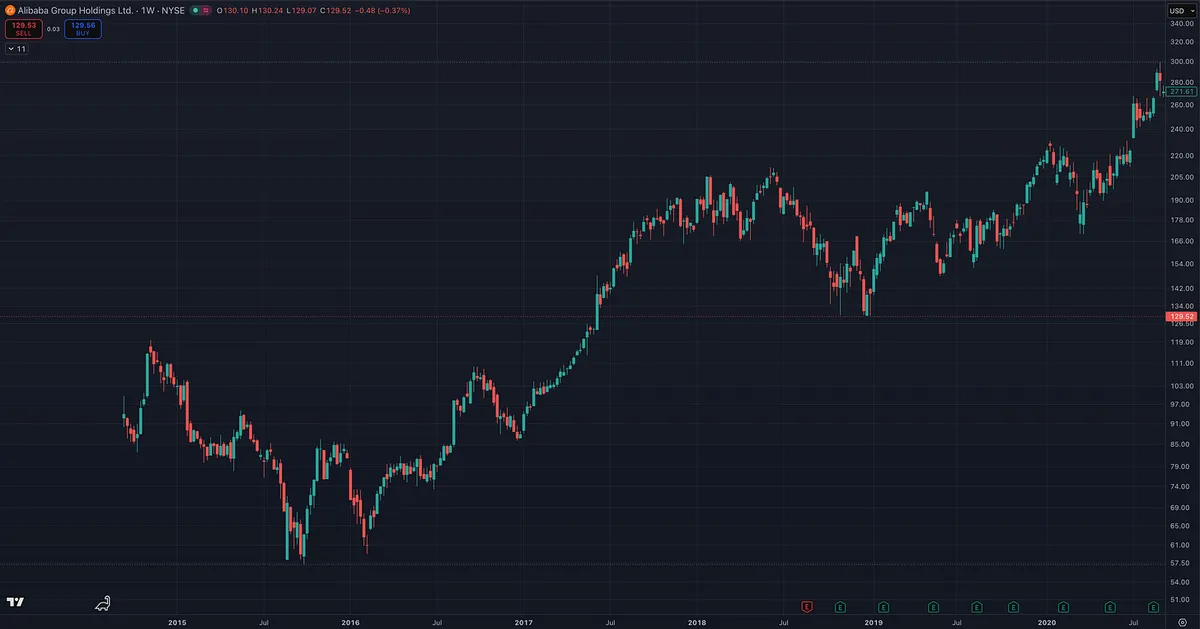
BABA also had an exciting debut, rallied for a few weeks, then eventually dropped more than 50% before later setting up again.
The point is not “never buy IPOs.”
The point is this:
Do not let the story make you abandon the process.
One of the easiest ways the market suckers people in is through big, exciting IPOs.
A great company does not always make a great investment at any price.
And a great company definitely does not mean day one is automatically the right time to buy.
People feel like they have to get in immediately or they will miss it forever.
That is usually not a strategy.
That is FOMO.
Many times, traders would be better off letting the excitement cool, waiting for the first major pullback, watching price digest, and then looking for a real base or proper setup.
Often, the best time to buy is not day one.
It may be 6, 12, or even 18 months later.
So this is just a reminder:
Have a plan.
Know your risk.
And be aware of your emotions.
The market loves to use hype and FOMO against inexperienced investors.
Fundamentals Build the Thesis. Price Tells You What to Do.
Institutional researcher Milton Berg worked with George Soros and Stanley Druckenmiller.
One thing he has said that I think more traders should pay attention to is that Soros and Druckenmiller may not talk about this much publicly, but they enter and exit positions based on technicals, with fundamentals as the backdrop.
That is not much different from what William O’Neil, Mark Minervini, and many growth stock investors do.
We want the fundamentals.
Big earnings. Big sales. Strong return on equity. Strong margins. Something new. A hot industry group. A stock aligned with the current bull market theme.
But we do NOT enter and exit based on the story alone.
We enter and exit based on what the chart is telling us.
The fundamentals help build the thesis.
The technicals help tell us when institutions are accumulating, when demand is showing up, how risk can be defined, and when the evidence is starting to change.
Soros and Druckenmiller may have looked at different types of fundamentals than a CAN SLIM growth investor, but the principle is very similar:
Use fundamentals to understand the opportunity.
Use price action to manage the trade.
The Volume Clue Most Traders Miss Before a Stock Explodes
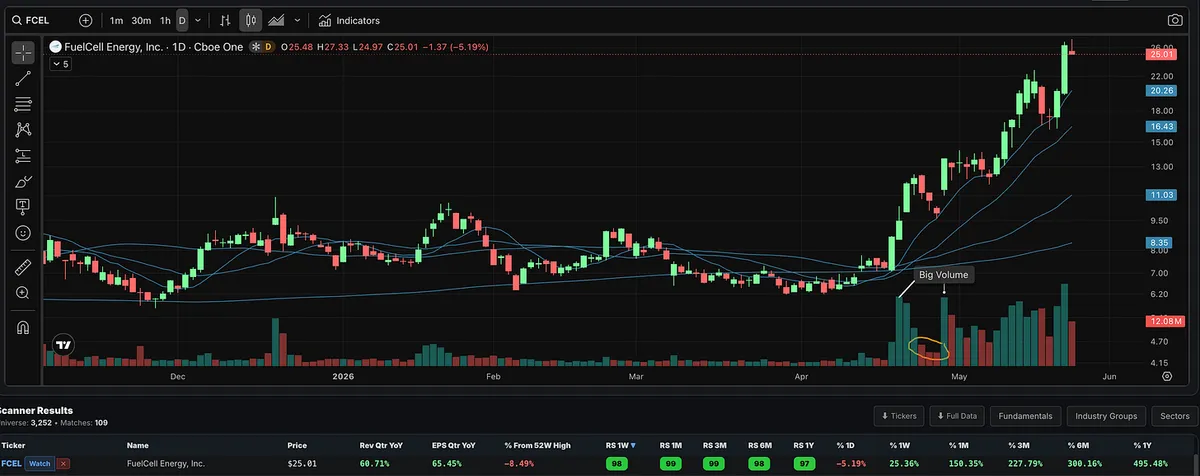
FCEL recently gave a great example of the type of price-volume action I like to look for.
I get a lot of questions on this, so I thought I would share a simple example.
First, you had several strong up days on volume that was roughly 2x, 3x, and even 4x above normal.
That tells you demand was coming in.
But the more important clue came after the move.
The stock pulled back for a few days into the 10-day moving average, but it did it on much lighter volume.
Price was pulling back, but sellers were not showing up aggressively. Volume was drying up as the stock rested.
Then, when price started moving higher again, volume expanded sharply. It was more than 3x the volume we saw during the pullback.
That is the type of action O’Neil and Minervini both teach traders to recognize:
Strong advance on heavy volume.
Controlled pullback on lighter volume.
Renewed move higher with demand coming back in.
Of course, this alone does not make a stock a buy. You still need the market, fundamentals, relative strength, industry group strength, setup quality, and risk/reward to line up.
But as a pure price-volume lesson, this is a clean example.
The big clue was not just that volume came in.
The clue was that volume disappeared on the pullback, then came back when price started moving higher again.
Why I Track Big Gap-Ups Inside the RS Screener
Someone asked me why I track episodic pivots and big gap-ups inside the Relative Strength Stock Screener.
Here’s why.
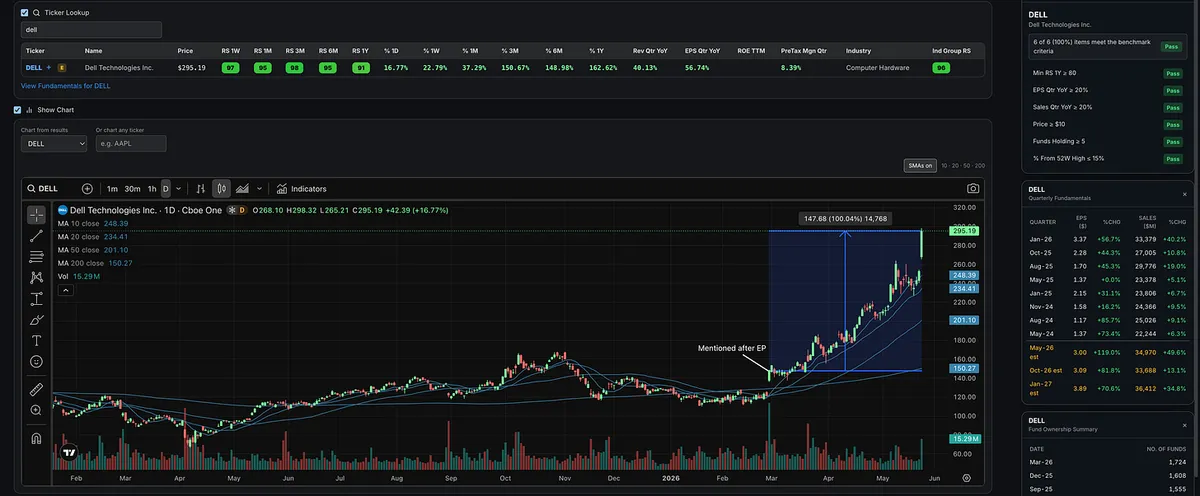
I wrote about Dell on March 1st after its episodic pivot, when the stock gapped up more than 10% on earnings with massive volume.
Since then, Dell has continued to trend higher, up roughly 100%, while making higher highs and higher lows.
Strong industry group. High relative strength across multiple time frames. Strong earnings. Strong sales. Massive volume after earnings.
That is exactly the kind of behavior I want to track.
Not because every gap-up works.
Not because you blindly chase every stock that moves.
But because big institutional-quality moves often leave footprints before the bigger trend fully develops.
The Relative Strength stock screener inside the Momentum Trading Strategy app is simple, but extremely powerful.
It helps me find the names that are showing up in the right places, at the right time, with the right characteristics.
This is exactly what I’m using to find the stocks I share.
“Most investors think that charts are hocus-pocus. Only about 5 to 10 percent of investors understand charts. Even a lot of professionals are totally ignorant about charts. Just as a doctor would be foolish not to use X-rays and EKGs, investors would be foolish not to use charts.” -William O’Neil
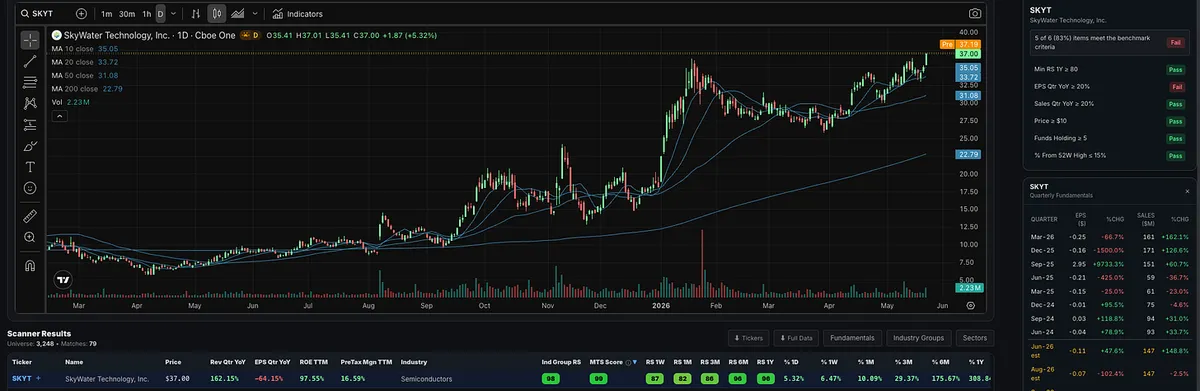
SKYT is not a perfect name, but the VCP action made me take a deeper look.
The earnings are not great. Last quarter was still negative, although it did improve from the prior quarter, and estimates look better going forward.
Fund ownership also dropped almost 50% last quarter, which is not something I ignore.
But price is still king.
And when SKYT showed up on my scanner, the technical action stood out.
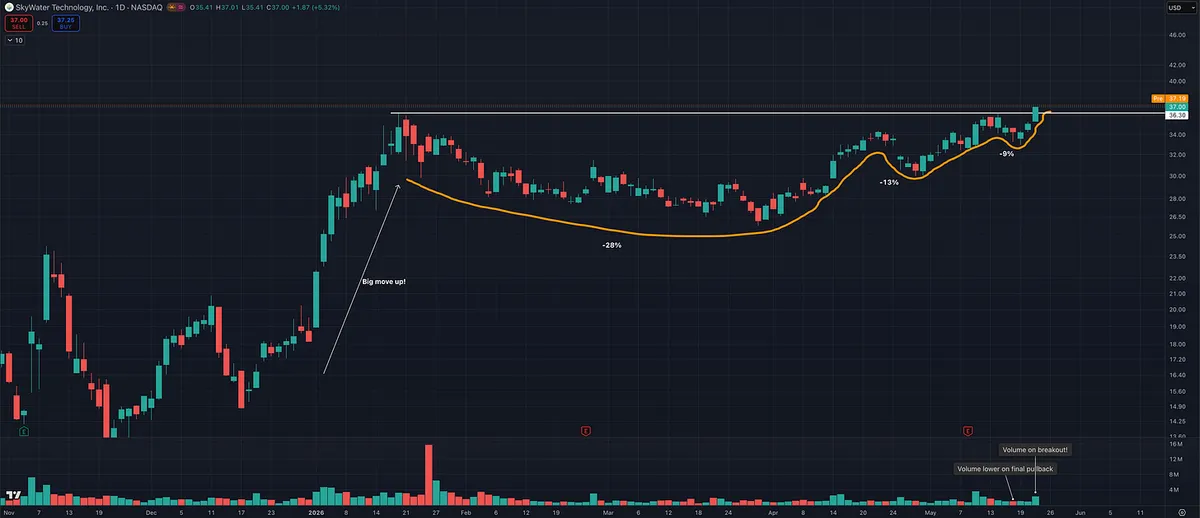
After a huge move of well over 100%, the stock started tightening up near its highs:
28% pullback.
13% pullback.
9% pullback.
That is classic volatility contraction.
The final pullback came on lower volume, then volume came back in on the breakout to all-time highs.
That is exactly what you want to see.
Again, this is not a perfect name.
But it has strong ROE, decent margins, strong sales growth, exposure to a strong semiconductor group, and strong relative strength.
This is why I don’t look at one data point in isolation.
Price is still the final judge.
The best setups are rarely perfect.
Would I prioritize a name with better earnings and stronger fund ownership?
Absolutely.
But I also don’t ignore setups with strong price action, tight volatility contraction, and volume coming in at the right time.
“Nothing to Buy?” MU Was Hiding in Plain Sight
I keep hearing the same thing since the follow-through day on April 8th and the move back above the 50-day and 200-day moving averages:
“There’s nothing to buy. Everything is extended.”
I don’t think that’s true.
The issue usually isn’t that there are no stocks setting up. The issue is that most traders are not prepared before the setups happen.
If you had a proper watchlist built, many of the names breaking out right now have been showing leadership for a long time. Yes, some moved before the market gave us confirmation to start getting involved again. That happens. But some broke out after.
MU is a great example.
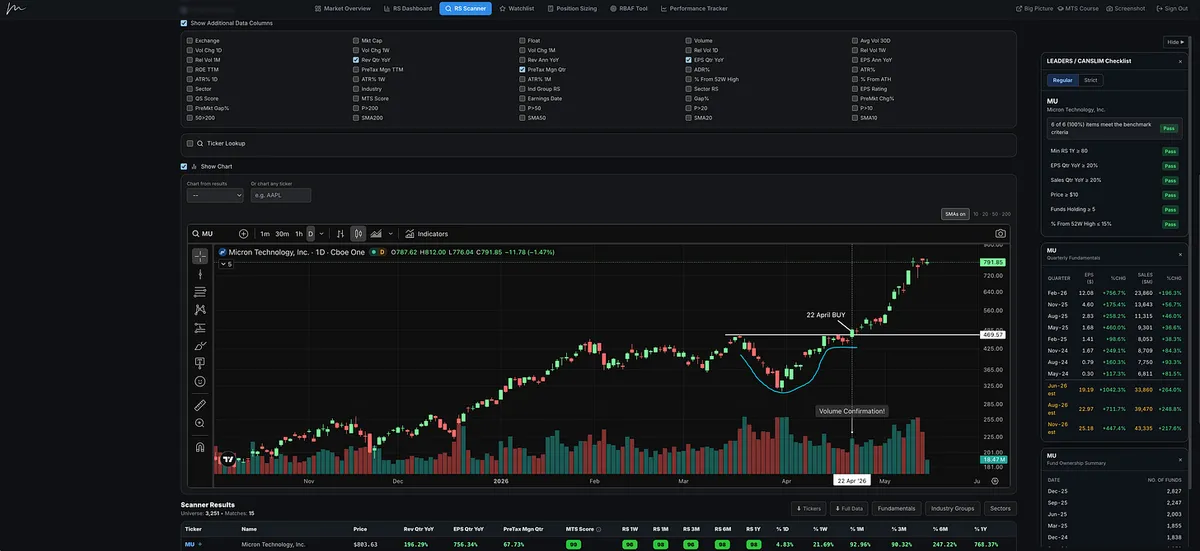
Micron had a beautiful cup-with-handle setup and broke out on April 22nd, roughly 10 to 11 days after the market gave us the signal to start getting back involved.
And this wasn’t some random laggard.
MU had strong relative strength, a hot industry group, big earnings growth, strong sales growth, powerful forward estimates, and a chart that was setting up.
This is exactly why I built the Relative Strength Stock Screener.
The goal is simple: narrow your watchlist down to the strongest leadership names before the move happens, so you don’t miss these types of setups.
Also, try using the MTS Score.
That is our proprietary leadership rating that looks at relative strength, earnings, sales, pre-tax margins, ROE, industry group relative strength, and proximity to 52-week highs.
It is designed to help you quickly separate true leadership from average names.
There have been plenty of stocks.
You just need to know where to look.
Not All Swing Traders Are on the Same Time Frame
Two traders can both call themselves swing traders and still be playing completely different games.
Two traders can both call themselves position traders and still be managing completely different time frames.
That is one concept I forget many beginner and even intermediate traders have not fully learned yet.
Most people understand the basic labels.
Day trading usually means you are in and out the same day.
Swing trading usually means holding for a few days to a few weeks.
Position trading usually means holding for weeks to months.
Simple enough.
But the real world is not that clean.
There is a huge gray area between swing trading and position trading.
Some swing traders use intraday charts for execution. Some do not. Some swing traders focus mostly on the daily chart, while others use the daily and weekly structure together.
Position traders can be just as different. Some use the daily and weekly charts. Some care mostly about the weekly chart. Others use the weekly and monthly charts to manage the bigger trend.
And some position traders still look at intraday charts, daily charts, and weekly charts at the same time. They may use the lower time frames for entry and the higher time frames to manage the trade.
This is why one trader can be short a stock and make money while another trader is long the same stock and also make money.
That sounds impossible until you understand time frame.
One trader might be shorting a short-term overextension.
Another trader might be long from a much lower base, holding through normal volatility.
One trader might be managing a 2-day trade.
Another might be managing a 6-month position.
Both can be right.
Both can be profitable.
And the reverse is also true.
Two traders can be on opposite sides of the same stock and both lose money if their timing, sizing, risk management, or execution is poor.
This is why blindly copying someone else’s trade is dangerous.
When you hear that a famous investor is short a stock, you usually do not know their entry, size, hedge, time horizon, partial exits, risk plan, or real objective.
You do not know if they are managing a trade, a hedge, a portfolio position, or a thesis that may take years to play out.
So when people jump online and say, “Aha, he was wrong,” just because the stock went up, they are often revealing more about their own lack of trading knowledge than the investor they are criticizing.
The market does not grade opinions.
It grades time frame, entry, exit, size, risk, and execution.
That is why multiple time frame analysis matters.
Yes, when multiple time frames are aligned, the probability of a trade working usually improves.
And yes, when traders review their losing trades, they often find the same mistake:
They executed on a lower-time-frame signal while the higher time frame was moving against them.
But this note is about something even more basic.
When you are reading Substack, scrolling Twitter, watching YouTube, or listening to someone discuss a stock, you need to understand that everyone may be speaking from a completely different time frame.
Even if they use the same label.
A stock can be bullish on the weekly chart, extended on the daily chart, and breaking down on the 15-minute chart, all at the same time.
That does not mean the chart is confused.
It means you need to know what game you are playing.
Before you ask, “Is this stock bullish or bearish?”
Ask a better question:
“On what time frame?”
One Timeframe Lies. Multiple Timeframes Tell the Truth.
Trends exist on all timeframes, but it is your job to decide which timeframe suits your personality, strategy, and objective best.
That is where many traders get into trouble.
They see something bullish on a 15-minute chart and forget the daily chart is still in decline.
They see a pullback on the daily chart and forget the weekly chart may still be in a healthy uptrend.
They see one candle, one breakout, one moving average, or one support level and act like they have the whole story.
But they don’t.
The market is fractal. The market stages, Stage 1 accumulation, Stage 2 advancing, Stage 3 distribution, and Stage 4 decline, can appear across different timeframes.
A stock can be in a short-term rally while still trapped inside a longer-term downtrend.
It can be pulling back short term while the larger trend remains intact.
It can look “extended” on one timeframe and still be early on another.
That is why multiple timeframe analysis matters.
It gives context.
It helps you separate noise from structure.
It helps you avoid buying short-term strength directly into longer-term resistance.
It helps you avoid selling a normal pullback inside a larger Stage 2 uptrend.
And most importantly, it helps you align your trade with the dominant force.
The point is not that you need to stare at every possible chart. The point is that price must be understood in context.
The longer-term trend gives you the battlefield environment.
The shorter-term chart helps you find the tactical entry, manage risk, and execute with precision.
A single timeframe can make you emotional.
Multiple timeframes help you stay objective.
The best trades usually come when the bigger picture, the intermediate trend, and the execution timeframe are all telling the same story.
That is trend alignment.
And when trends align, you stop forcing trades and start listening to what the market is actually saying.
This is why patience is so important.
When I review traders’ losing trades, many of them looked good on the shorter timeframe, but when you zoomed out and looked at the higher timeframe, it was contradicting what they were trying to do.
For example, the higher timeframe may still be in a downtrend, while the shorter timeframe is showing what looks like a bullish rally.
That is where traders get trapped.
They act on the short-term signal without respecting the bigger trend.
If they would pull back, look at the higher timeframe, and be more patient, the setup often becomes much clearer. Trades tend to work much better when multiple timeframes are aligned.
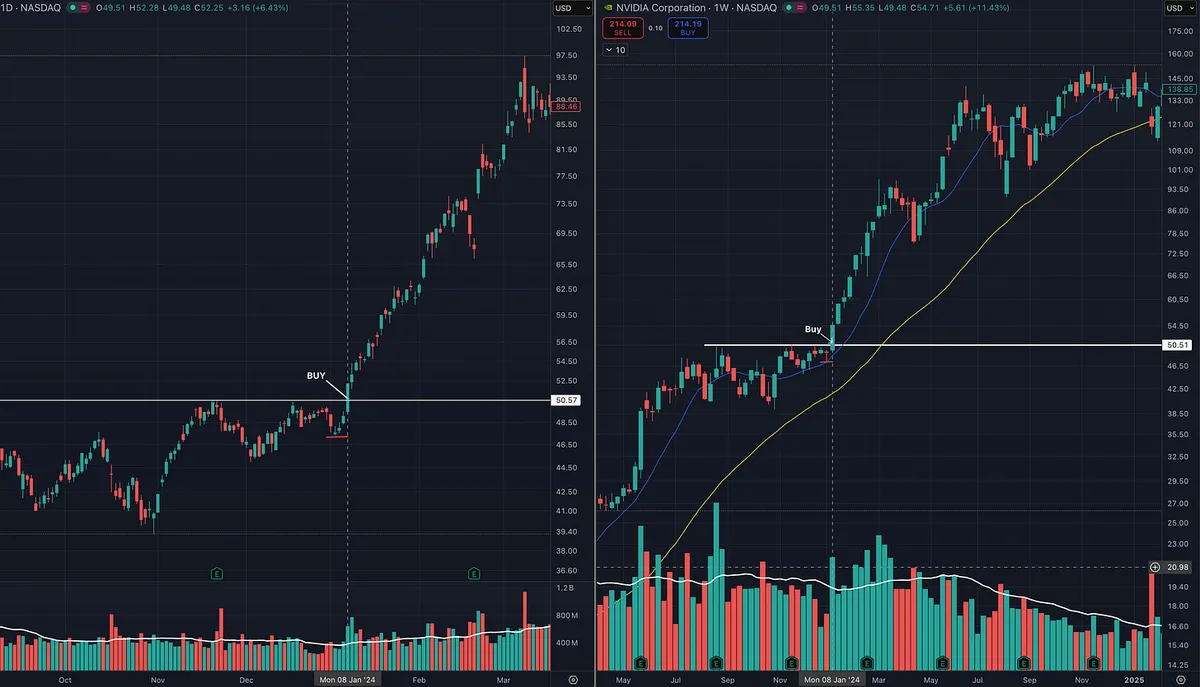
Here is a good example.
The stock was consolidating and tightening up the right side on both the daily and weekly charts. When price broke out, it was also breaking out on the weekly chart.
That was multiple timeframe alignment.
The daily chart and weekly chart were confirming each other.
If the weekly chart had still been in a Stage 4 decline and the daily chart only showed a short-term bullish pop, the odds of that setup working would have been much lower.
That is the difference between trading with structure and trading off one isolated signal.
One timeframe can give you a setup.
Multiple timeframes tell you whether that setup has real power behind it.
The Tape Tells All
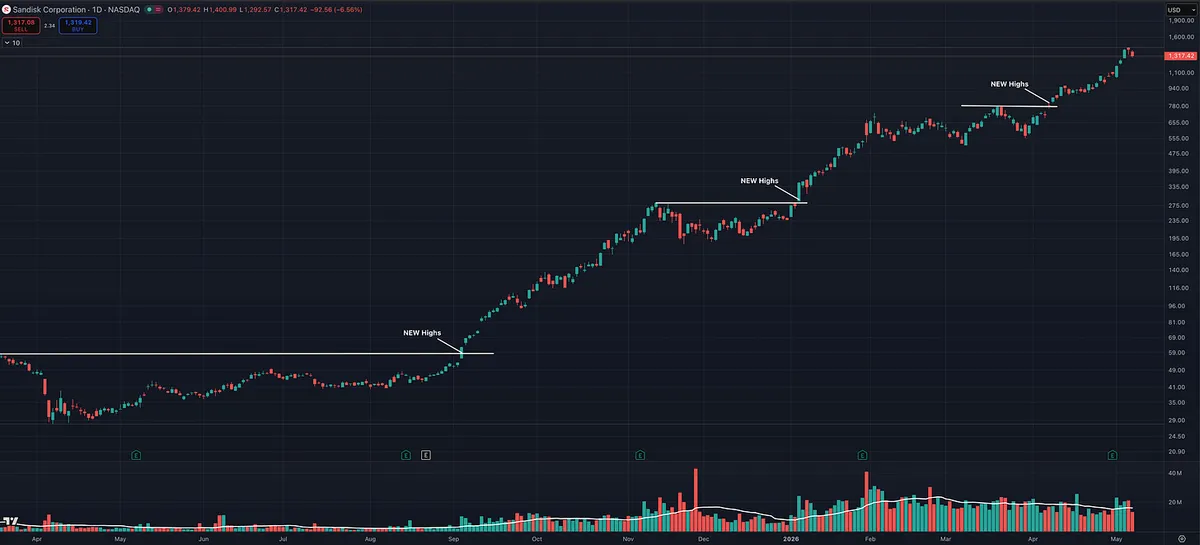
Stan Weinstein’s quote, “The Tape Tells All,” is not just a clever market phrase.
It is his entire philosophy.
What he means is that price and volume often reveal the truth before the news does.
By the time the average investor reads the headline, hears the earnings story, or reacts to the exciting fundamental news, the market has usually already begun discounting it.
The tape is where supply and demand show up first.
A stock breaking out of a long base on heavy volume is not random.
A stock falling below support while the news still looks good is not random.
A stock outperforming the market while the fundamentals still look unimpressive is not random.
That is the market leaving clues.
Weinstein’s point is that the chart reflects what investors are actually doing, not what they are saying. Price, volume, relative strength, support, resistance, and a key moving average (200 daily MA) help reveal whether institutions are accumulating, distributing, or ignoring a stock.
The tape does not care about opinions.
It does not care about what sounds cheap.
It does not care about what the crowd thinks should happen.
It shows what is happening.
That is why Weinstein says the job is to learn how to listen properly.
Not to predict.
Not to argue.
Not to chase headlines.
Read the tape. Respect the trend. Follow the evidence.
This Is What an Episodic Pivot Looks Like
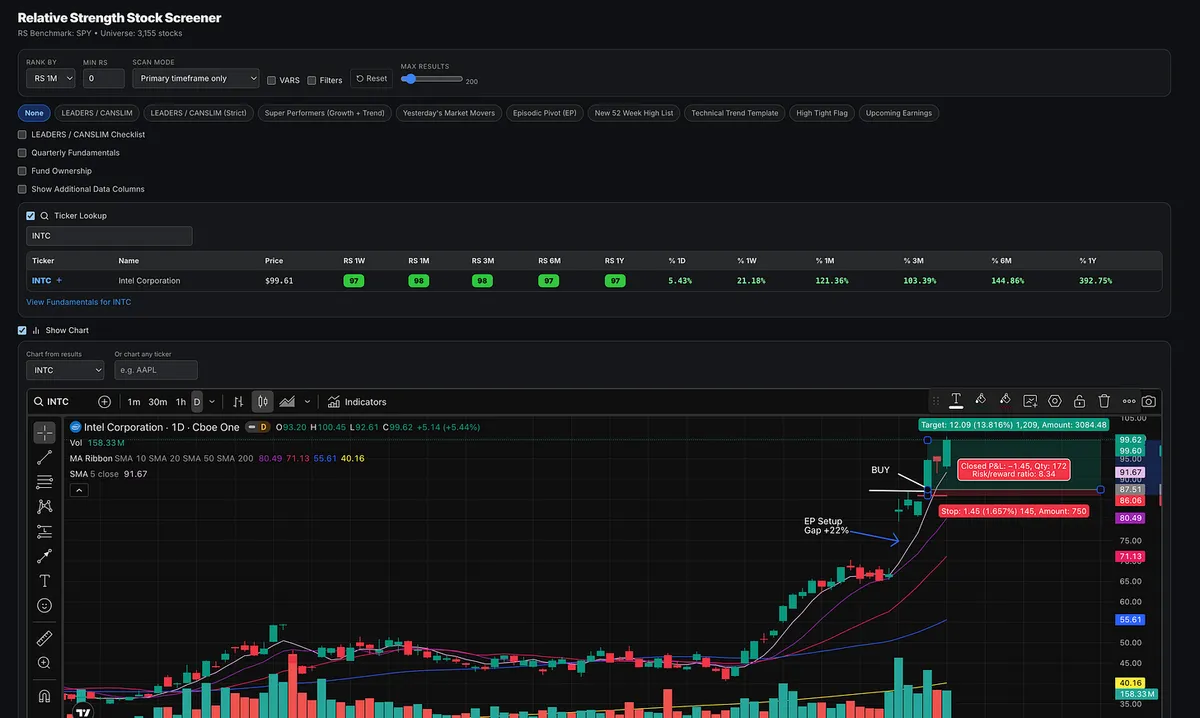
INTC showed up as a clean EP setup.
The stock gapped up +22%, held the gap, then broke out on big volume using an opening range breakout entry.
That is the key.
The gap alone was not the play. After the initial move, price paused, held up, and then pushed to new highs as volume came back in. That gave traders a more precise way to get involved instead of blindly gambling on the gap.
This is why I like combining:
EP catalyst + relative strength + volume expansion + opening range breakout entry
That combination can create a low risk, high reward play.
In this case, the stop was placed at the low of day, giving a clear line in the sand that was much tighter than using the gap-day higher low or previous day low.
This is the type of setup worth studying.
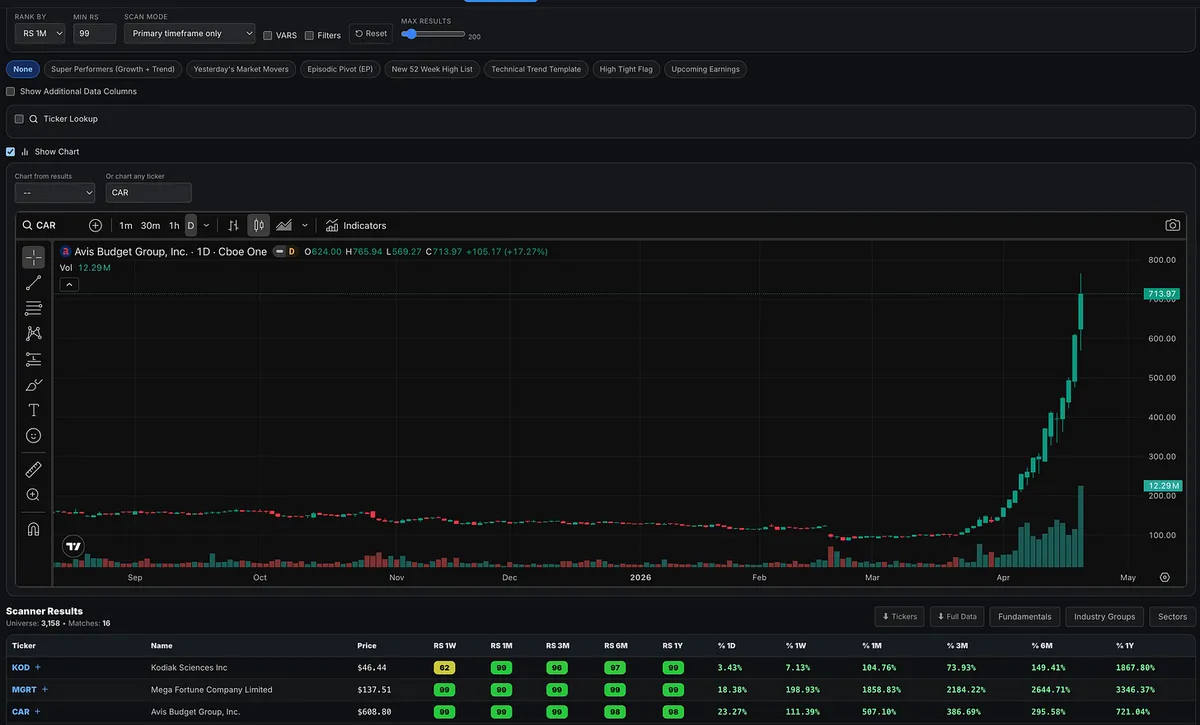
This Is Not A Normal Rally: Inside CAR’s Wild Short Squeeze
What a wild ride.
Since April 1, Avis Budget Group (CAR) has ripped nearly 400% higher, trading more like a speculative momentum name than a traditional rental car business.
This isn’t about a great quarter or a few positive headlines.
This is what happens when positioning collides with supply.
The setup was there.
A large percentage of shares were sold short, while a concentrated group of holders controlled most of the stock.
Once buyers stepped in and price started moving, short sellers were forced to cover.
That covering pushed price higher.
Which forced more covering.
And just like that, a feedback loop formed.
At some point, the narrative flipped.
It stopped being about what the business is worth…
…and became about how far positioning could push it.
Under the surface, the business didn’t change in three weeks.
Avis Budget Group is still operating in the same cyclical, capital-intensive industry, with the same long-term dynamics.
There’s no meaningful growth shift here.
The move was driven by positioning.
From the sidelines, it’s easy to feel like you missed the trade of the year.
But the same mechanics that launch a squeeze…
…can unwind just as fast.
Once shorts are covered and late buyers become the marginal holders, liquidity often disappears on the way down.
What feels like a once-in-a-lifetime move on the way up…
can turn into a sharp lesson in downside volatility.
So how do you actually find these?
Start with what most people ignore:
Float and short interest.
Squeezes are not driven by valuation.
They are driven by supply and positioning.
A simple framework:
Tier 1: Ultra-tight float names
Float: 1M to 25M
Short interest: 20-30%+
These are your classic small float squeezes.
But CAR didn’t fit that mold.
Its float was closer to 34–35 million shares.
Too big for most “low float” scans.
But the key was how crowded the short side was:
~8–9 million shares sold short
Roughly 50–60% of the float
That’s an explosive setup.
Then comes the trigger.
You don’t just buy because short interest is high.
You wait for:
A powerful upside move
Massive volume expansion
A clear shift in behavior
That’s when demand overwhelms supply.
That’s when squeezes start.
CAR checked every box.
And once it started moving…
The feedback loop took over.
For traders, this is the takeaway:
Float.
Short interest.
Watching for that big price and volume surge.