Momentum Trading Strategy

Notes

Chart Setups & Entries

When and where to buy a stock you have already found: chart patterns, buy points and entry tactics.

Showing 61–80 of 185 notes

View on Substack ↗

The Best Breakouts Get Quiet Before They Explode

One of the biggest mistakes traders make with a VCP is focusing only on the shape.

Mark Minervini’s Volatility Contraction Pattern is really about supply and demand.

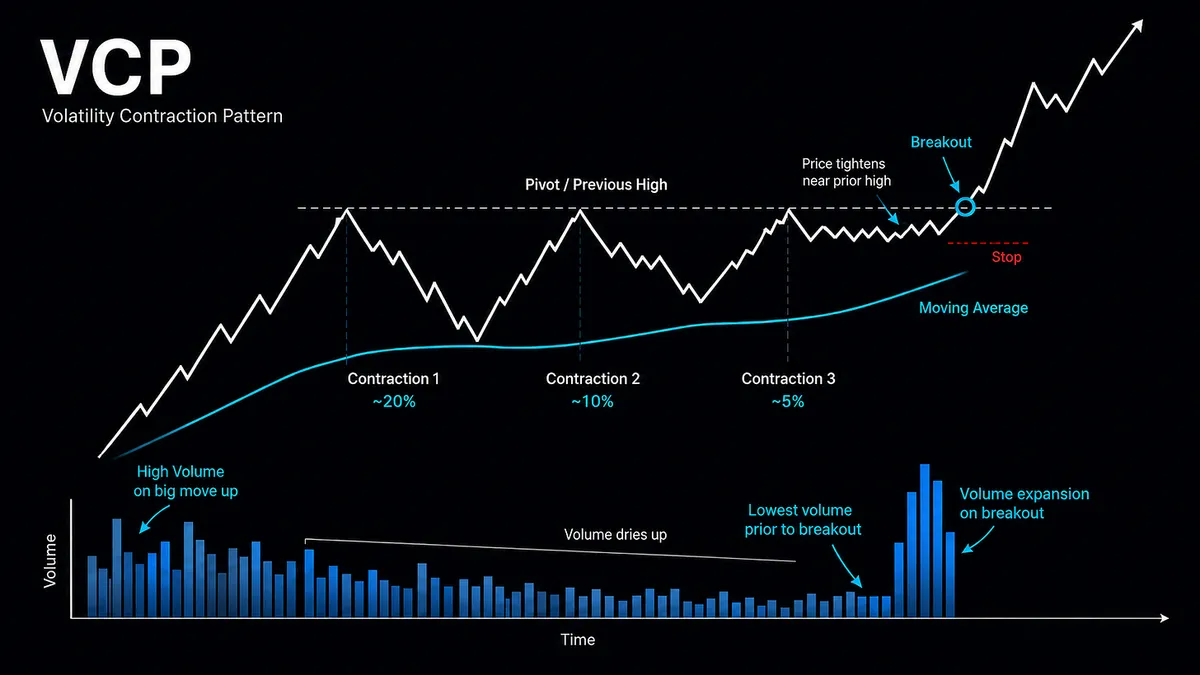
As the base develops, the pullbacks should get progressively smaller from left to right. Minervini gives the example of roughly 20%, then 10%, then 5%, with each contraction generally becoming much smaller than the one before it.

At the same time, volume should contract.

That may be the most important part.

As price tightens near the prior high, selling pressure is drying up. Minervini notes that during the final contraction, volume can fall to some of the lowest levels of the entire base.

Think about what that means.

Price is getting tighter. Volume is getting quieter. Supply is disappearing.

The stock is moving toward what Minervini calls the line of least resistance.

Then comes the trigger.

The entry is when price moves through the pivot on expanding volume, ideally followed by continued institutional buying.

That’s the VCP.

Not just a chart pattern.

It’s the footprint of supply being absorbed until demand finally takes control.
View on Substack ↗

The Best Thing About a VCP Isn’t the Breakout

One of my favorite quotes in Market Wizards comes from Bruce Kovner:

“Whenever I enter a position, I have a predetermined stop. That is the only way I can sleep. I know where I’m getting out before I get in. The position size on a trade is determined by the stop, and the stop is determined on a technical basis. For example, if the market is in the midst of a trading range, it makes no sense to put your stop within that range, since you are likely to be taken out. I always place my stop beyond some technical barrier.”

- Bruce Kovner, Market Wizards

That quote explains one of the biggest reasons I love the Volatility Contraction Pattern.

Most people focus on the obvious part of a VCP.

  • Price tightens.

  • Volume dries up.

  • Supply appears to diminish.

It is almost like a rubber band being pulled tighter and tighter, creating the potential for an explosive move once demand overwhelms the remaining supply.

All of that is great, but that is not my favorite part.

My favorite thing about a VCP is that it can give you a very clear technical level where you have decided the trade is wrong.

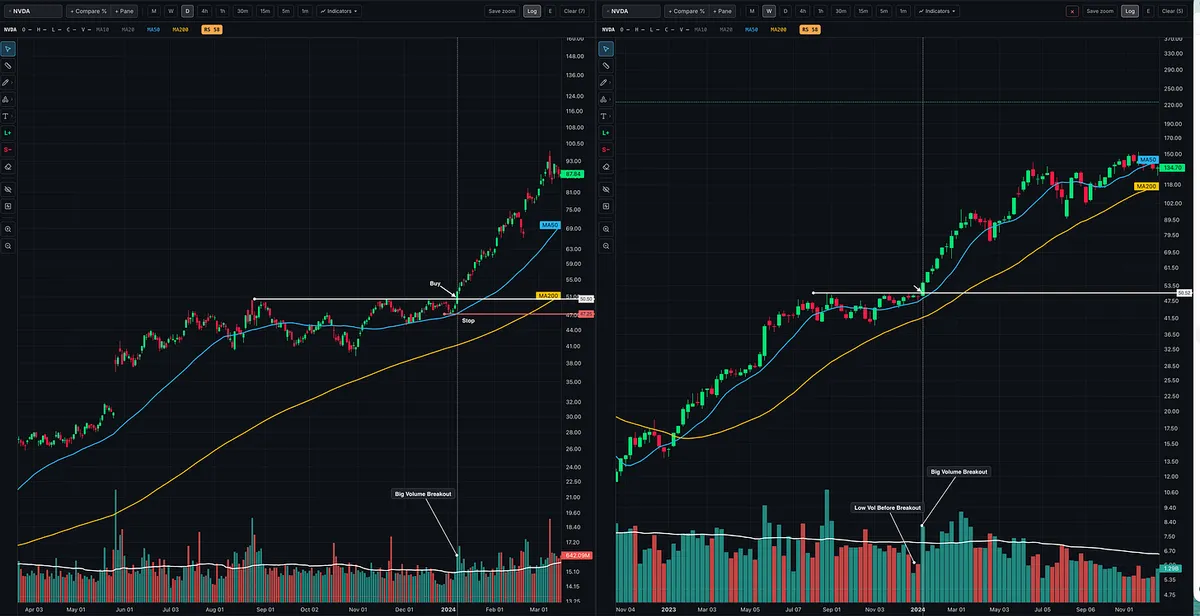
Look at NVIDIA in early 2024.

The stock tightened up near the pivot. Volume dried up. Then price broke through the line of least resistance on expanding volume.

But before the breakout ever happened, I could already identify my risk.

I knew where I wanted to enter.

I knew where the technical structure would begin to fail.

And because I knew my stop, I could determine my position size before putting capital at risk.

That is the part many traders get backwards.

They decide how many shares they want to own first, then try to squeeze a stop somewhere underneath the trade.

I prefer the opposite:

  • Find the setup.

  • Find the technical level that invalidates the setup.

  • Set the stop beyond that level.

  • Then size the position.

The chart determines the risk.

Your desired position size should not determine the chart.

And this is why a tight, well-formed setup can be so powerful. It is not simply that the stock might explode higher.

It is that you can potentially participate in that move while knowing where your idea no longer makes sense.

View on Substack ↗

This Price Action Is Beautiful!!!

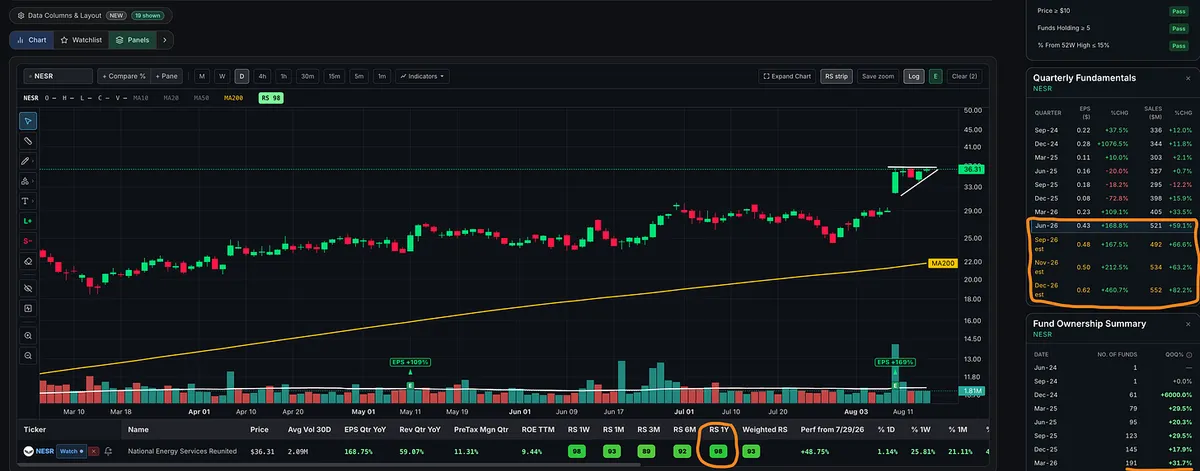
Check out NESR.

This is exactly the kind of setup I love to see.

Strong move higher, followed by tight price compression right at the highs as volume dries up. Higher lows continue pressing into resistance, and now price is sitting just beneath the breakout level.

What I’d love to see Monday: a decisive push through the highs on heavy volume.

And this is the type of trade where I don’t mind being wrong. The setup is tight, the risk is clearly defined, and I can keep my stop close.

The fundamentals are there too:

  • Triple-digit earnings growth.

  • Double-digit sales growth.

  • Fund ownership increasing quarter after quarter.

  • RS near the top of the market.

Explosive upside move. Price tightens during the pause. Strong growth fundamentals. All the ingredients for another powerful move higher.

View on Substack ↗

This Is One of My Favorite Price Patterns to Watch

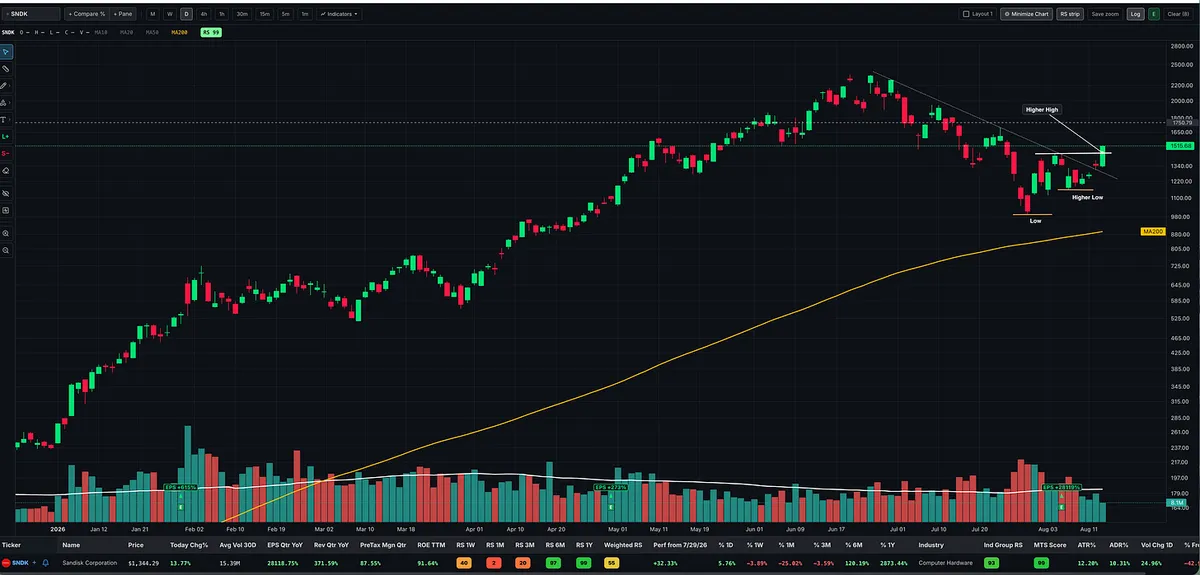
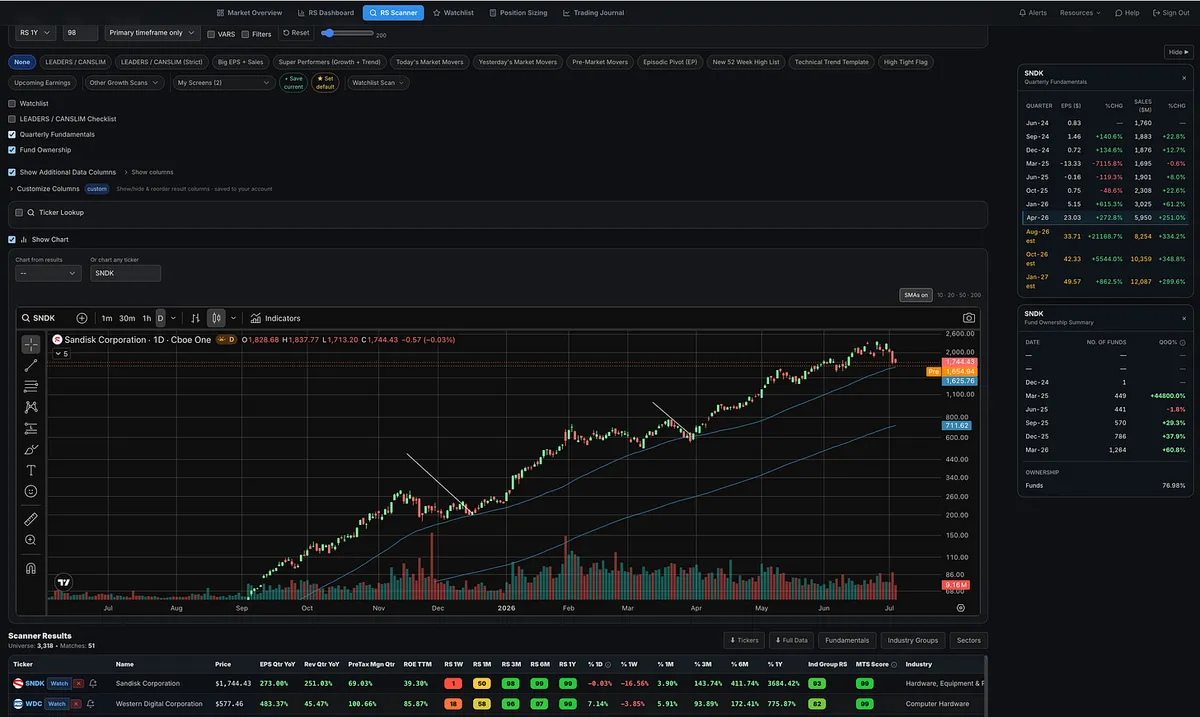
SNDK is showing up near the top of today’s market mover scan.

Big earnings growth. Big sales growth. Strong relative strength. And now the price action is starting to get interesting.

Look at the chart.

SNDK put in a low, rallied, pulled back without making a new low, and formed a higher low.

Today it pushed above the August 4 swing high, giving us the next higher high.

Higher low → Higher high.

This is one of my favorite patterns to watch because I’m not trying to guess the exact bottom. I want price to start showing me evidence that the trend may be changing.

There are still plenty of reasons to remain patient.

The stock is still below its 50-day moving average, and I would like to see more volume coming into the advance.

And this stock has a lot of work left to do.

From around current prices, SNDK would still need to climb more than 50% just to get back to its June highs.

So I’m not saying the stock is suddenly fixed or that it has to go back to the highs.

I’m simply saying:

This is the type of price action that gets my attention.

Strong fundamentals get the stock on my radar.

Price has to earn the trade.

View on Substack ↗

What Happened to All the SpaceX Buyers?

If you study market history, run even a basic backtest, or conduct any serious research, you quickly realize that blindly buying hype is usually a bad bet.

I may own SPCX one day. I think SpaceX could ultimately become an incredible public company.

But liking the company and liking the setup are two completely different things.

Buying a heavily hyped IPO straight out of the gate and simply holding it is not what I consider a low-risk, high-reward opportunity.

There is very little price history, no established base, and often no logical place to define your risk.

The better opportunity frequently comes later, after the initial excitement fades, price discovery takes place, and the stock has time to build a real base.

That entry could come six, twelve, or even eighteen months later at a lower price. Sometimes many years later.

It could also come at a higher price, after the stock has proven itself and offered a proper setup.

I do not need to own the first move.

I want the move that gives me the best combination of confirmation, defined risk, and potential reward.

But human nature will continue to repeat itself.

People will continue chasing hype, convincing themselves that this time is different, and laughing at experienced traders who warn them to be patient.

They will say the older traders do not understand the opportunity.

Then the market will teach the same lesson it has been teaching for more than a century.

Quoting Momentum Trading StrategyThe IPO Trap Most Traders Fall For A lot of people are getting excited about a potential SpaceX IPO. And I get it. Big company. Big story. Big hype. Lots of emotion. But this is where a lot of inexperienced investors get caught. They buy on day one with no game plan. No entry strategy. No risk plan. No understanding…
View on Substack ↗

This Is What a VCP Breakout Is Supposed to Look Like

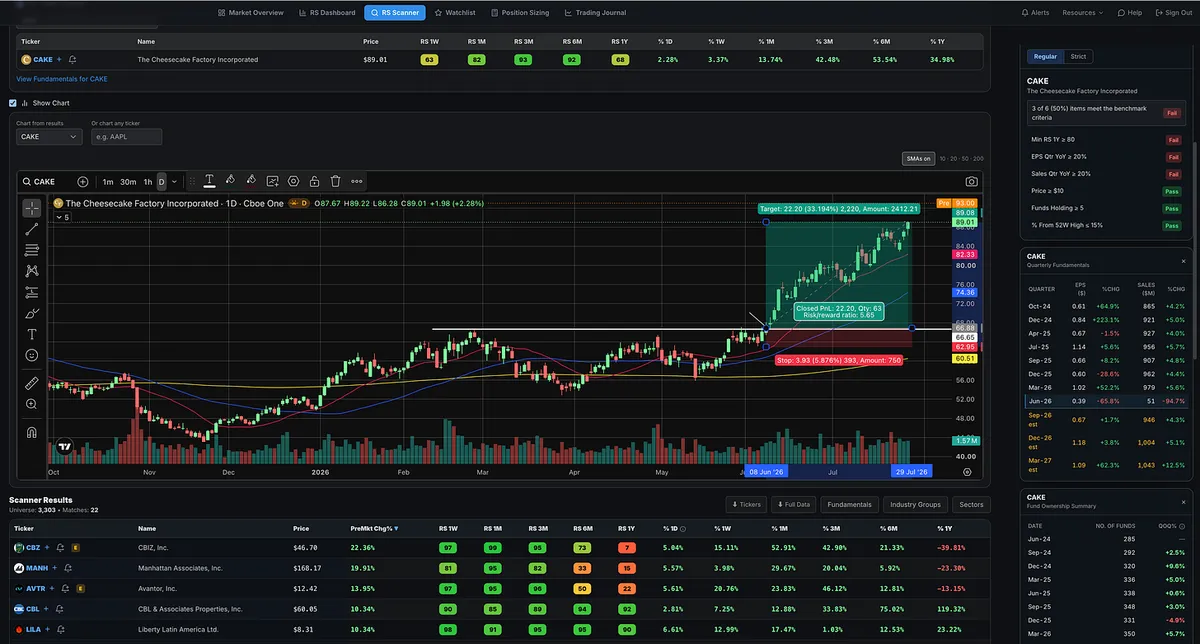
Looking through this morning’s premarket movers, CAKE, The Cheesecake Factory, immediately stood out.

The stock broke out of a well-formed base in early June.

Beautiful VCP action.

Each contraction became smaller, volatility dried up, and the tight price action provided an attractive risk-to-reward opportunity.

After the breakout, CAKE continued forming higher highs and higher lows while repeatedly finding support near its rising 20-day moving average.

Now the stock is gapping higher following earnings.

View on Substack ↗

The Setup I Almost Can’t Resist

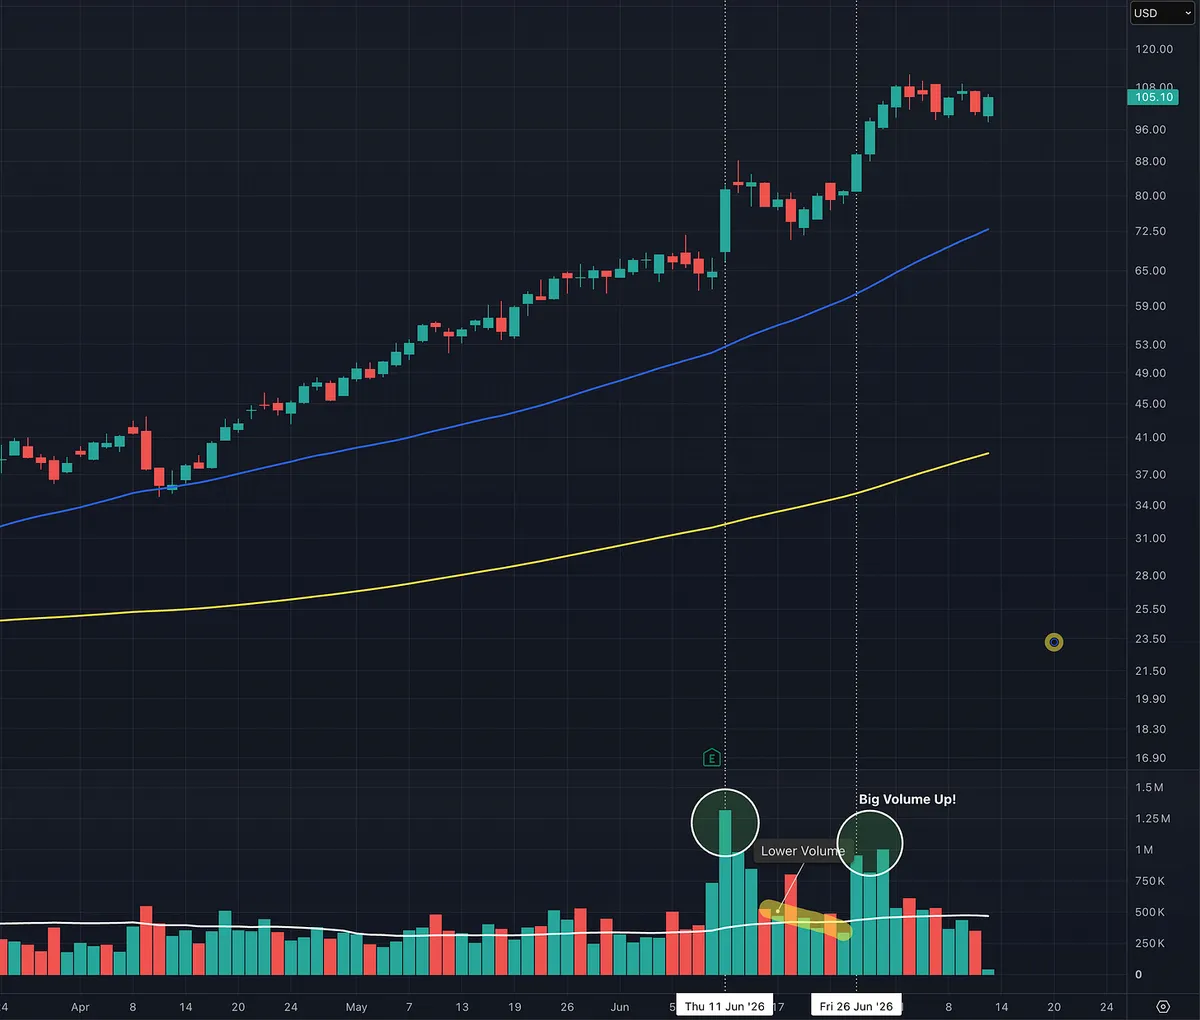
When I see a stock make a powerful move higher and then pull back quietly on declining volume, I almost can’t resist taking the trade.

The initial move shows strong demand. The low-volume pullback suggests the sellers are drying up.

I do not need every trade to work.

No setup works every time.

But when a powerful move is followed by a quiet, low-volume pullback, that is the type of pattern I want to bet on repeatedly. The potential reward can far outweigh the clearly defined risk.

View on Substack ↗

Finding Episodic Pivots

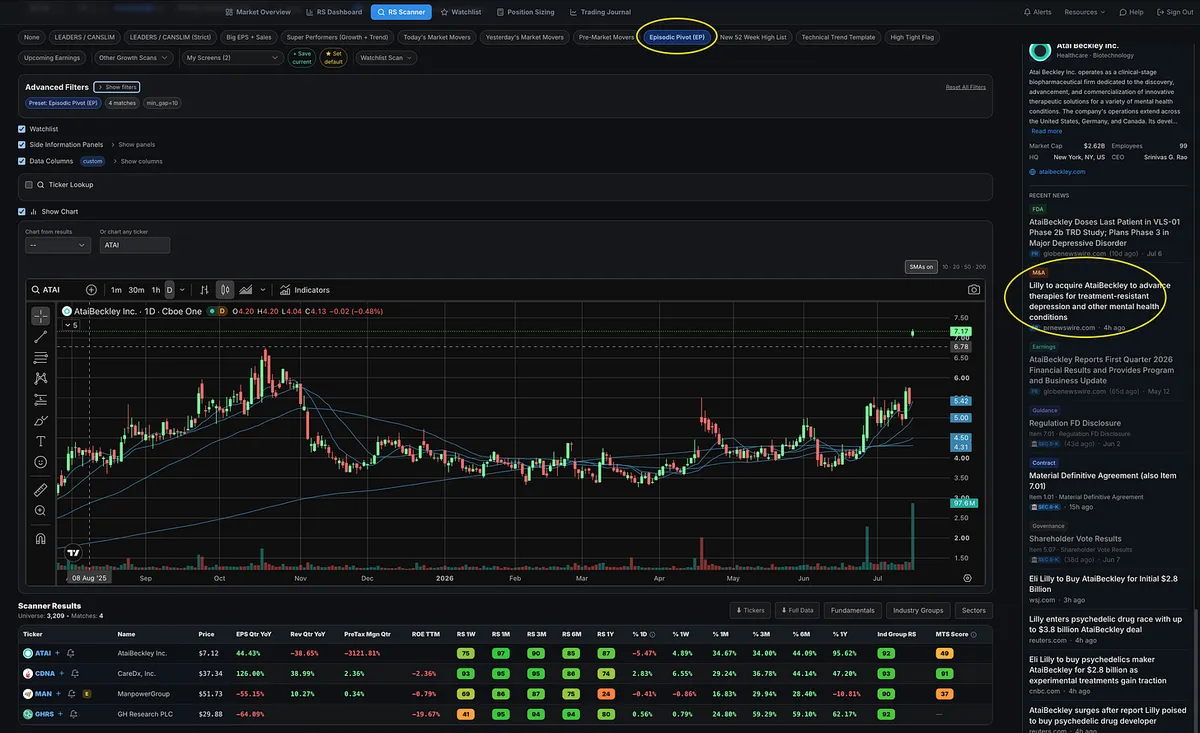
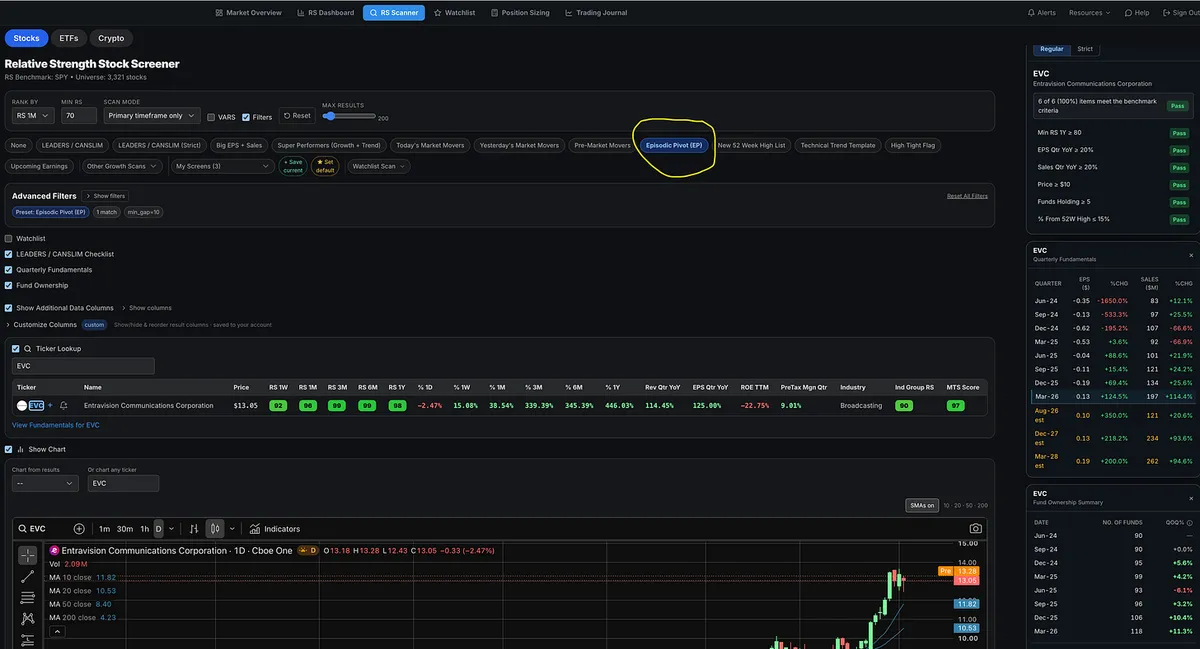
For those who like to track episodic pivots, simply select the EP preset filter and check it each day. There are usually only a handful of stocks to review, making it easy to identify potential opportunities without searching through thousands of names.

For example, ATAI recently appeared in the EP scan. From there, you can scroll down to the Ticker Info & News panel to review the latest headlines and quickly identify the catalyst behind the move, whether it is earnings, a major company announcement, or another significant event.

In ATAI’s case, the catalyst was the announcement that LLY would acquire the company.

View on Substack ↗

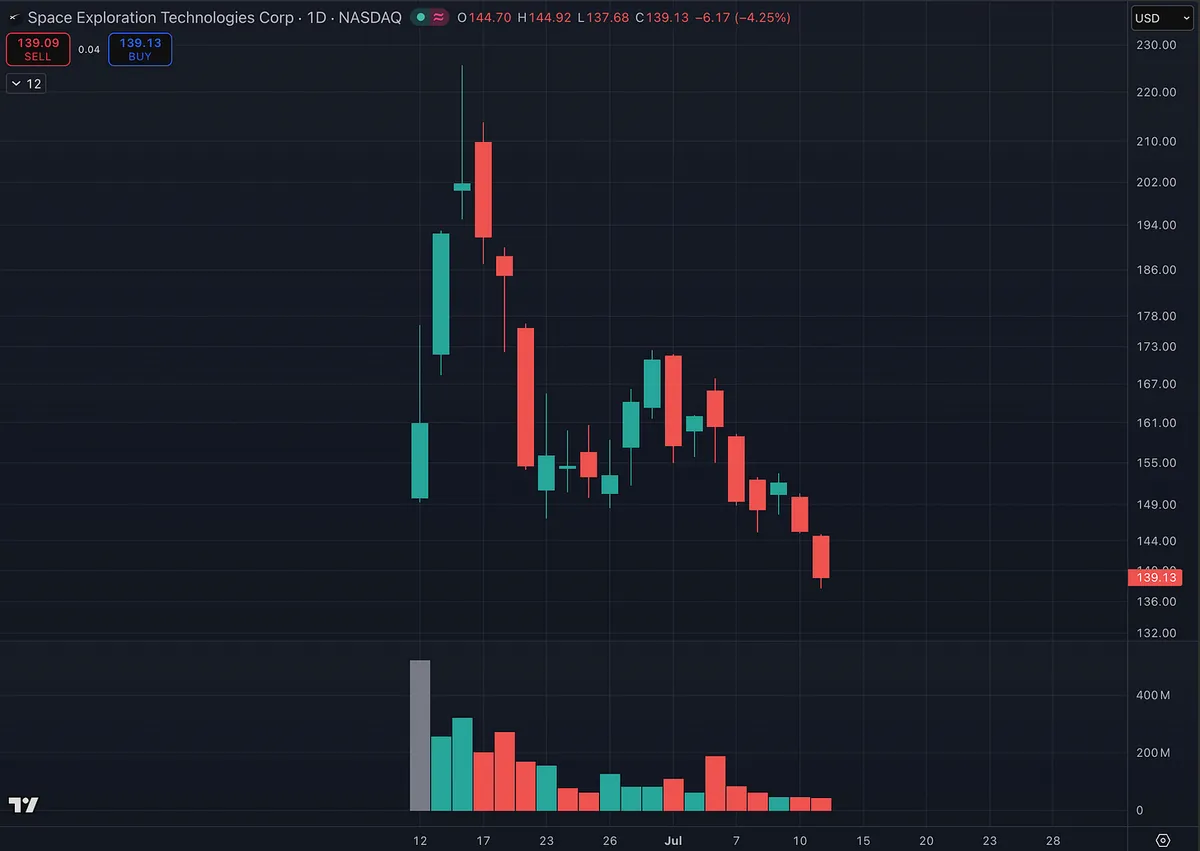
But SpaceX Was Different... Right?

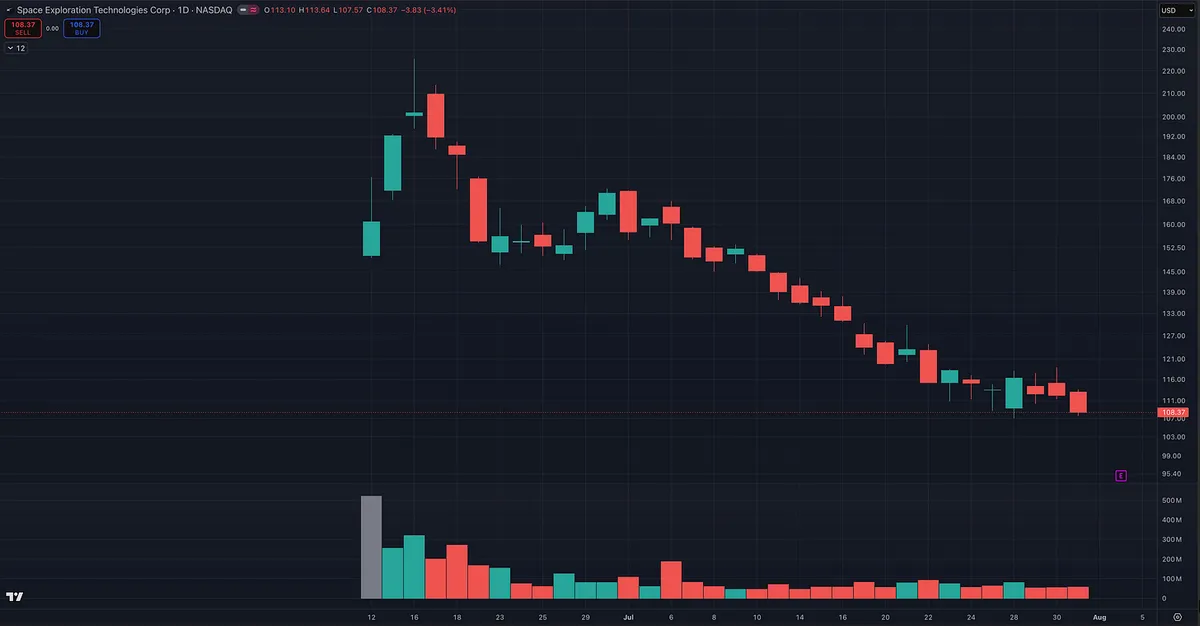
SpaceX surged after its IPO, the hype exploded, and anyone warning about chasing it probably sounded overly cautious.

Now, the entire move has been erased.

The company may be different.

Human emotion is not.

This is exactly why I wrote this.

Quoting Momentum Trading StrategyThe IPO Trap Most Traders Fall For A lot of people are getting excited about a potential SpaceX IPO. And I get it. Big company. Big story. Big hype. Lots of emotion. But this is where a lot of inexperienced investors get caught. They buy on day one with no game plan. No entry strategy. No risk plan. No understanding…
View on Substack ↗

Volume and Price Characteristics I Look For

I want to see price advance on expanding volume, showing strong demand, followed by a controlled pullback on lighter volume. The lower-volume decline suggests sellers are not pressing aggressively, while the next surge in volume confirms buyers are stepping back in. That combination often signals healthy accumulation within an ongoing uptrend.

View on Substack ↗

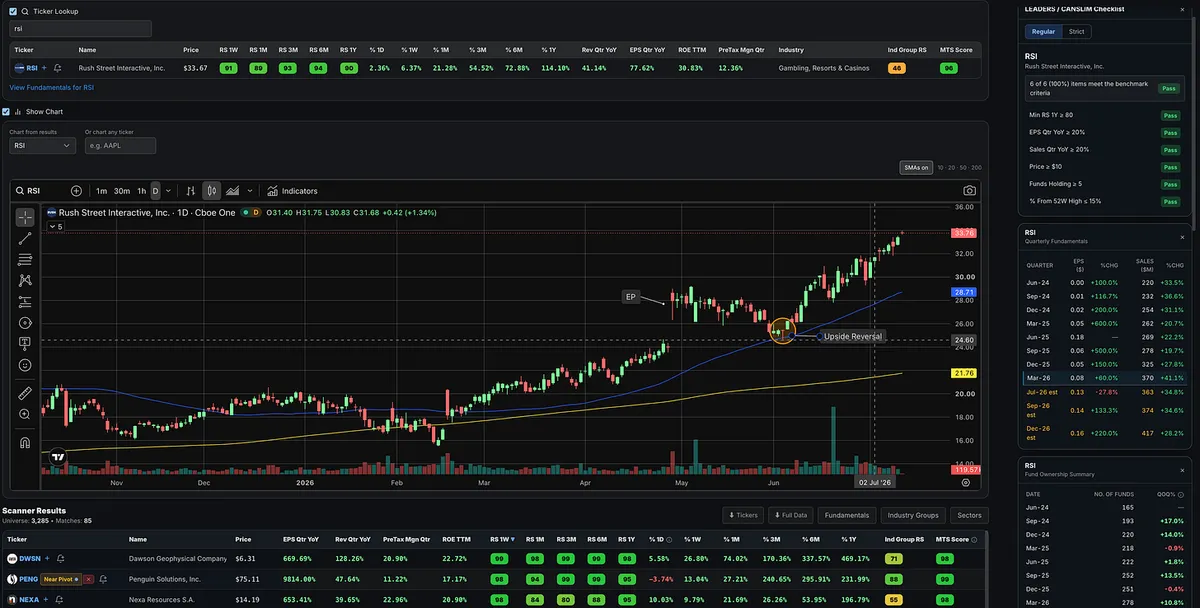
From Episodic Pivot to Pullback Entry: RSI’s 50-Day Upside Reversal

RSI had an episodic pivot following earnings on April 29, then gradually drifted back toward the 50-day moving average on light volume. At that point, the stock produced an upside reversal, creating a potential entry for traders who had been waiting for an opportunity to get involved.

This is a good example of why building and maintaining organized watch lists is important. Many traders probably found RSI on an episodic pivot or relative strength scan, watched it for a few days, and then lost track of it before the actual entry developed. By keeping the stock on a focused watch list, you would have been prepared when it finally tested support.

Was this a perfect textbook upside reversal? No. Those are much rarer. Ideally, the reversal would have occurred on heavier volume and closed above the prior day’s high. Even so, it still qualifies as an upside reversal. The long lower wick shows that price established a low near the 50-day, rejected that weakness, and closed near the top of the day’s range at or slightly above the prior day’s close. Since then, RSI has continued to trend higher.

View on Substack ↗

I’ve received a lot of comments from people who believe today’s market is fundamentally different, that O’Neil did not trade stocks with this level of volatility, and that past leaders did not have comparable price swings, ADRs, or ATRs.

Qualcomm in 1999 directly challenges that assumption.

O’Neil absolutely traded highly volatile stocks during highly volatile market periods. The names, industries, and technology may change, but powerful leaders with wide price swings are NOT new.

I added an important Qualcomm 1999 example to this post that I left out when I originally published it.

When I recreated O’Neil’s Qualcomm setup using historical data, I found that a stop below the most recent higher low would have been about 10.1%, outside his traditional 7% to 8% guideline.

But a stop at the low of the high-volume breakout day would have been roughly 6.2%, keeping the trade comfortably within O’Neil’s framework.

Qualcomm was highly volatile and still went on to produce an extraordinary advance. It is a strong reminder that fast-moving market leaders are not unique to today’s market.

The lesson is not that O’Neil ignored his rule. We do not know the exact stop he used. The lesson is that a more precise entry and stop location can sometimes allow you to participate in a volatile leader without accepting a wider stop loss.

I added all three Qualcomm charts and the full breakdown to the article. Take another look at the updated post.

ArticleDoes O’Neil’s 8% Stop Rule Still Work Today?
View on Substack ↗

Don’t Miss the Trade Trying to Save 5 Cents

I’ve had quite a few beginner traders DM me asking about order types, so I figured I’d share this for anyone who is new to momentum investing.

As growth stock and momentum traders, we do not care about getting the perfect penny. We care about getting into the right stock at the right time.

If I’m watching the breakout live, I simply use a Market Order. I’m not going to risk missing a quality breakout because I was trying to save a few pennies with a limit order.

If I cannot be at my computer, I’ll place a Buy Stop Order at my breakout or pivot price.

For example, if a stock is trading at $98 and my breakout level is $100, I’ll set a Buy Stop at $100, or slightly above it.

If the stock reaches that level, the order is triggered automatically.

I’ll also attach a Sell Stop as a bracket order at my predetermined stop-loss level. That way, as soon as I’m filled, my protective stop is automatically active.

Keep it simple.

As momentum traders, the main order types we use are:

Market Orders

Buy Stop Orders

Sell Stop Orders

You do not need to overcomplicate things with a dozen different order types.

And you definitely do not want to miss a great trade because you were trying to save a few pennies with a limit order.

View on Substack ↗

A Simple TradingView Tip for Using Daily and Weekly Charts

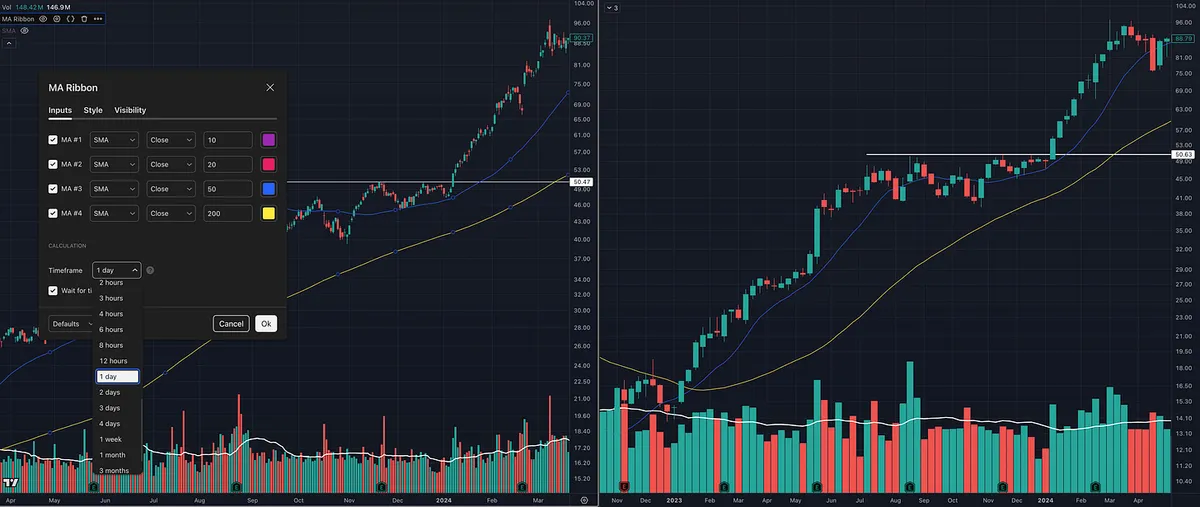
Change your moving-average timeframe from Chart to 1 Day.

By default, moving averages follow the chart timeframe. On a daily chart, you will see the 50-day and 200-day moving averages. Switch to a weekly chart, and those same settings become the 50-week and 200-week moving averages.

Changing the timeframe to 1 Day keeps the 50-day and 200-day visible even when you move to the weekly chart.

This is useful because I believe swing and position traders should study both timeframes.

The weekly chart gives you the bigger picture. It helps you see the primary trend, the larger base, and whether the stock is moving through an important long-term area.

The daily chart gives you more detail. It helps you identify the setup, determine your risk, and manage the trade more precisely.

I generally use the weekly chart for context and the daily chart for execution and trade management.

You can even take it one step further.

When executing an entry intraday, keeping the moving-average timeframe set to 1 Day allows you to watch price approach an important daily level, such as the 50-day moving average, in real time.

The weekly chart shows you the forest.

The daily chart shows you the tree.

The intraday chart can help you time the entry.

View on Substack ↗

SNDK Loves the 50-Day

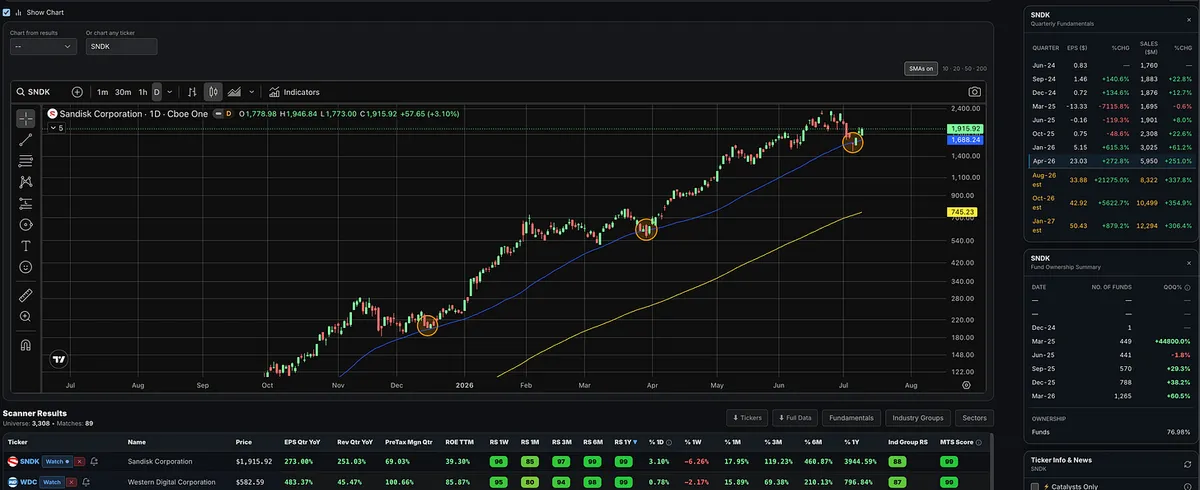
SNDK has repeatedly found support around the rising 50-day moving average throughout this massive run.

It happened in December 2025.

It happened again in late March as the market bottomed.

And now, SNDK has done it again, briefly undercutting the 50-day before reversing sharply and closing near the top of the day’s range.

We will see if the trend continues.

“The trend is your friend until the end when it bends.”

-Ed Seykota

View on Substack ↗

The Human Eye Still Wins

I get a lot of questions from people asking if there are indicators, AI tools, or software platforms that can automatically spot chart patterns and setups.

Bottom line:

I have yet to find anything good enough to replace the human eye.

And trust me, I would love if it existed.

If there were a tool that could accurately identify the best setups, VCPs, tight areas, proper pivots, and actionable patterns with consistency, I’d be one of the first people using it.

Then I could spend a little more time on the beach with my kids instead of reviewing charts.

But I have tried quite a few of them.

MarketSurge, TradingView, TrendSpider, and plenty of others all have some form of pattern recognition.

Some are useful for basic visual cues.

But none of them are good enough to fully rely on.

They miss too many great setups.

They flag too many bad ones.

And they still do not understand the most important part:

Context, supply, and demand.

A pattern is not just a shape.

Even when these tools spot the general structure, they still struggle to factor in everything that actually matters: volume price analysis, price tightening, volume drying up on the contraction, volume surging on the way up, and whether the stock is actually under accumulation.

Small differences matter.

That is what makes this so hard to quantify.

A good setup may not show up.

A bad setup may get flagged.

Trading is both art and science.

Maybe one day we will be replaced by some amazing software, but that time is not now.

The best traders are NOT still reviewing charts because they are dinosaurs who refuse to adapt to new technology. Some of the best traders are actually the most adaptable people in the market.

They still review charts because the software does not work well enough yet.

Period.

The best way to see supply and demand at work is still simple:

Look at price and volume.

Software can help narrow the list.

But the human eye still has to judge the setup.

View on Substack ↗

The Episodic Pivot (EP) Setup Most Traders Miss

I get a lot of questions about episodic pivots.

  • What are they?

  • How do you find them?

  • And more importantly, how do you make sure you do not forget about them?

An episodic pivot is a powerful price and volume move caused by a meaningful catalyst, usually earnings, guidance, FDA news, contract news, or some other event that forces the market to reprice the stock.

But here is what most traders miss.

The best setup does not always happen on the day of the big move.

Sometimes the stock gaps up, runs hard, pulls back, volume dries up, tightens, and then gives a much cleaner entry days, weeks, or even months later.

That is why tracking these names matters.

Inside the Momentum Trading Strategy software, we have an episodic pivot preset screen to help find these stocks.

But finding them is only step one.

The real edge is creating an Episodic Pivot watchlist inside the Relative Strength Stock Screener.

Under Manage Sub-Categories, create one called EPs.

Now you have your episodic pivots organized in one place.

Add the names when they show up.

Review them daily or weekly.

Do not force the trade.

Just wait.

Some will fail.

Some will go nowhere.

But some will tighten up and set up again.

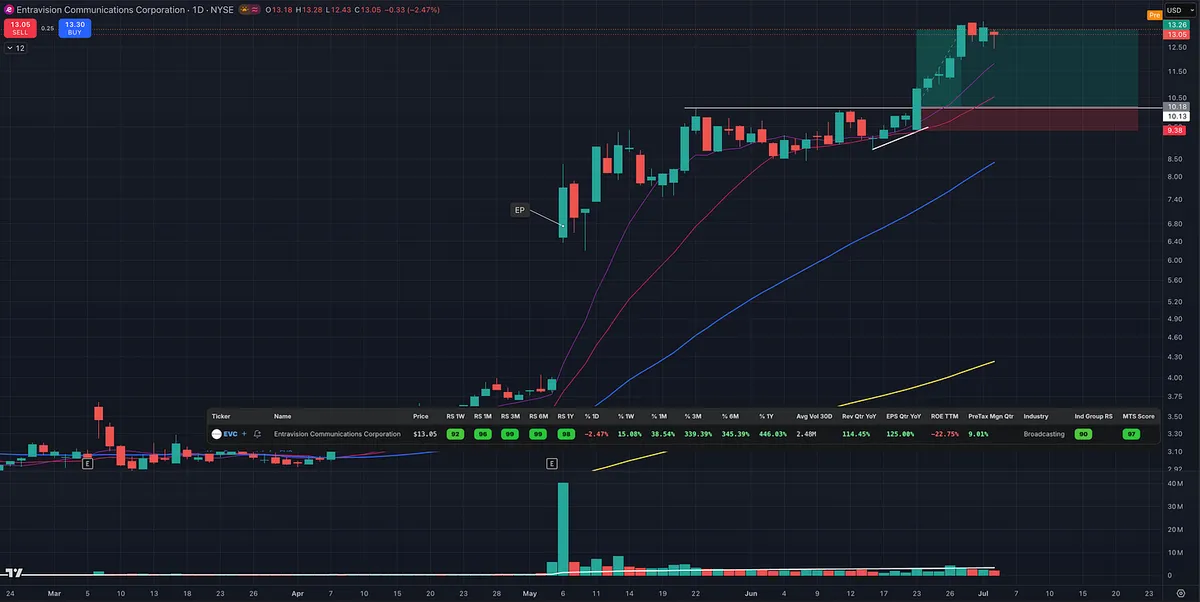
EVC is a good example.

The earnings catalyst launched the stock higher, but the cleaner opportunity came later after it consolidated, tightened up, and broke out again.

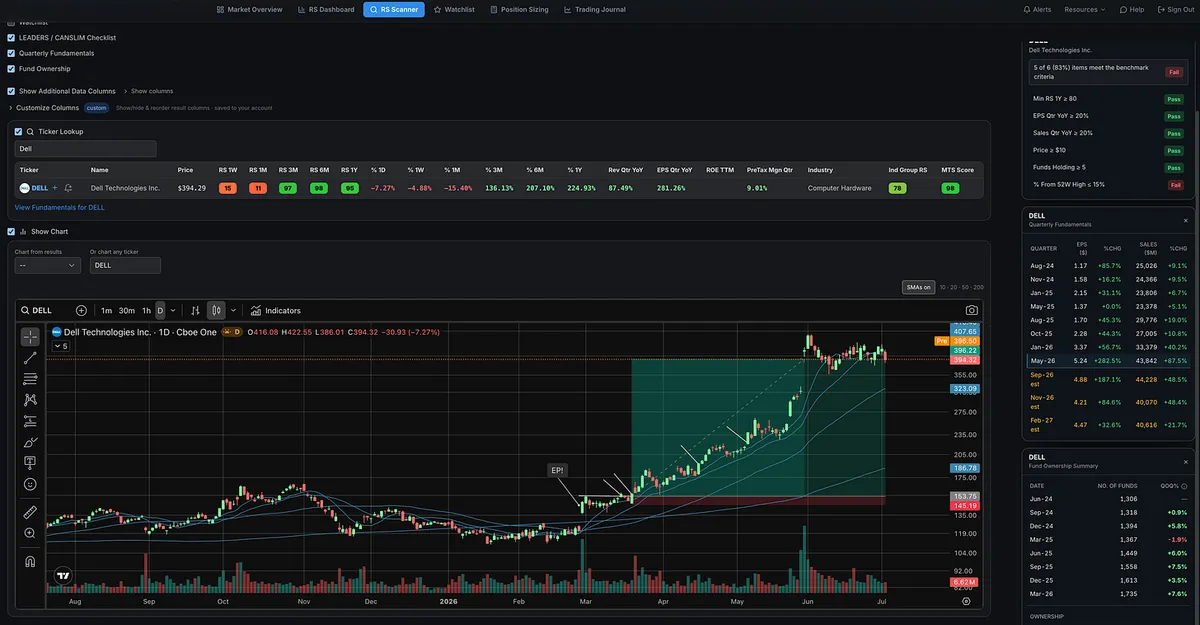
DELL was another great example.

The episodic pivot should gets your attention.

The watchlist keeps it on your radar.

The setup tells you when to act.

View on Substack ↗

Price Is King. Volume Is Queen.

“Volume reveals activity. Volume reveals the truth behind the price action. Volume validates price.”

-Anna Coulling, A Complete Guide to Volume Price Analysis

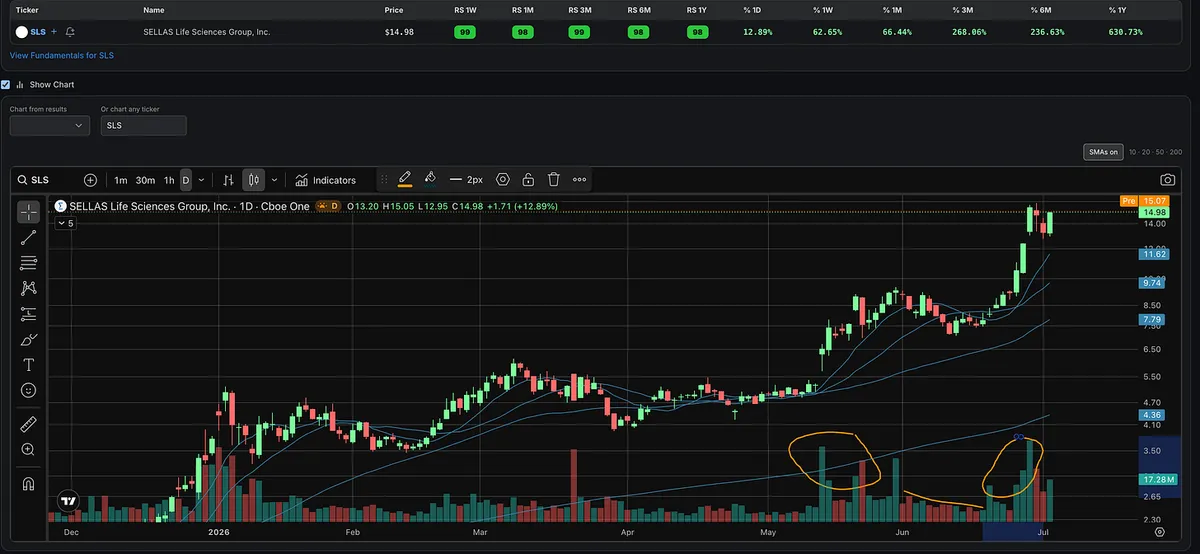
This is exactly what we want to see with price and volume.

First, SLS makes a powerful move higher on big volume.

Then, on the pullback, volume dries up.

That’s important.

It shows selling pressure is not overwhelming demand.

Then volume comes back in as price starts moving higher again.

That is price and volume working together.

Price is king.

Volume is queen.

And when they are working in harmony, traders need to pay attention.

This is a great example of Volume Price Analysis.