
Trading articles/Does O’Neil’s 8% Stop Rule Still Work Today?
Jul 12, 2026 · Momentum Trading Strategy
Does O’Neil’s 8% Stop Rule Still Work Today?
What O’Neil, Minervini, Kristjan Kullamägi, Dan Zanger, and Bruce Kovner can teach us about tighter entries, technical stops, position sizing, and managing today’s higher-volatility market leaders
Originally published on Substack.
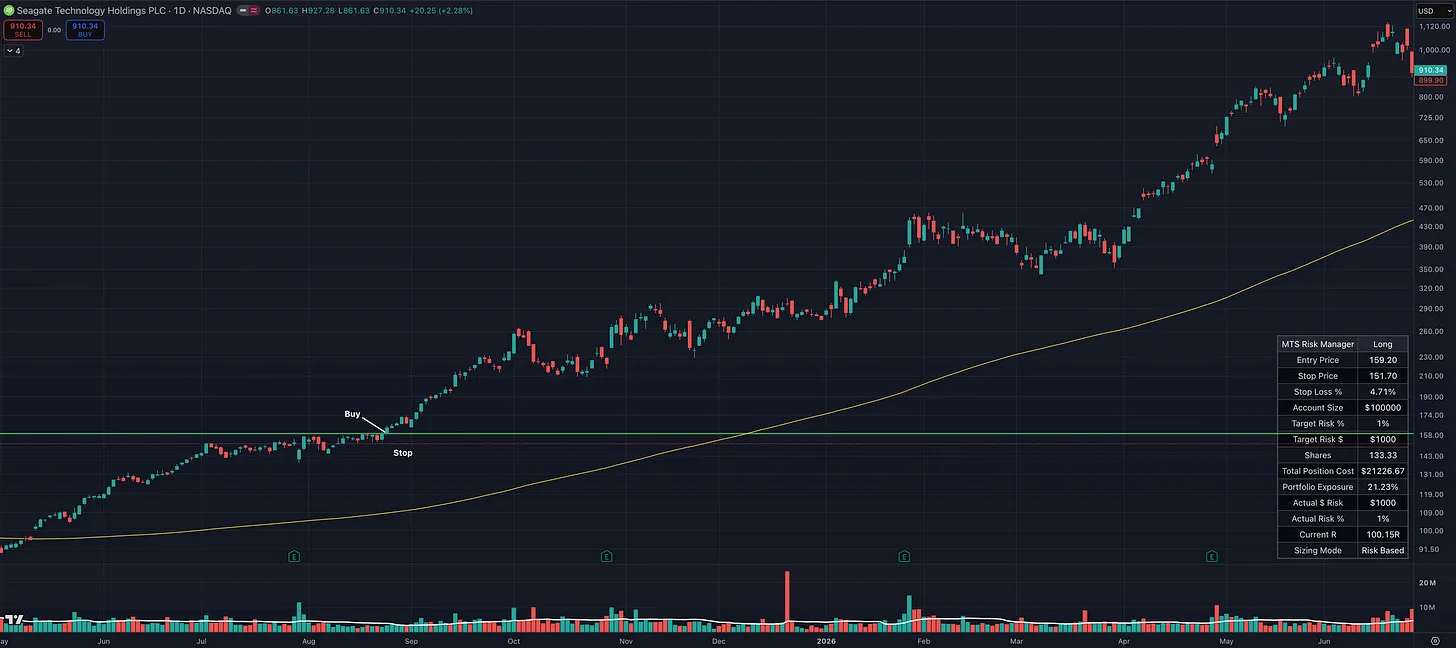
I get this question a lot, and I have answered it in past posts, videos, and conversations, but it continues to come up, so I figured it was worth writing about again for anyone who may have missed those earlier discussions.
You find a true market leader.
The earnings and sales are strong. Relative strength is high. The stock builds a quality cup with handle, VCP, or another constructive base. Price tightens, volume dries up, and demand comes in on the breakout.
Everything looks right.
Then you measure the distance between your entry and the logical technical stop.
It is not 6%, 7%, or 8%.
It is 10%, 11%, or even 12%.
Now you have a decision to make.
- Do you follow William O’Neil’s rule and pass on the trade?
- Do you place the stop at 8%, even though that level sits inside normal price action?
- Do you widen the stop and reduce your position size?
- Or do you use a different entry tactic to tighten the risk?
This is a real issue for growth stock and momentum traders. It also leads to a larger question that every serious trader eventually has to answer:
When should you follow a proven rule exactly, and when have you earned the right to adapt it?
In this article, I will explain why O’Neil’s 7% to 8% rule still works and why traders can absolutely continue to follow it. I will also look at lessons from Mark Minervini, Kristjan Kullamägi, Dan Zanger, and Bruce Kovner for traders who choose to pursue exceptional market leaders that fall outside O’Neil’s traditional framework. We will examine how tighter entries, technical stops, position sizing, Opening Range Breakouts, and staggered stops can help manage risk and maintain concentration in those situations.
The 7% to 8% Rule Is Still Foundational
I still think William O’Neil’s 7% to 8% rule is one of the greatest risk management principles ever created, and I absolutely still use it as the foundation for how I think about risk.
The purpose of the rule is simple. Never allow a small, manageable loss to turn into a large, portfolio-damaging loss.
That principle is timeless.
At the same time, many of today’s market leaders have large ADRs and ATRs. You can still have a very good setup where price tightens, volume dries up, and demand comes in on the breakout, but because some of these stocks naturally move more, the logical technical stop below the handle or recent support may be 10%, 11%, or even 12% away instead of fitting neatly within O’Neil’s 7% to 8% guideline.
I do not want to put words in O’Neil’s mouth because he is no longer with us. Based on his books and interviews, I think it is fair to say he strongly believed in the 7% to 8% rule and preferred buying setups that naturally fit within that framework.
Whether O’Neil would have modified or changed his 7% to 8% rule for some of today’s higher-volatility leaders is something none of us can know with certainty. However, because he traded highly volatile stocks during periods such as 1999 and early 2000, it seems more likely that he would have continued to apply the same framework rather than materially change it.
Why I Still Prefer Tighter Stops
Personally, I try to stay as close to O’Neil’s principles as possible because I believe tighter risk allows for greater concentration.
If I can find two equally good setups, I will almost always choose the one where my technical stop is 6% to 8% away rather than 12%.
I may still only be risking 1% or 2% of my account either way because position sizing controls my total account risk. However, the tighter stop allows me to own a larger position.
If the trade works, it can have a much more meaningful impact on my portfolio.
For example, assume I am willing to risk $1,000 on a trade.
If my stop is 6% away, I can build a much larger position than I can with a 12% stop. My dollar risk remains the same, but my exposure to the winning trade is larger.
That is the real advantage of tight setups.
It is not just about taking a smaller loss. It is about creating the ability to concentrate more capital into your best ideas without increasing total account risk.
The Power of Low-Risk Entries
That is something Mark Minervini has emphasized for years.
He looks for tight, low-risk entry points because they allow for larger position sizes. The smaller the distance between the entry and the logical stop, the more concentrated the position can be while keeping account risk controlled.
Kristjan Kullamägi does something similar with many of his Opening Range Breakout entries. His technical stop might only be 2%, 3%, or 4% away, allowing him to size much larger while still keeping his total account risk constant.
That is a major advantage when the trade works.
A 15% position that gains 30% has a much larger effect on the portfolio than a 7% position that gains the same amount.
Both trades may have carried the exact same initial account risk. The difference came from the distance to the stop.
What I Do When the Proper Stop Is Wider Than 8%
That said, I have not ignored exceptional leaders simply because the proper technical stop was wider than 8%.
I have taken trades where the only logical stop was around 10% to 12% away.
One example for me was SNDK. The chart told me where the stop belonged, so I simply reduced my position size. My total account risk stayed exactly the same.
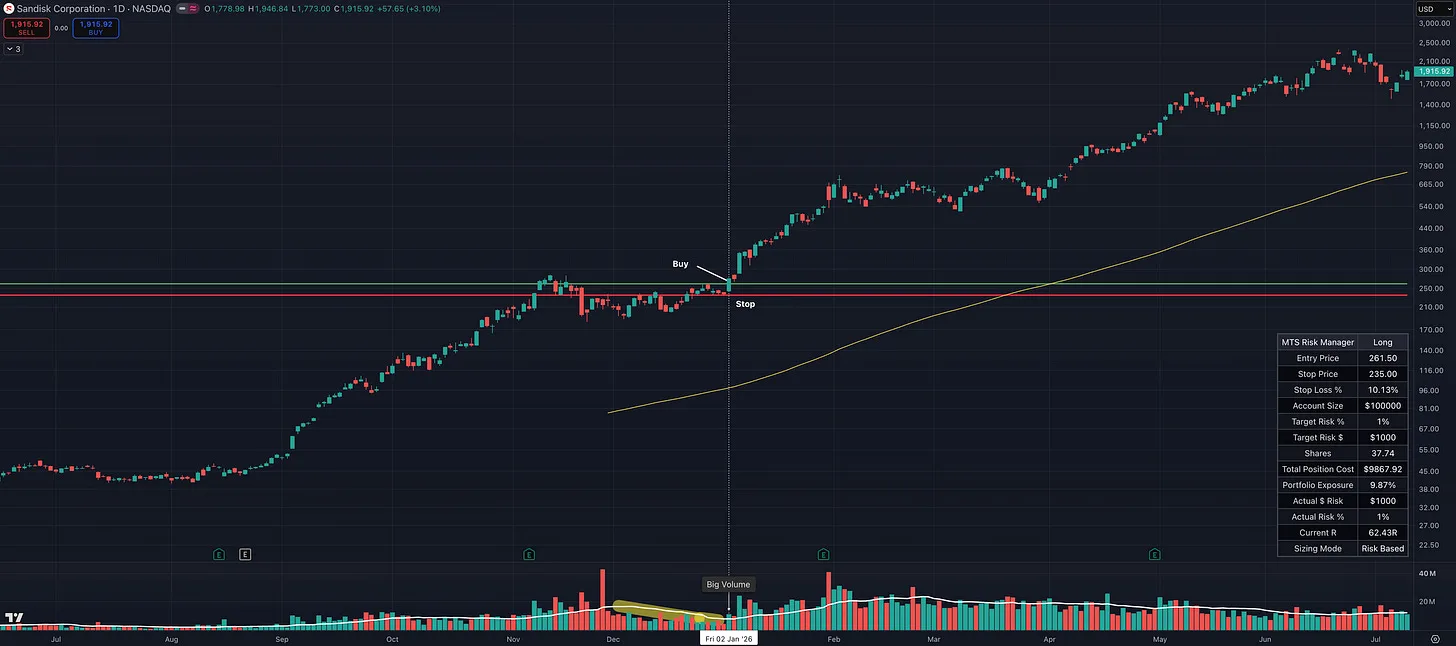
SNDK offered a good setup, but the logical technical stop was approximately 10.1% below the entry. I reduced my position size so the trade still represented only 1% account risk.
I also could have used some of the other tactics I teach to create a tighter entry, such as an intraday Opening Range Breakout, placing the stop at the low of the day, or another lower-risk entry technique.
Those approaches can sometimes bring the stop closer to the 7-8% range, but they will not always be available.
Sometimes the chart provides a clean, tight entry.
Sometimes it does not.
When it does not, you have four choices:
- Reduce your position size.
- Use a more precise entry technique.
- Wait for another setup.
- Pass on the trade.
All four are valid.
What is not valid is forcing an 8% stop into the middle of normal price action simply because you want the trade to fit a rule.
The Chart Determines the Stop
This philosophy is very similar to what Bruce Kovner said in Market Wizards:
“Whenever I enter a position, I have a predetermined stop. That’s the only way I can sleep. I know where I’m getting out before I get in. The position size on the trade is determined by the stop, and the stop is determined on a technical basis... I always place my stop beyond some technical barrier.”
That quote has always resonated with me.
The stop should be placed where the trade thesis is invalidated, not at a random percentage that happens to be convenient.
If the stock is trading inside a range, placing your stop inside that same range may simply guarantee that normal volatility takes you out.
The chart should tell you where you are wrong.
Then position sizing tells you how many shares you can own.
That is why this is one of the most important principles in my entire process:
The chart determines the stop. The stop determines the position size. The position size determines my account risk.
O’Neil Created a Framework Investors Could Follow
Although How to Make Money in Stocks has become foundational reading for many professional traders, I also think one of O’Neil’s greatest strengths was creating a simple, repeatable framework that investors could actually follow with discipline.
That is very different from saying it is the only way to trade successfully.
O’Neil gave traders a complete structure:
- What types of companies to look for
- What strong earnings and sales growth look like
- How institutional accumulation appears on a chart
- How to identify proper bases
- Where to buy
- When to sell
- Where to add
- How to keep losses small
For the broad investing public, simple and repeatable rules are incredibly valuable.
Most investors do not fail because their rules are too strict. They fail because they have no rules at all, or they constantly change them based on emotion.
Earn the Right to Adapt the Rules
For me, learning from O’Neil, Minervini, David Ryan, Dan Zanger, Bruce Kovner, and many other great traders has been incredibly valuable.
But eventually, every trader has to build a process that fits their personality and has statistical evidence behind it.
The key is not changing rules simply because you think you know better.
The key is changing them only after you have:
- Backtested the idea
- Forward-tested it in live markets
- Journaled the results
- Reviewed a large sample of trades
- Proven that the adjustment still produces positive expectancy
Most newer traders do not have that data yet. That is why I generally recommend staying very close to O’Neil’s original framework until you have earned the right to make adjustments.
You should not break a proven rule because one trade looks exciting.
You should adapt a rule only when your own data shows that the adjustment improves your process over many trades.
There Are Still Plenty of Sub-8% Setups
It is also important to remember that there are still plenty of great leaders that provide excellent entries with technical stops under 8%.
You may simply need to be more patient and selective.
NVDA in 2024 had an excellent VCP-style setup that many of us were discussing at the time. It was not a secret. The stock offered a logical entry with a technical stop comfortably inside O’Neil’s framework.
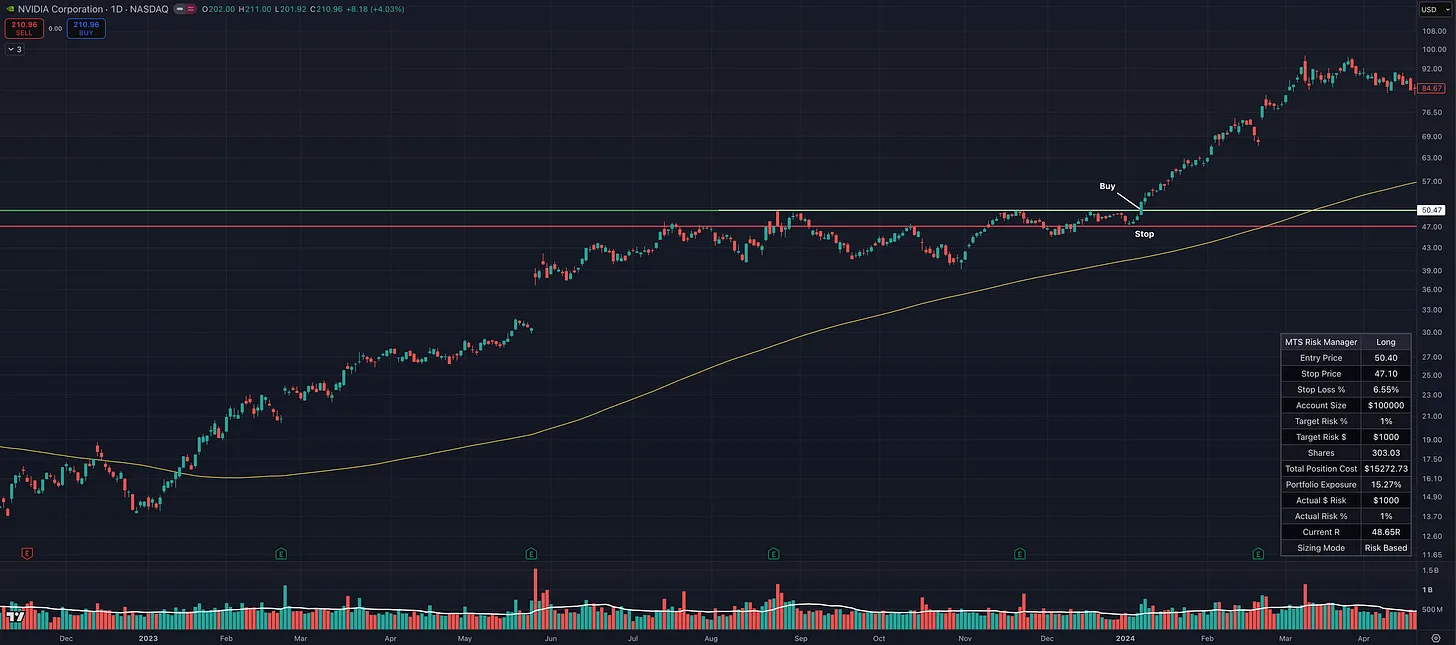
NVDA offered an entry near $50.40 with a logical technical stop near $47.10, representing approximately 6.6% risk from the entry.
WDC in 2025 provided several strong entries with stops under 8%. It also had many of the CAN SLIM characteristics we want to see, including strong earnings and sales growth.
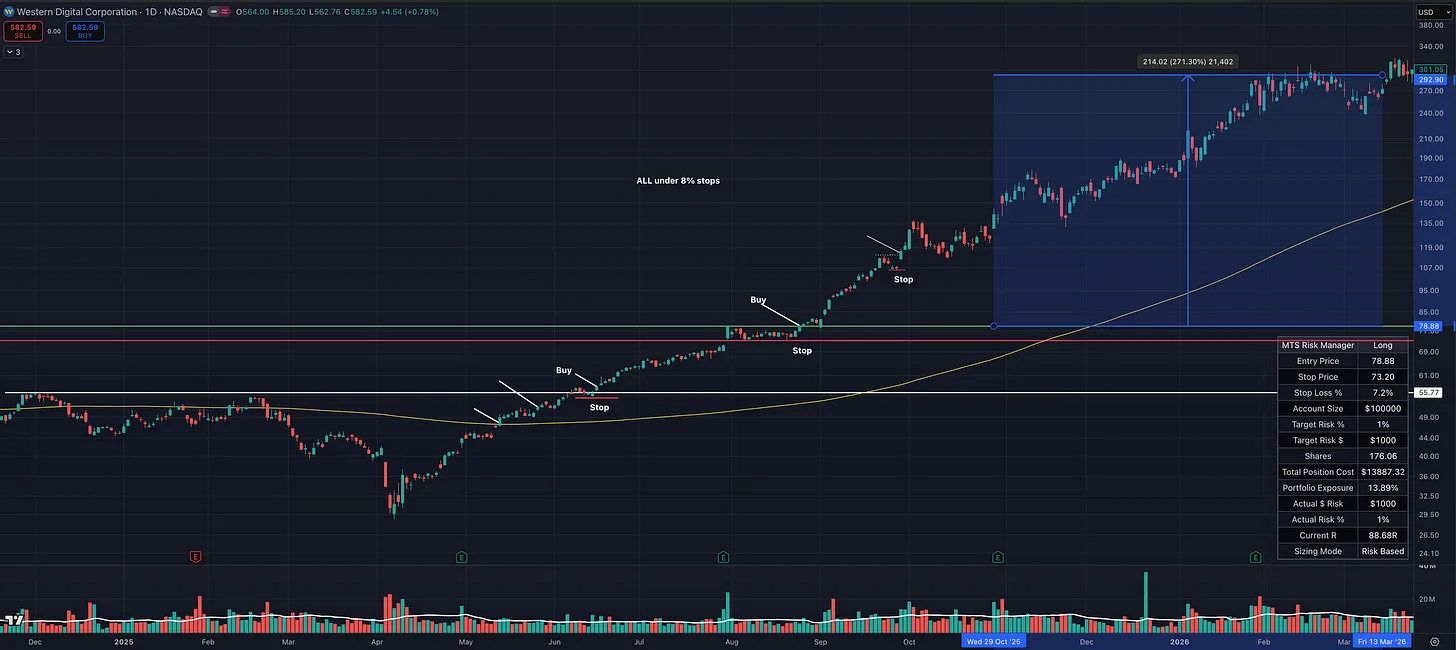
WDC produced multiple low-risk entries during its advance. The example shown uses an entry near $78.88 and a technical stop near $73.20, representing approximately 7.2% risk.
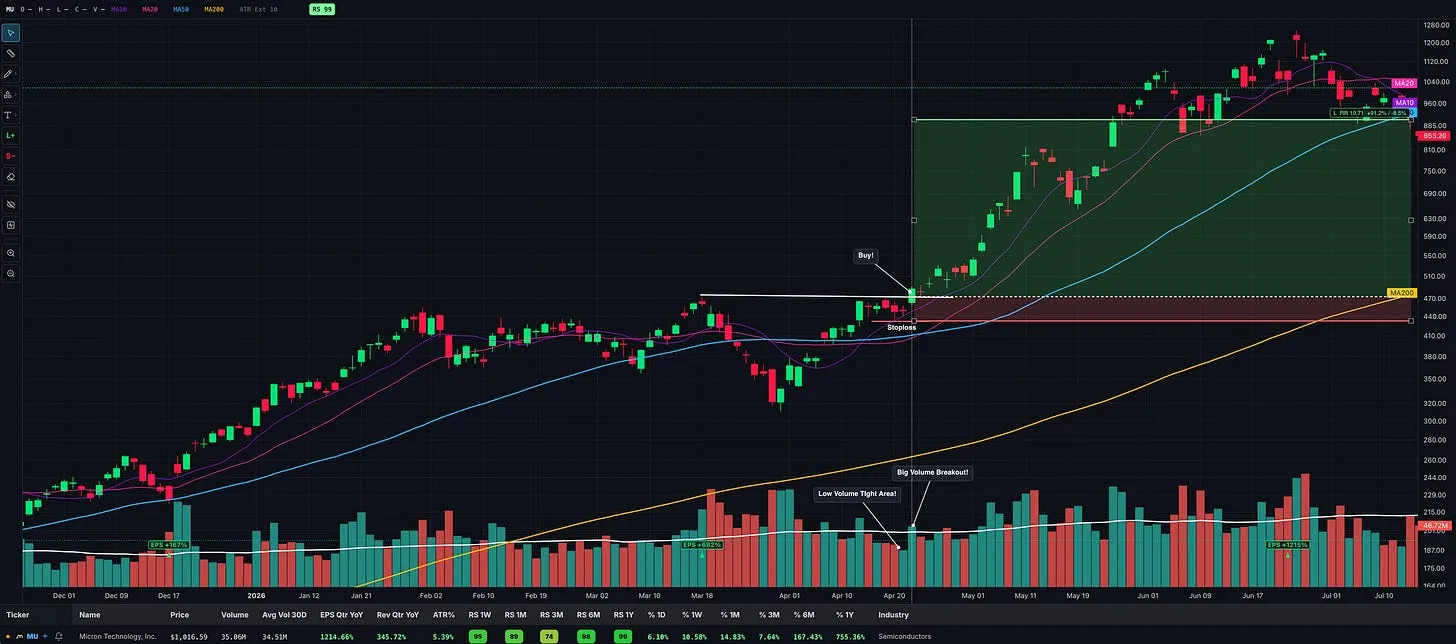
MU’s April 22, 2026 cup-with-handle-type setup was another excellent example. The entry and logical stop allowed the trade to remain within the traditional 7% to 8% risk framework.
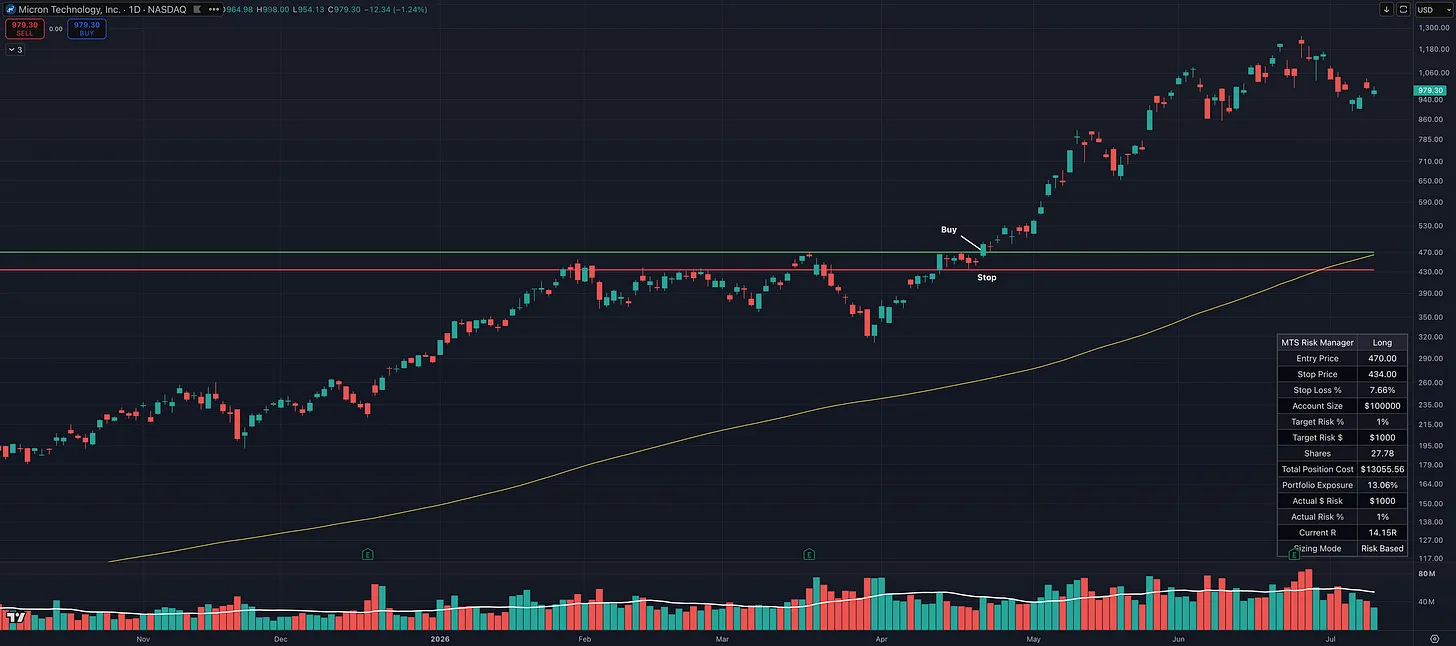
MU’s April 2026 setup offered an entry near $470 with a logical technical stop near $434, representing approximately 7.7% risk.
Those are exactly the types of setups I prefer.
They combine:
- Strong growth fundamentals
- Leadership
- Constructive price action
- Tight risk
- The ability to build meaningful concentration
Taken together, these charts show both sides of the discussion.
MU, WDC, and NVDA demonstrate that great leaders can still provide entries with technical stops comfortably under 8%.
SNDK demonstrates that an exceptional leader can also present a quality setup where the logical stop falls outside that threshold.
Qualcomm in 1999: Volatility Is Not New
Even I began to wonder whether some of today’s leading stocks are simply more volatile than the market leaders of the past. Many current leaders have larger ADR and ATR percentages, and their price bars can make a traditional 7% to 8% stop appear difficult to use.
Then I thought about a point David Ryan has made: “there is nothing new under the sun.”
The entire purpose of William O’Neil’s historical research was to study the greatest winning stocks across different market cycles and identify the characteristics that continued to repeat. The companies, industries, and technology may change, but human behavior and the relationship between price, volume, supply, and demand remain remarkably consistent.
That led me back to Qualcomm in 1999, one of the historic market leaders featured in O’Neil’s work.
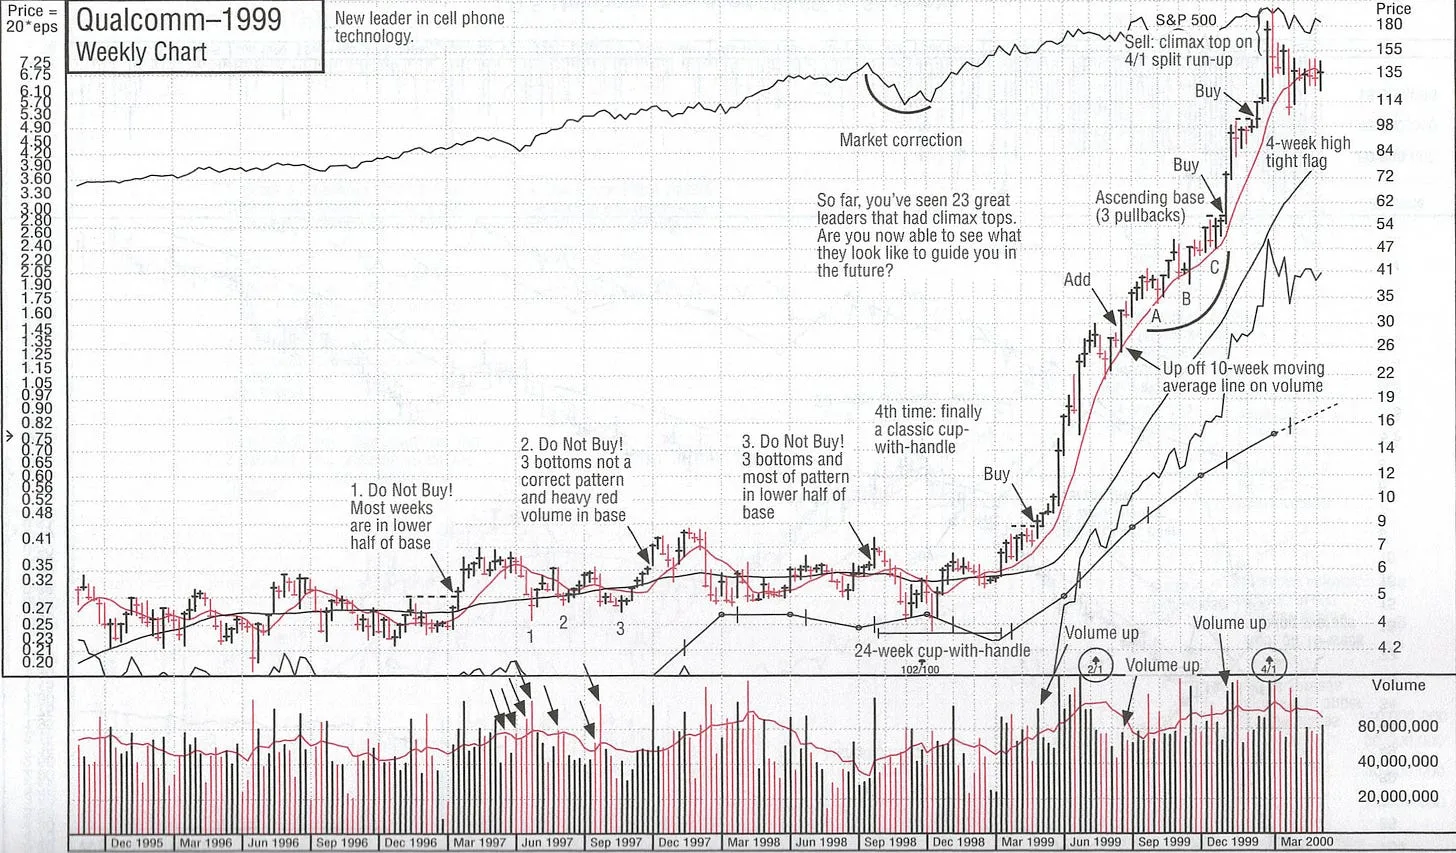
William O’Neil’s Qualcomm chart identifies the breakout and buy point during the stock’s historic 1999 advance. The chart shows the buy, but it does not disclose the exact stop he used.
When I recreated the setup using historical data, I found something interesting. If the stop were placed below the most recent higher low, where many traders might consider placing a standard technical stop, the distance from the entry would have been approximately 10.1%.
That would have fallen outside O’Neil’s traditional 7% to 8% guideline.
However, we do not know where O’Neil actually placed his stop because his chart only identifies the buy point. It would therefore be a mistake to claim with certainty that he used the wider technical level.
Another valid approach would have been to place the stop at the low of the breakout day. From the approximate $4.37 entry, that stop would have been near $4.10, representing roughly 6.2% risk and fitting comfortably within O’Neil’s framework.
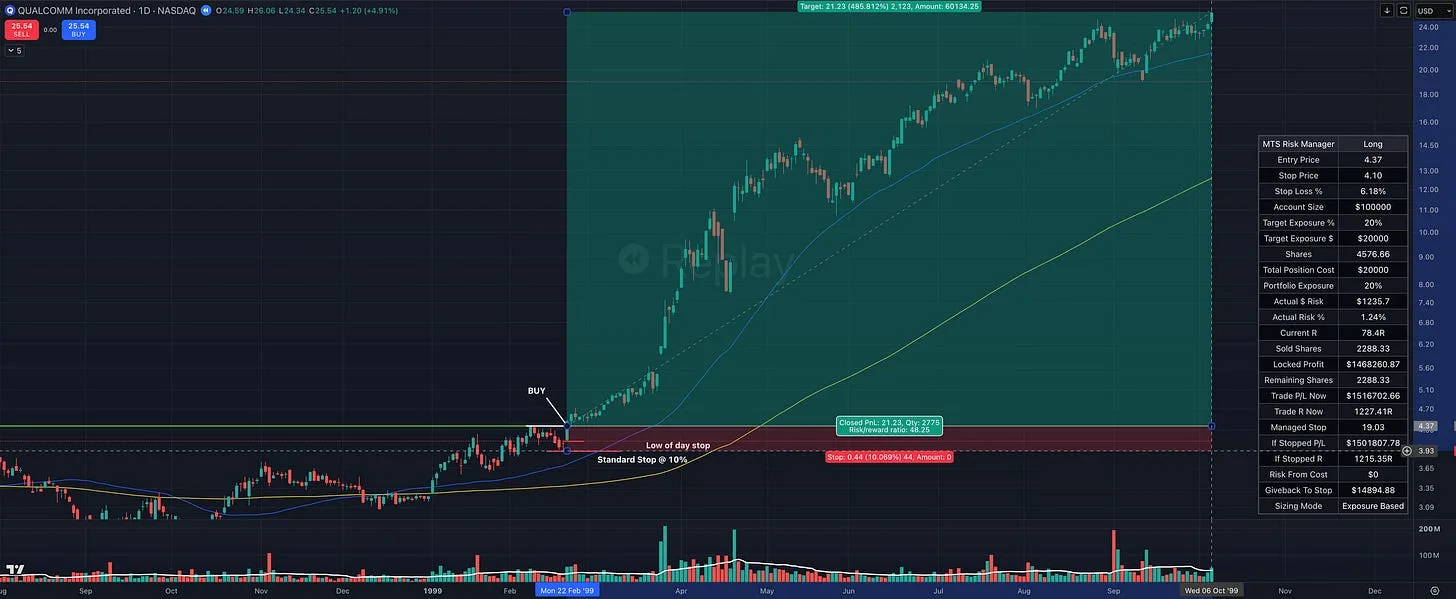
Using the prior higher low as the stop would have created approximately 10.1% risk. Using the low of the high-volume breakout day would have reduced the risk to approximately 6.2%.
This is similar in spirit to the low-of-day risk management used by traders such as Dan Zanger and Kristjan Kullamägi, although it does not necessarily require using an Opening Range Breakout (ORB) entry.
After Qualcomm broke out, the stock never returned to the original entry area and went on to produce an extraordinary advance. The price action was also highly volatile. The weekly bars do not look materially different from many of the powerful, fast-moving market leaders we see today.
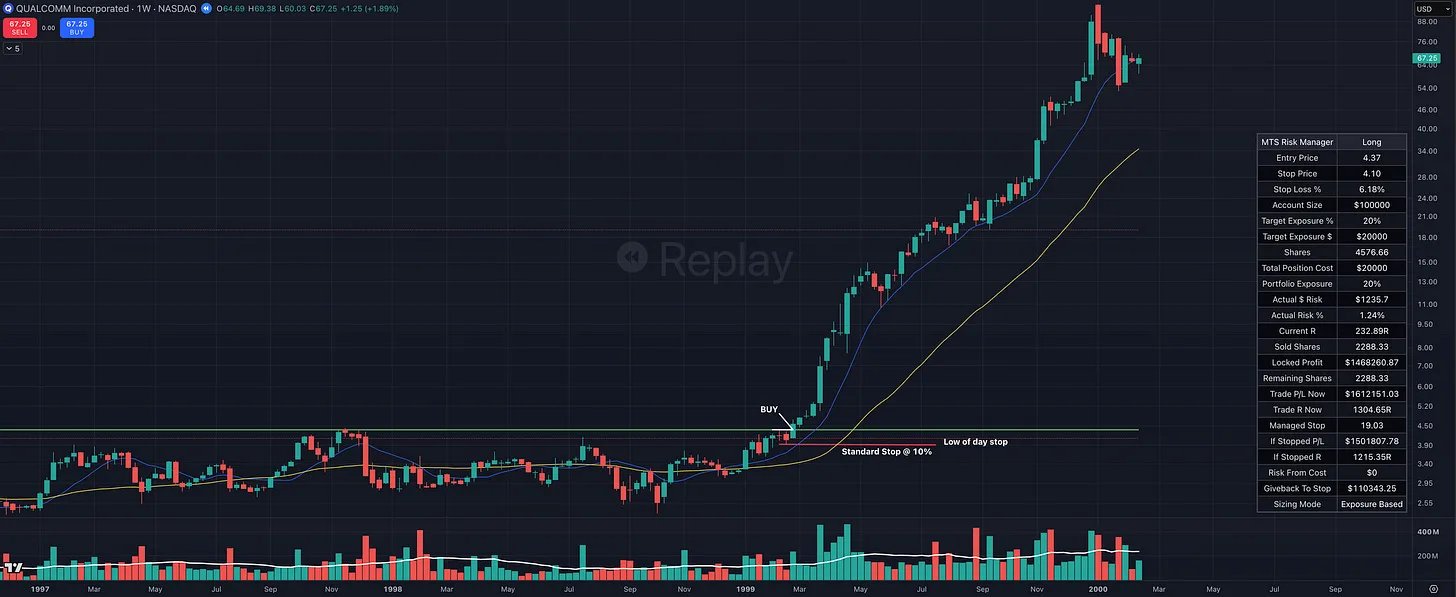
Qualcomm’s 1999 advance demonstrates that powerful market leaders with significant volatility are not unique to the current market.
The lesson is not that O’Neil ignored his own rule. We do not know his exact stop, and I do not want to put words in his mouth.
The lesson is that volatility is not new. Stocks with wide price swings and explosive advances existed during O’Neil’s era as well. Qualcomm also demonstrates how a more precise technical stop, such as the low of the breakout day, could have allowed a trader to participate while still remaining within the traditional 7% to 8% framework.
In many ways, this strengthens the case for O’Neil’s rule rather than weakening it. The solution is not always to accept a wider loss. Sometimes the solution is to improve the entry and stop location, identify a more precise technical level, reduce the position size, or wait for a setup that naturally provides tighter risk.
Another Option: Staggered Stops
One additional option is using staggered stops.
This is not something William O’Neil discussed as part of his traditional 7% to 8% framework. It is a more advanced trade-management technique that I have picked up from studying other experienced traders over the years.
Going back to the SNDK example, placing the entire position at the original technical stop below the last higher low resulted in a 10.13% stop-loss distance.
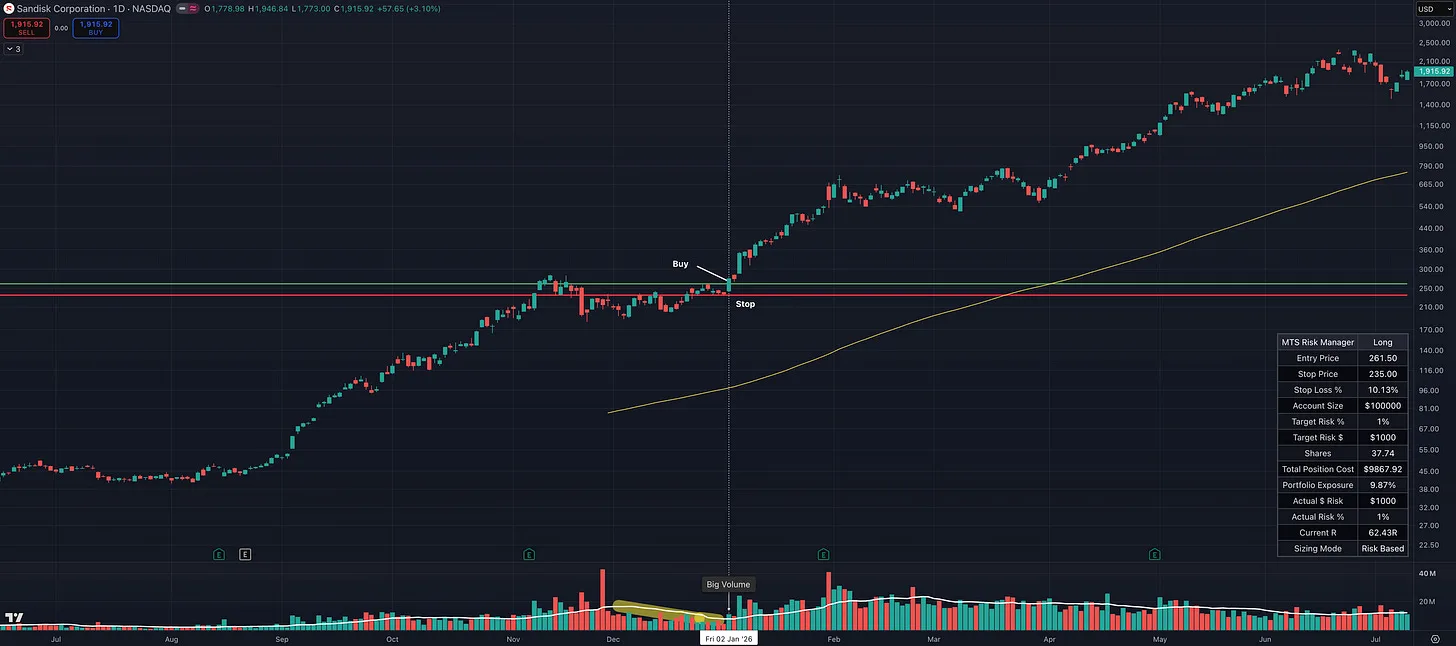
However, another approach would have been to place 50% of the shares at the low of the breakout day and the remaining 50% at the original technical stop below the last higher low.
That would have reduced the blended stop-loss percentage from 10.13% to approximately 8.32%, bringing the overall risk much closer to O’Neil’s traditional guideline.
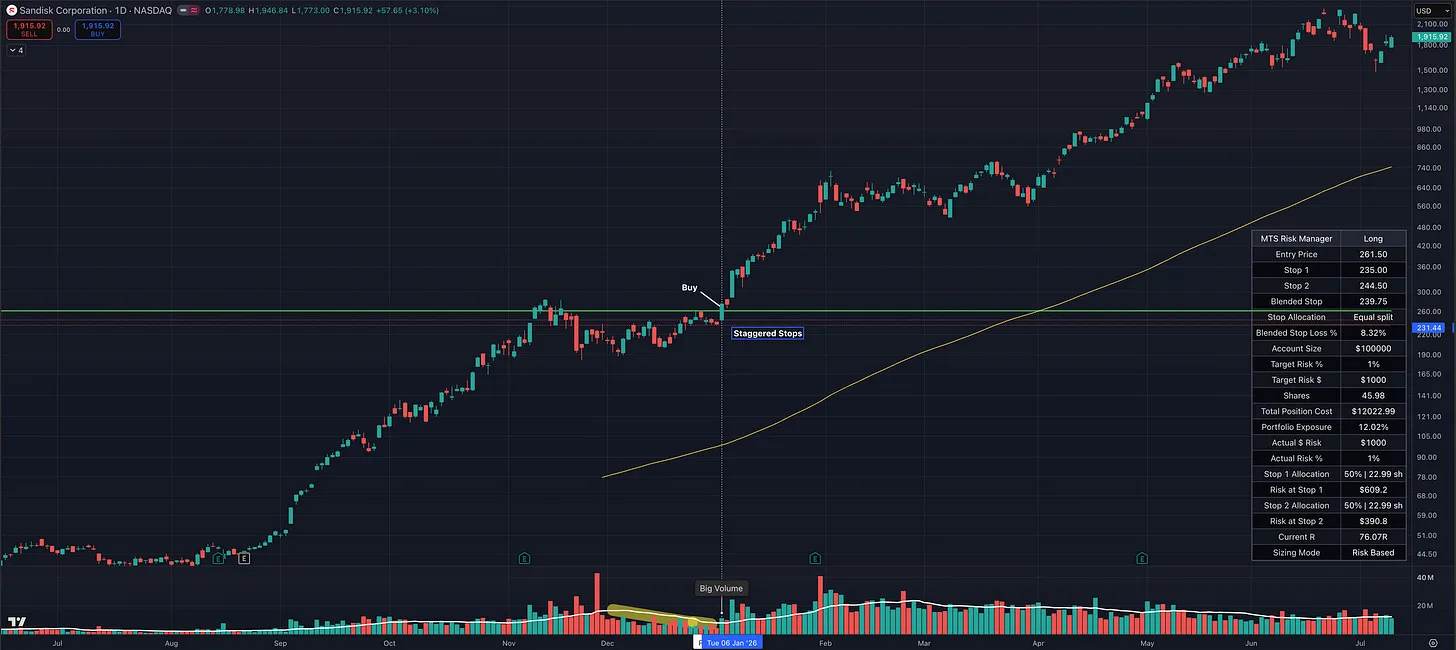
Because the blended stop was tighter, I also could have increased my position size and gained more exposure to the trade while keeping my total account risk exactly the same.
This does not mean the trade suddenly becomes safer or that the chart should be ignored. It simply means that the position is being managed across two technically valid exit levels rather than placing every share at the widest stop.
Another possibility, for someone who was available to follow the stock intraday, would have been to use a Dan Zanger or Kristjan Kullamägi-style Opening Range Breakout entry. A five-minute Opening Range Breakout entry could have produced a stop of approximately 3.3% using the low of the day. A 30-minute Opening Range Breakout entry could have produced approximately 7.38% risk with a single stop at the low of the day.
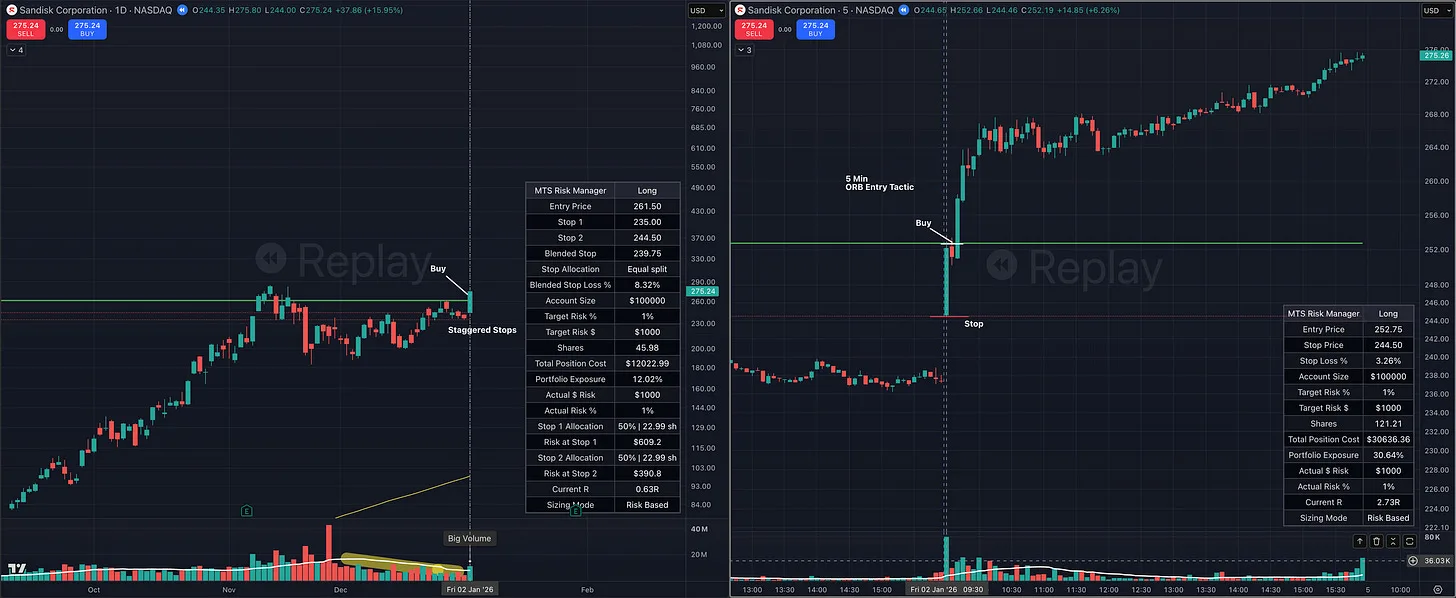
These are more advanced techniques that require additional screen time, experience, preparation, and discipline. I cover them in the course, but I do not discuss them as frequently because they may not fit most traders’ experience levels, schedules, or lifestyles.
Final Thoughts
My preference is simple.
I favor stocks that naturally fit O’Neil’s framework because tighter risk allows for greater concentration.
But…. when an exceptional market leader requires a slightly wider technical stop, I am comfortable reducing my position size rather than forcing an arbitrary stop that sits in the middle of normal price action.
There are still plenty of outstanding leaders that provide excellent entries with stops under 8%. Sometimes you just need to be patient enough to wait for them.
Qualcomm’s 1999 advance also reminds us that highly volatile market leaders are not unique to today’s market and that a more precise entry and stop location can sometimes keep the trade within O’Neil’s framework.
When a setup falls outside that threshold, decide in advance what your rules allow.
- You can wait for another setup.
- You can use a tighter entry technique.
- You can use a tighter stop technique.
- You can reduce position size.
- Or you can pass.
You do not have to swing at every pitch.
But whenever you do take a trade, know where you are getting out before you get in.
The chart determines the stop. The stop determines the position size. The position size determines your account risk.
More in Legendary Traders
All Legendary Traders articles →
Sep 17, 2026 · Legendary Traders
4 Legendary Traders. 4 Breakout Entry Tactics.
A chart-by-chart breakdown of Minervini’s VCP, O’Neil’s cup with handle, Darvas’s box breakout, and Kullamägi’s opening range breakout.
- how to make money in stocks
- IBD
- Momentum Trading
- VCP
- technical analysis
- CANSLIM
- Trading Setups
- position trading
Sep 6, 2026 · Legendary Traders
Market Wizard David Ryan: How He Made 1,379% in Three Years
Inside the growth-stock approach of William O’Neil’s protégé and three-time U.S. Investing Champion, from precise entries to holding major winners.
- IBD
- fundamental analysis
- Learn Trading
- technical analysis
- position trading
- David Ryan
- Market Wizard
- CAN SLIM
Aug 29, 2026 · Legendary Traders
Why the Market’s Biggest Winning Stocks Rarely Move Alone
Lessons from Nicolas Darvas, William O’Neil, and Mark Minervini on using industry-group strength and relative strength to find new market leaders without getting whipsawed.
- growth stocks
- CANSLIM
- position trading
- David Ryan
- stock trading
- Kristjan Kullamägi
- Nicolas Darvas
- industry groups