
Trading articles/The Volume You’re Watching Isn’t the Full Story
Dec 19, 2025 · Momentum Trading Strategy
The Volume You’re Watching Isn’t the Full Story
Why futures offer a cleaner volume picture, why stocks can look misleading intraday, and what traders should actually do with that information
Originally published on Substack.
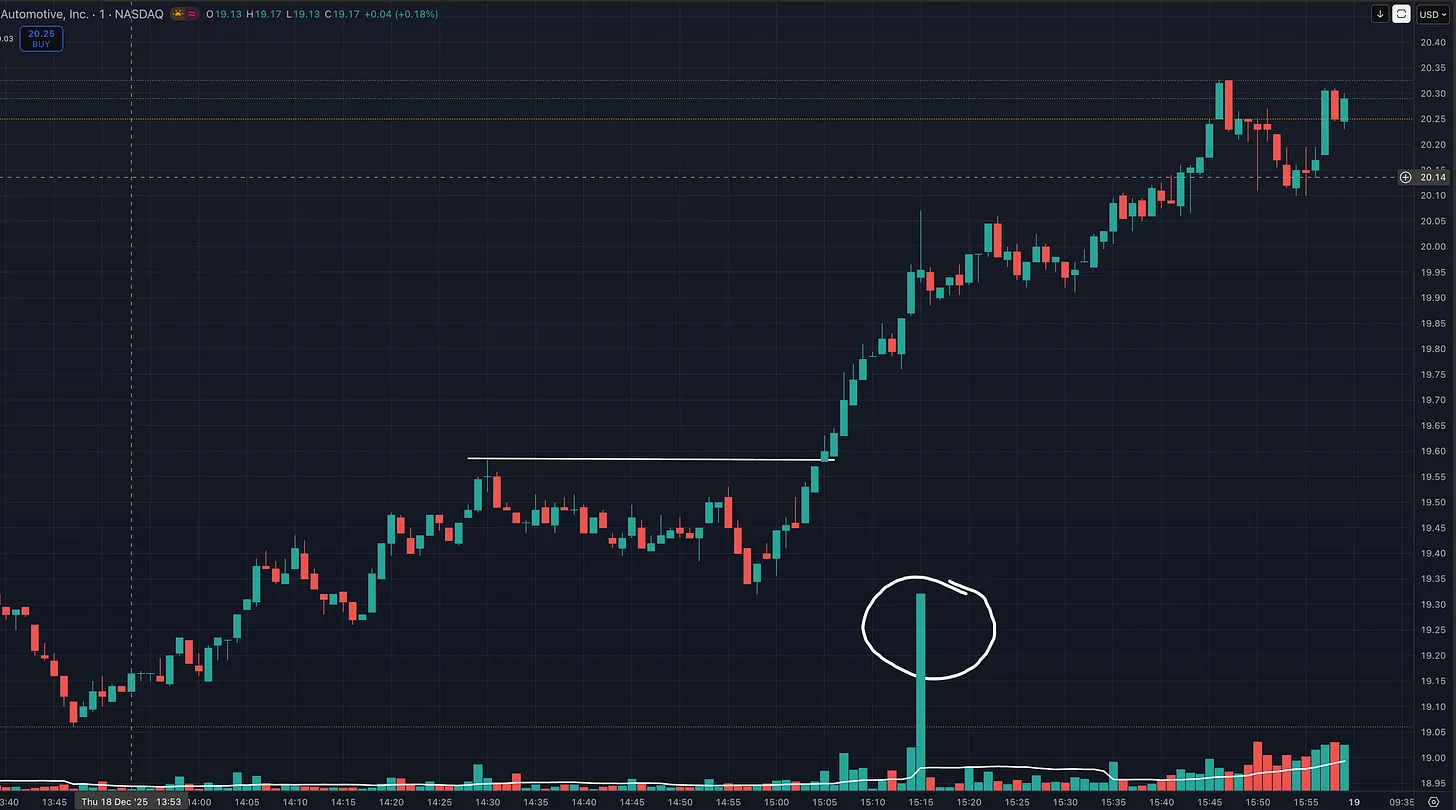
Here is something that quietly trips up a lot of smart traders.
And if you have been trading long enough, you have probably experienced this exact moment.
Price moves fast.
You check volume.
It looks weak.
You hesitate.
Then price keeps going without you.
Later, volume expands dramatically. Maybe a large print appears. Maybe you look back at the chart and the volume bar does not look exactly the way you remember it in real time.
So what happened?
Was institutional volume hidden? Did a dark pool cause the move? Was your chart wrong?
Maybe none of those things.
The real answer comes down to understanding the difference between volume, liquidity, and market structure.
And stocks and futures handle those things very differently.
Futures First: A More Centralized View
Futures markets are generally much more centralized than U.S. equities.
When you trade contracts like ES, NQ, MNQ, CL, or GC during normal electronic trading, activity is concentrated around the exchange’s central matching engine.
That gives futures traders a very coherent view of what is happening in that contract.
You can see:
- Executed volume
- Time and sales
- Displayed bids and offers
- Changes in liquidity
- Volume at specific prices
- Aggressive buying and selling
This is one reason tools like DOM, footprint charts, volume profile, and order flow can be so powerful in futures.
If ES pushes through a major level on expanding volume and aggressive buying, that tells you something.
If price pulls back on declining volume, that can tell you something too.
For an intraday futures trader, volume is one of the cleanest real-time measures of participation available.
But even futures are not perfectly transparent.
Iceberg orders can hide reserve size. Traders can pull orders before they execute. CME also allows qualifying block trades to occur away from the central limit order book, with specific reporting requirements depending on the contract.
So I would not say:
Every futures trade is instantly visible.
The better way to say it is:
Futures provide a highly centralized view of normal on-screen trading activity.
That is a major advantage, but it is not perfect visibility into every participant’s intentions.
Stocks Are Different
Stocks do not trade through one centralized order book.
A liquid U.S. stock may trade across:
- Nasdaq
- NYSE
- Cboe
- Other public exchanges
- Alternative Trading Systems
- Dark pools
- Wholesalers
- Market makers
- Broker internalization systems
- Other off-exchange venues
This is where things get interesting.
The public order book does not show every potential buyer and seller in the market.
You may not be able to see:
- Resting dark-pool orders
- Liquidity held by an internalizing market maker
- The full reserve behind an iceberg order
- Undisplayed liquidity on another venue
- Orders that are about to be canceled, repriced, or moved
So when you look at Level 2 on a stock, you are looking at useful information.
But you are not looking at the entire market.
You are seeing part of the liquidity picture, not all of it.
Dark Pools: What Is Actually Hidden?
This is probably one of the most misunderstood parts of stock trading.
Dark pools are dark primarily because their resting orders are not publicly displayed before execution.
An institution could be willing to buy a significant amount of stock without showing that entire order on the public book.
That is hidden liquidity.
But once a trade actually occurs, the situation changes.
For listed U.S. equities, off-exchange executions, including ATS transactions, are generally reported through FINRA’s reporting facilities and disseminated into consolidated market data.
FINRA generally requires eligible NMS stock transactions to be reported as soon as practicable and no later than 10 seconds after execution during applicable reporting hours.
So the important distinction is:
Dark-pool liquidity can be hidden before the trade.
The completed trade is generally reported shortly after execution.
That means the idea that massive amounts of ordinary dark-pool volume routinely remain completely invisible for several minutes is not accurate.
Internalization Works the Same Way
Internalization happens when a wholesaler or market maker fills an order without sending it to a public exchange.
Again, that liquidity was not sitting there for you to see on the Nasdaq or NYSE order book beforehand.
But once the trade occurs, reportable off-exchange executions are generally reported through FINRA and disseminated into consolidated market data.
This is why I would not say:
Off-exchange volume is hidden.
I would say:
Off-exchange liquidity is hidden before execution, while completed reportable trades are generally disseminated shortly after they occur.
That is a much more accurate way to think about it.
Iceberg Orders Are Another Good Example
Imagine an institution wants to buy 1 million shares.
It may only display 10,000 shares at a time.
You look at Level 2 and see a 10,000-share bid.
But there could be substantially more demand sitting behind it.
That is important information you do not have.
What is hidden is the true size and intention of the order.
As those shares actually execute, however, those transactions contribute to reported volume.
So once again:
Hidden liquidity does not mean hidden executed volume.
Then Why Have I Seen Stock Volume Change Intraday?
This is where traders sometimes get confused, because this phenomenon is real.
I have personally watched stocks intraday and seen volume look one way in real time, only to come back later and see the numbers or individual bars look different.
That can happen.
The important thing is understanding why.
The consolidated stock tape supports things like:
- Late reports
- Trade corrections
- Trade cancellations
- Out-of-sequence transactions
- Prior-reference-price trades
- Extended-hours transactions
- Different trade-condition classifications
Your charting platform also has to decide how to process that information and which trades get assigned to which bars.
So an intraday volume bar is not necessarily an immutable number the instant you first see it.
A trade may be corrected.
A previous transaction may be canceled.
A late or out-of-sequence report may appear.
Your data provider may process certain trade conditions differently.
That is real.
What we cannot automatically conclude is:
“That big print was institutional buying from five minutes ago that was hidden in a dark pool.”
Maybe it was related to earlier activity. Maybe it wasn’t.
The chart alone does not give us enough information to make that conclusion.
Why Price Can Move Before Volume Looks Impressive
This is the part that matters to traders.
A stock does not need enormous volume to begin moving.
Price moves because the available supply and demand at each price level changes.
Maybe liquidity above the breakout is thin.
Maybe sellers pull their offers.
Maybe buyers start aggressively lifting offers.
Maybe hidden reserve liquidity is being consumed.
Maybe the stock is repricing after news, a sector move, or a broader market move.
Or maybe participation simply begins modestly and accelerates as more traders recognize what is happening.
That last one is especially important.
Imagine a stock has a pivot at $100.
It breaks $100.
Volume is decent, but nothing spectacular.
The stock pushes to $101.
Then $102.
Now more traders recognize the breakout.
Momentum traders enter.
Institutions continue participating.
The move starts attracting attention.
By the afternoon, volume is running well above normal.
Nothing needed to be secretly hidden during the first few minutes.
Participation simply increased as the move developed.
So Does Breakout Volume Matter?
Absolutely.
I would still rather see a stock blast through a major breakout level on huge relative volume than barely creep through it on weak participation.
That additional volume gives me evidence that real demand is supporting the move.
But this is where traders can become too rigid.
If your rule is:
“I will never buy a breakout unless massive volume is present at the exact moment price crosses the pivot.”
you are going to miss some legitimate moves.
That does not make the rule wrong if it works for you.
It simply means there is a tradeoff.
Personally, I want volume confirmation.
But I am also looking at:
- Price structure
- Relative strength
- Industry group strength
- Overall market conditions
- Quality of the setup
- Whether price holds above the breakout
- Whether participation expands
- How the stock is trading relative to its normal volume at that exact time of day
Volume is part of the evidence.
It is not the only evidence.
Time of Day Matters More Than Most Traders Realize
This is another common mistake.
Suppose a stock normally trades 10 million shares per day.
At 10:00 a.m. it has traded 2 million shares.
Is that strong volume?
You cannot answer that from the full-day average alone.
Maybe the stock normally trades only 800,000 shares by 10:00 a.m.
If so, today’s participation is extremely strong.
But maybe the stock normally trades 3 million shares by 10:00 a.m.
Now today’s volume is actually running below normal.
That is why I prefer thinking in terms of relative volume for that point in the trading session.
You want to know:
How much volume should this stock normally have traded by now?
Then compare today’s participation against that.
That tells you far more than simply comparing current volume against the stock’s average full-day volume.
What This Means for Day Traders
This market-structure difference matters the most to day traders.
With futures like ES and NQ, the centralized market makes real-time volume, DOM, time and sales, footprint charts, and order flow extremely useful.
With stocks, those tools still work.
But you have to remember that Level 2 is not showing you every piece of available liquidity across the entire U.S. equity market.
That does not mean:
Ignore volume.
It means:
Understand what the data is actually showing you.
For stocks, I would combine volume with price structure, relative strength, spreads, sector action, market context, and whether the move is being accepted or rejected.
What This Means for Swing Traders
For a swing trader, a few seconds of reporting differences matter much less.
I care far more about the larger picture.
Is the stock breaking out?
Is relative strength strong?
Is volume expanding?
Does price hold the breakout?
Was the setup tight before the move?
Is volume drying up during constructive pullbacks?
Are buyers showing up when the stock advances?
Is the industry group leading?
That is the information I care about.
A breakout on modest initial volume is not automatically invalid.
But if another stock breaks out from an equally good setup with massive relative volume, I am going to view that additional participation as stronger confirmation.
Price structure identifies the opportunity.
Volume helps me judge the quality of the move.
Position Traders Should Zoom Out Even Further
If you are trying to hold a major leader for weeks or months, an unusual five-minute volume bar probably matters very little.
Now I am looking at:
- Daily and weekly price structure
- Relative strength
- Earnings and sales growth
- Institutional sponsorship
- Industry group leadership
- Accumulation and distribution
- Volume across advances and pullbacks
- Whether the stock continues acting like a leader
The longer your timeframe, the less important a single intraday volume anomaly becomes.
The Clean Futures vs. Stocks Rule
If you remember nothing else from this article, remember this:
Futures provide a more centralized view of normal on-screen trading activity.
Stocks provide a fragmented view of liquidity before execution, while completed exchange and reportable off-exchange transactions are generally disseminated through consolidated market data shortly after execution.
In stocks, you may not see all the liquidity that exists.
You may not know every participant’s intention.
And occasional late reports, corrections, cancellations, or special trade conditions can cause the intraday volume record to look different later.
But that does not mean stock volume is fake.
And it does not mean volume analysis does not work.
Far from it.
How I Use This
If I am trading futures:
- I place more emphasis on centralized order flow.
- I pay close attention to real-time volume.
- I use DOM, time and sales, and footprint information more aggressively.
- I still remember that hidden orders and off-book transactions can exist.
If I am trading stocks:
- I let price structure lead.
- I still want volume confirmation.
- I compare volume with what is normal for that time of day.
- I understand that Level 2 is only part of the liquidity picture.
- I do not automatically reject a good breakout because huge volume has not appeared immediately.
- I watch to see whether participation expands as the move develops.
- I do not assume every large later print represents institutional accumulation.
There is a big difference between saying:
“Volume doesn’t matter.”
and saying:
“Volume needs context.”
I believe the second statement is much closer to the truth.
Final Thought
Volume remains one of the most useful tools we have as traders.
But you have to understand what it is actually measuring.
Futures give you a highly centralized view of regular electronic trading activity.
Stocks give you a fragmented view of liquidity before execution, while most completed reportable transactions are disseminated rapidly afterward.
At the same time, stock-volume data can occasionally change because of late reports, corrections, cancellations, out-of-sequence transactions, and the way your data provider handles those trades.
That explains why traders sometimes see an intraday volume bar look different later without needing to assume that huge amounts of institutional trading were secretly hidden for minutes.
For me, the trading lesson remains simple:
Strong volume is valuable confirmation.
But volume does not exist in a vacuum.
Use price structure to identify the opportunity.
Use relative strength to find the leaders.
Use volume to judge participation.
And then let the market tell you whether the move is actually working.
Trader’s Note: When Can You Trust the Daily Volume Bar?
One last point, because this comes up often.
Most of the issues discussed in this article matter most intraday, when you are making decisions from data that is still being reported and processed in real time.
For normal reportable U.S. stock transactions, FINRA requires trades to be reported as soon as practicable and generally no later than 10 seconds after execution during applicable reporting hours. Trades reported beyond that window are designated late.
That means by the time you are looking at yesterday’s daily chart, the overwhelming majority of the trading activity from that session has already been reported.
For practical trading purposes, I would treat the prior day’s daily volume as substantially complete and reliable.
Could it still change?
Yes.
The consolidated tape allows previously reported trades to be corrected, canceled, or marked as errors, and prior-day transactions can also require adjustments.
So technically, a historical volume number is not guaranteed to be permanently frozen the instant the closing bell rings.
But that is very different from saying that large amounts of normal trading volume routinely remain hidden for several days.
They do not.
So if you are analyzing a breakout on a daily or weekly chart, I would not dismiss the volume because you think a large amount of unreported institutional trading may suddenly appear three days later.
Use the volume you have.
Understand that minor revisions are possible.
And remember the bigger point:
Intraday volume can be a moving data picture. Daily and weekly volume are much more settled and should be treated as meaningful evidence of participation.
More in Strategy & Tactics
All Strategy & Tactics articles →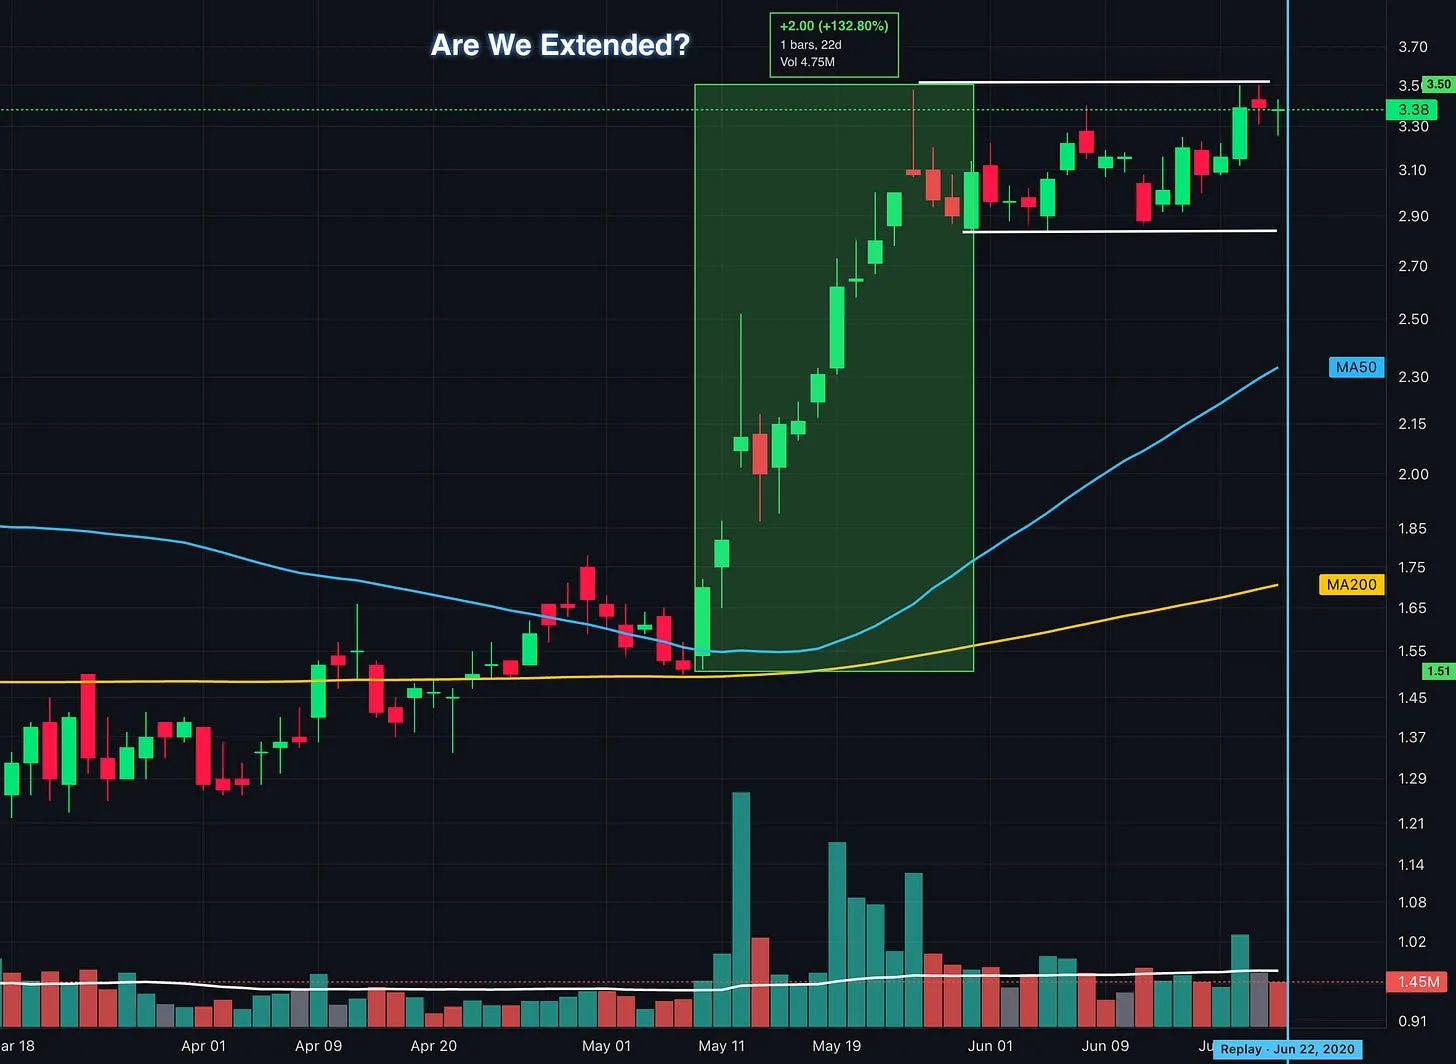
Oct 8, 2026 · Strategy & Tactics
Up 100% and Still Buyable? What Traders Get Wrong About Extended Stocks
How to identify proper buy points, avoid chasing stock breakouts, and manage entry risk using lessons from William O’Neil, Mark Minervini, David Ryan, and Dan Zanger.
- Momentum Trading
- VCP
- position trading
- Growth Stock Trading
- David Ryan
- Flag Pattern
- chart patterns
- Cup and Handle
Sep 27, 2026 · Strategy & Tactics
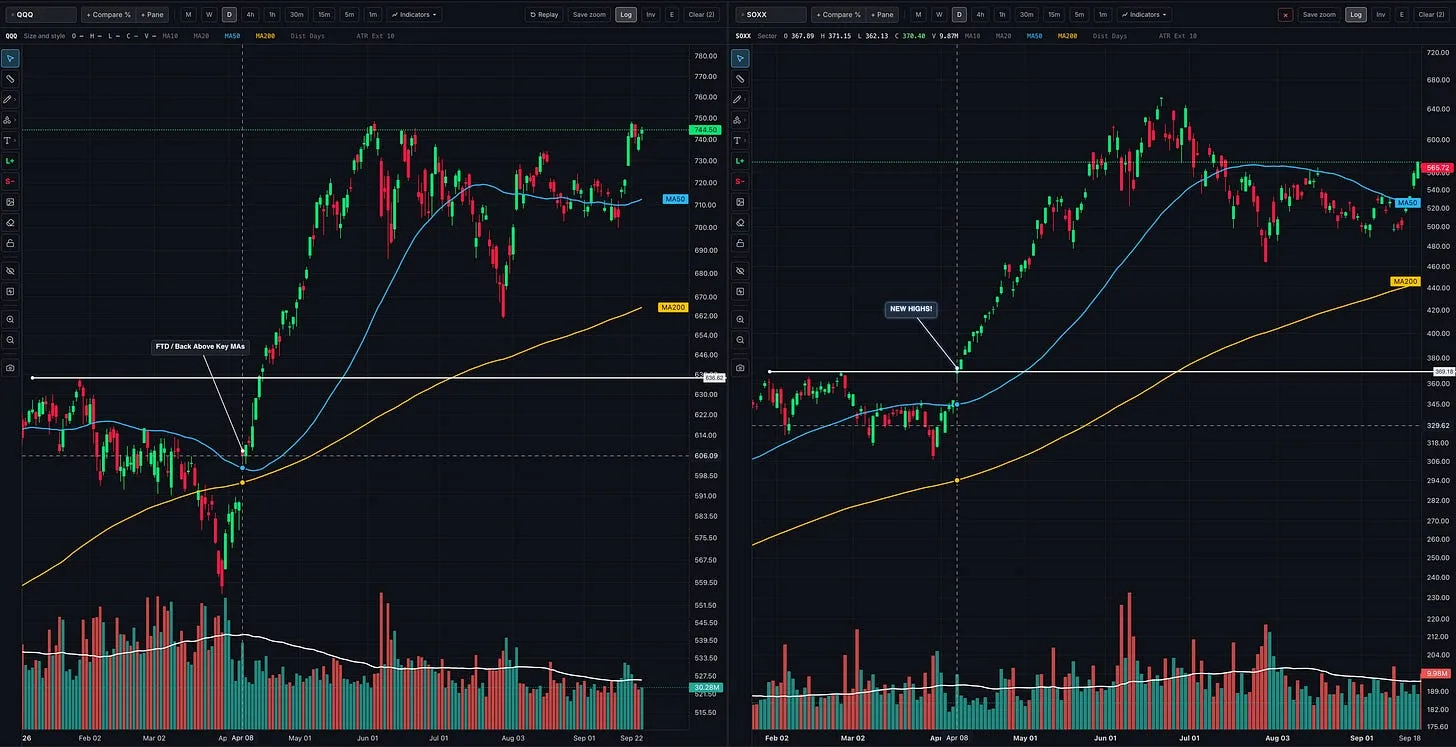
Should You Follow Leading Stocks or Wait for Market Confirmation?
How to read the market, industry groups, and individual stocks together so you can recognize opportunities, build exposure, and respond when conditions change
- growth stocks
- CANSLIM
- Trading
- position trading
- Stan Weinstein
- William O'Neil
- Momentum Trading Strategy
- Trade stocks
Sep 25, 2026 · Strategy & Tactics
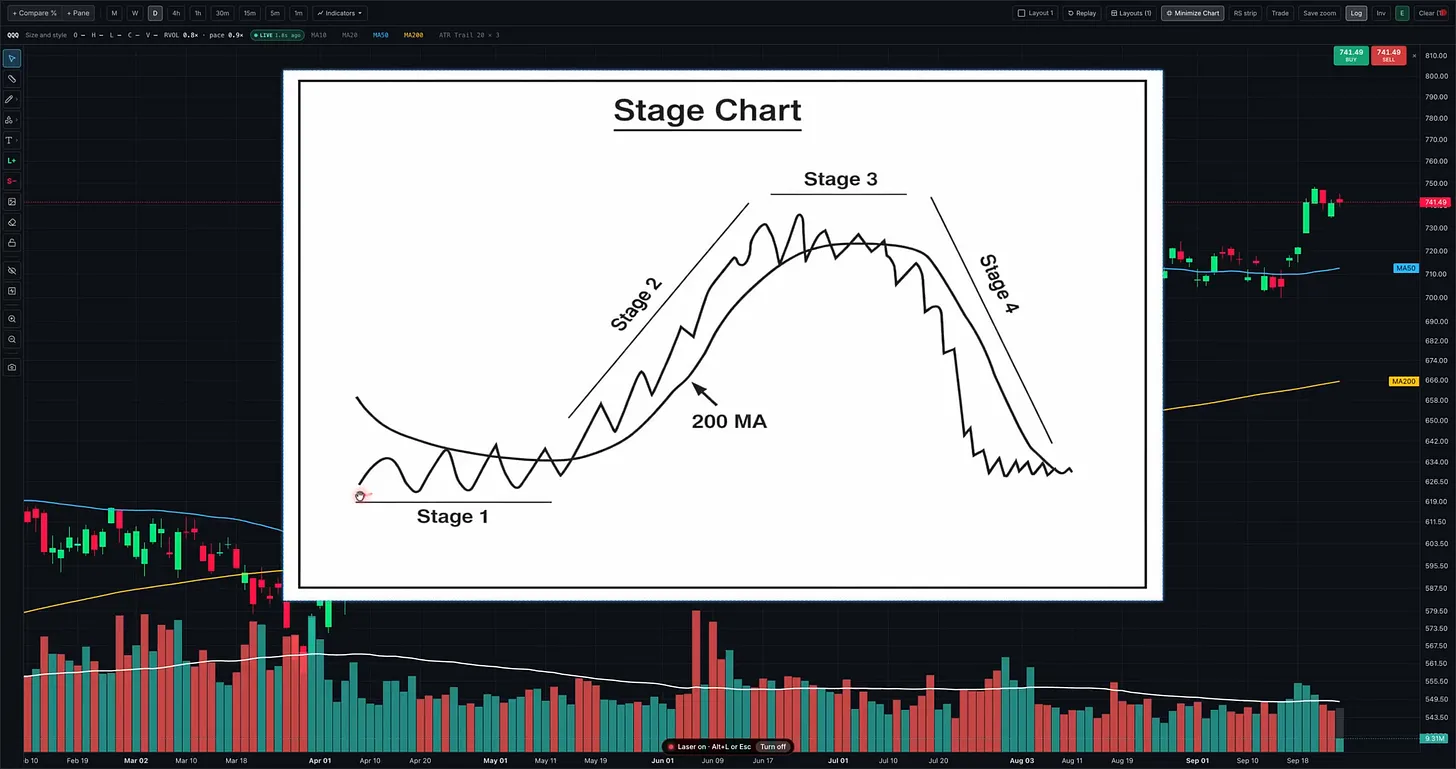
Stage Analysis: How to Spot Stage 3 in Real Time
Recognize a developing Stage 3 using Stan Weinstein’s framework, with real chart examples, warning signs, and lessons for protecting your gains
- Momentum Trading
- Nasdaq
- technical analysis
- CANSLIM
- position trading
- Stan Weinstein
- QQQ
- Find True Market Leaders