
Trading articles/A Low-Risk, High-Reward Entry Off the 50-Day
Nov 8, 2025 · Momentum Trading Strategy
A Low-Risk, High-Reward Entry Off the 50-Day
How multiple timeframes + confirmation gave a clean swing entry yesterday
Originally published on Substack.
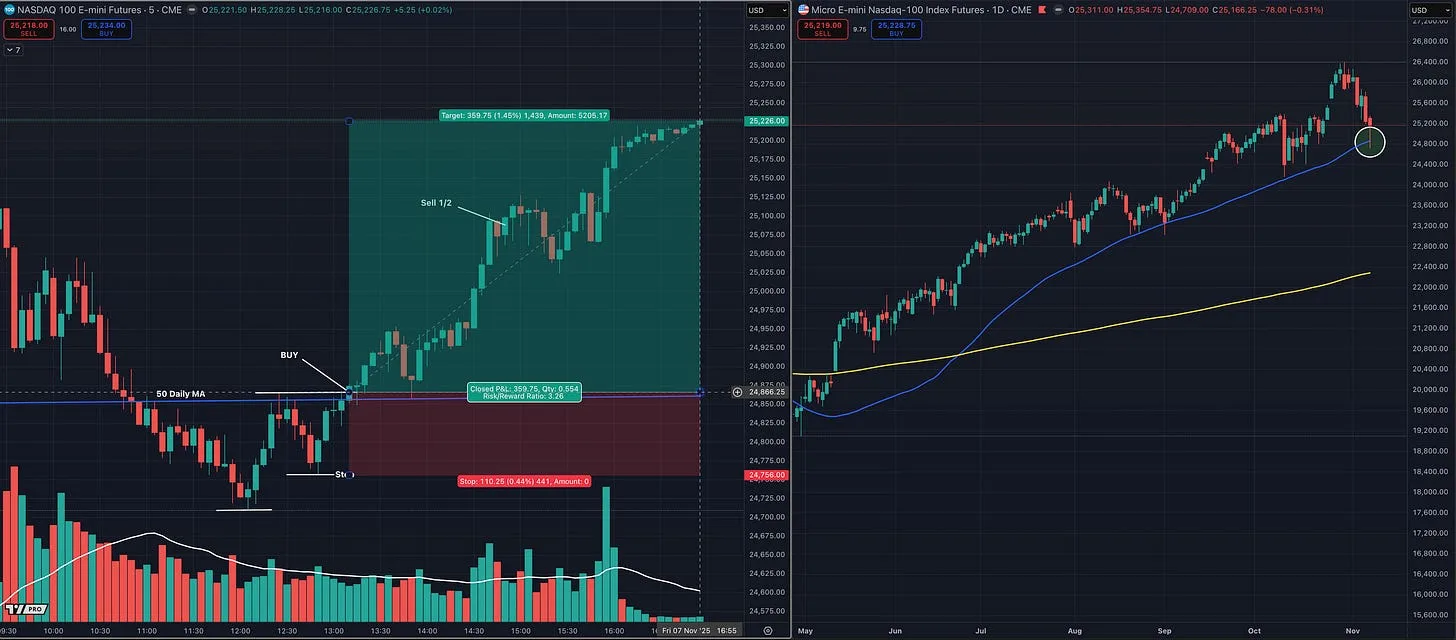
Yesterday provided a textbook example of how to blend multiple timeframes to build a swing position with very little risk and meaningful upside.
This wasn’t a scalp.
This wasn’t chasing a breakout.
This was using the lower timeframe to precisely time a higher-timeframe idea.
Let’s walk through it.
The Daily Chart: 50-Day = Area of Interest
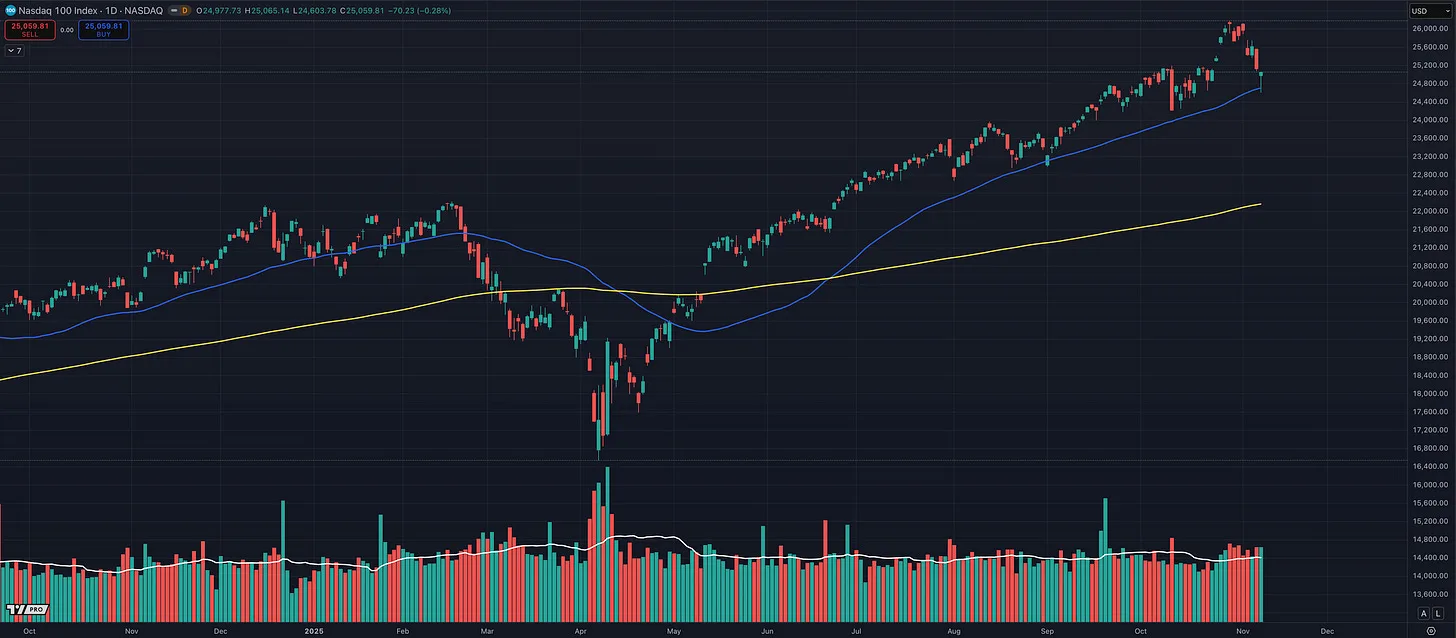
The Nasdaq-100 pulled back into its 50-day moving average, one of the most broadly watched institutional reference points.
But this is critical:
The 50-day is NOT a buy or sell signal.
As Brian Shannon says, a moving average is simply an area of interest — a place where we watch to see if the market treats it as support or resistance.
It tells us where to pay attention, not what to do.
Yesterday, price:
- Pierced below the 50-day
- Found buyers
- Reclaimed the level
This suggested that buyers were still willing to defend the uptrend.
But the daily alone can’t give us an entry.
That’s why we drop down a timeframe.
Multiple Timeframes → Context + Trigger
The daily gave us the big-picture setup — trend up, pullback to an important reference.
But the actual entry came from the intraday chart.
This is the essence of multiple timeframe analysis:
Higher timeframe = WHY | Lower timeframe = WHEN & WHERE
We don’t trade just because price crosses a moving average.
We trade when:
- There’s a logical context, AND
- Lower timeframe structure confirms
This alignment is the edge.
Intraday Chart: Confirmation Before Commitment
Here’s the key point:
I do NOT buy just because price reclaims the 50-day.
Lots of traders see price cross back above a moving average and immediately jump in.
That’s not a process, that’s reacting to a line.
Instead, I look for:
✅ A higher low
✅ A higher high
✅ Tape showing constructive price movement
✅ Volume supporting the turn
And that’s exactly what appeared intraday.
After reclaiming the 50-day area, price pulled back and held a higher low, then broke to a higher high.
That told us buyers were in control right now.
This gave us:
- A defined area of risk (under the intraday pivot / 50-day)
- Evidence of accumulation
- A reason to enter
We’re not buying the moving average.
We’re buying the reaction around it.
Managing the Trade: Locking In + Letting It Run
Because the intraday structure was clear, the stop was tight. That created an attractive asymmetric payoff — roughly 2:1 right off the bat and about 3:1 into the close.
As price pushed higher, we had a chance to:
- Sell ½ into strength around ~2R
- Move the stop to breakeven (or keep it slightly below the 50-day at the higher-low pivot)
This does two important things:
- Books a small, locked-in profit
- Removes psychological pressure
Now the remaining position becomes a free swing.
If the market wants to resume the larger trend — great.
If not, the loss is small or zero.
This is how you catch bigger moves without needing to predict them.
As George Soros put it in an interview clip:
“It’s very different when you’re risking your principle than when you’re risking your profit.”
Why This Matters
The trend since 2023 has been higher, with some repeated support near the 50-day.
No need to reinvent anything, just recognize where the market continues rewarding buyers.
Could this trade fail? Could the trend fail soon?
Yes, Yes and eventually it will.
But until price actually breaks structure, the probability favors continuation over sudden collapse.
We don’t predict.
We position ourselves intelligently:
- Small risk
- Large potential reward
- Trend still intact
This is how you build consistency.
Key Lessons
- The 50-day MA ≠ buy signal
It simply tells us where to pay attention - Wait for confirmation:
- Higher low
- Higher high
- Supportive tape + volume
- Use multiple timeframes:
- Daily = context
- Intraday = precise entry & defined risk
- Take partials into strength (~2R)
- Let runners ride with stops below structure
- Aim for asymmetric outcomes
- Stay process-driven, not predictive
The goal is not to be right.
The goal is to take smart trades where the reward can be multiple times the risk.
Final Thought
Your edge comes from:
- Knowing where opportunity might exist (daily)
- Waiting for confirmation (intraday)
- Managing risk aggressively
Yesterday checked all those boxes:
- Higher-timeframe support
- Lower-timeframe confirmation
- Defined risk
- Asymmetric payoff
You don’t buy moving averages, you buy price behavior around moving averages.
You don’t predict continuation, you position yourself where continuation pays you 3–10x more than failure costs you.
I’ve also learned, often the hard way, that over-analyzing can be just as harmful as under-analyzing.
There have been plenty of times where I hesitated, over-thought, and ultimately missed clean opportunities. Over time, those missed gains added up to far more than the controlled losses I would have taken by simply entering with defined risk.
Yes — breadth has weakened at times.
Yes — individual stock performance has ebbed.
But I’ve seen that same pattern repeatedly since early 2023, especially in the Nasdaq-100, and the trend still advanced.
Stay aware…
But don’t let analysis paralysis stop you from participating when structure, trend, and risk/reward are still aligned.
With that being said, I am 100% prepared for this trade to fail — and I’m okay with that.
That’s the game.
Stay patient.
Wait for alignment.
Control risk.
Let price prove it.
More in Strategy & Tactics
All Strategy & Tactics articles →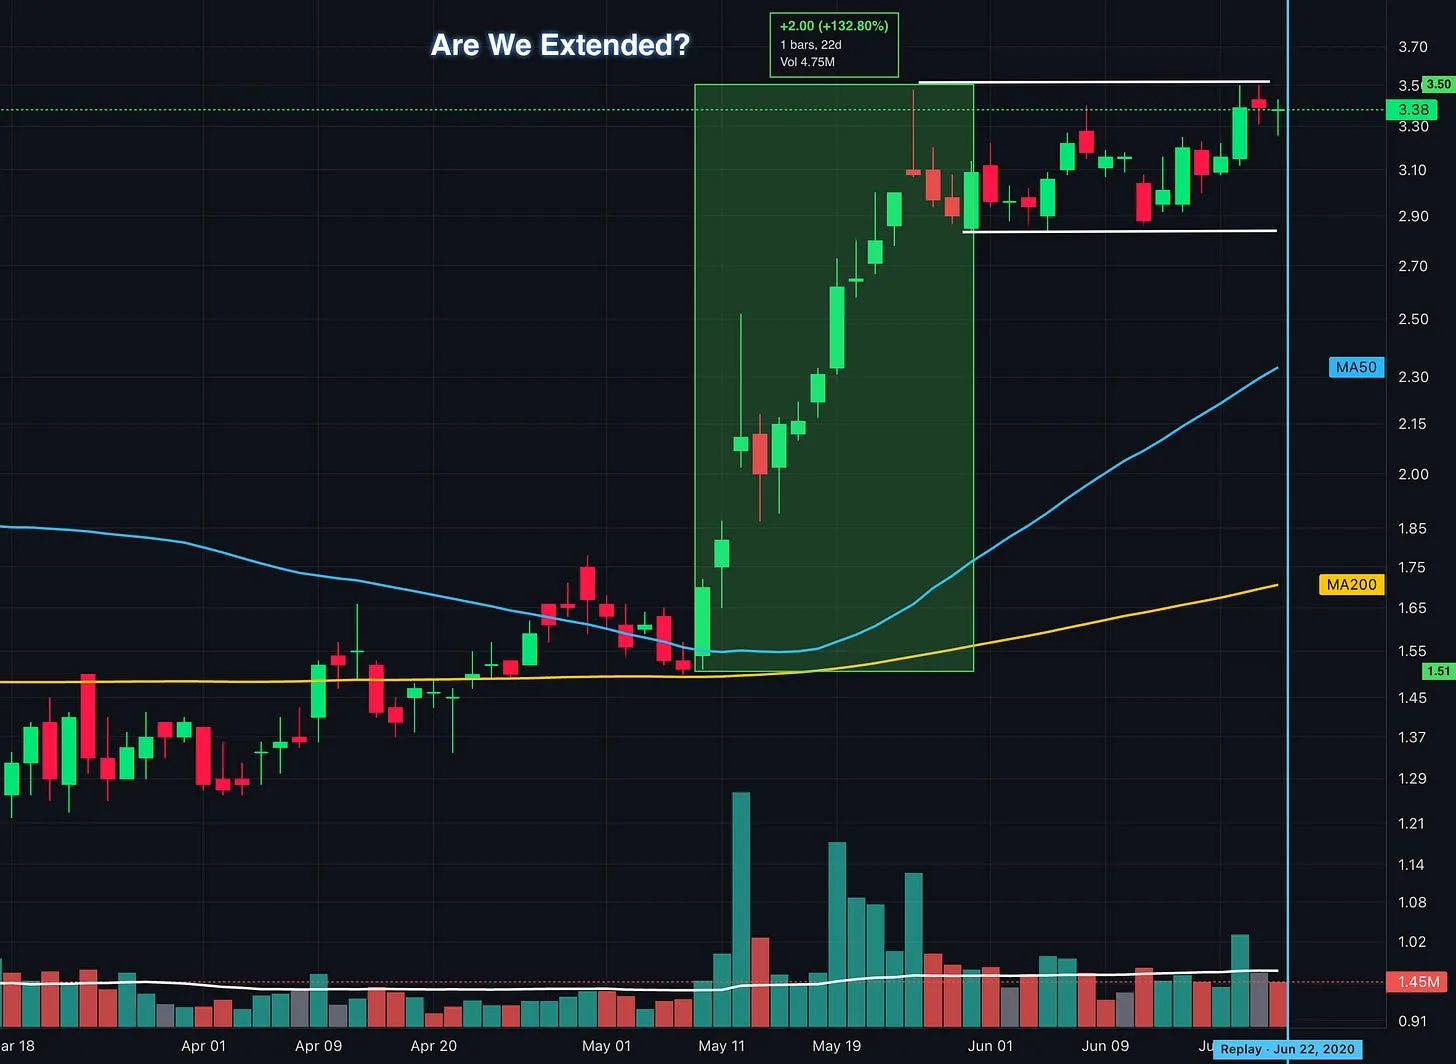
Oct 8, 2026 · Strategy & Tactics
Up 100% and Still Buyable? What Traders Get Wrong About Extended Stocks
How to identify proper buy points, avoid chasing stock breakouts, and manage entry risk using lessons from William O’Neil, Mark Minervini, David Ryan, and Dan Zanger.
- Momentum Trading
- VCP
- position trading
- Growth Stock Trading
- David Ryan
- Flag Pattern
- chart patterns
- Cup and Handle
Sep 27, 2026 · Strategy & Tactics
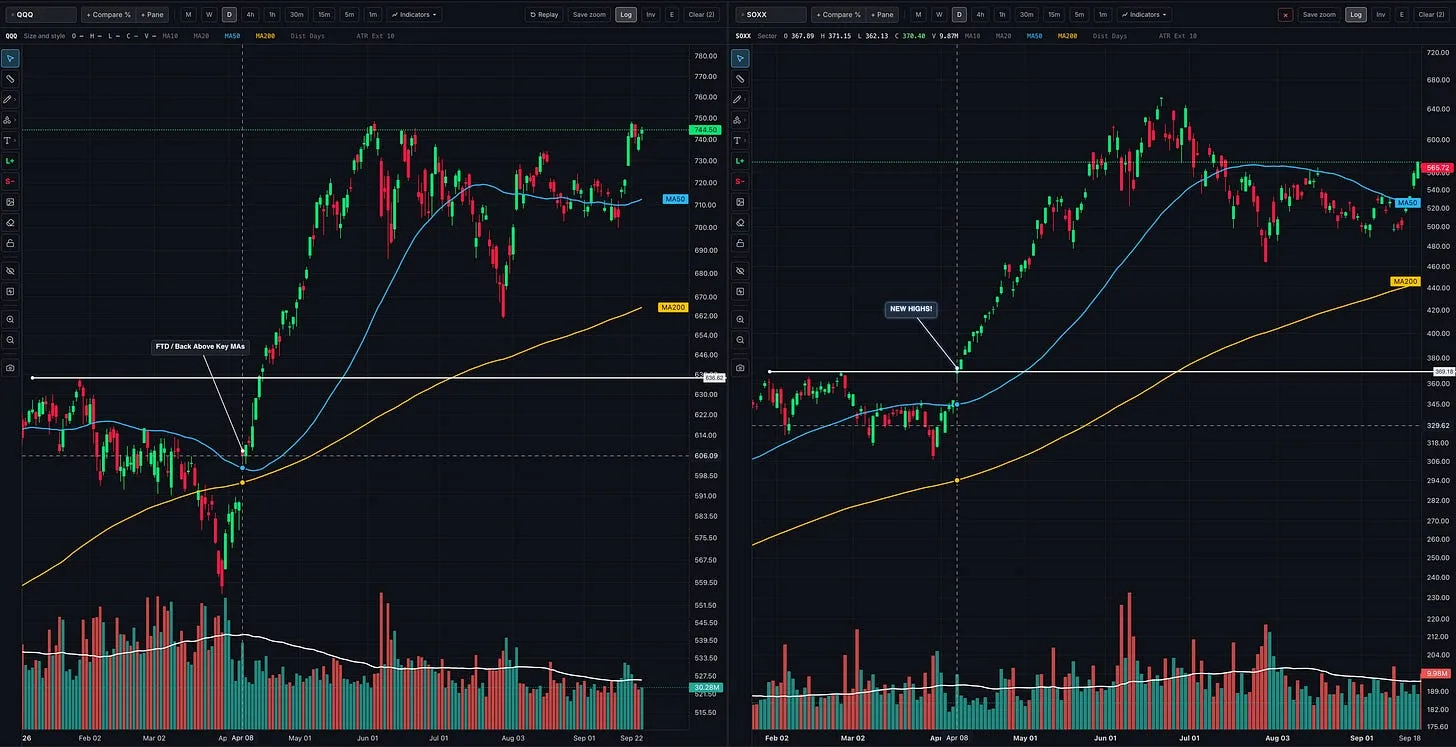
Should You Follow Leading Stocks or Wait for Market Confirmation?
How to read the market, industry groups, and individual stocks together so you can recognize opportunities, build exposure, and respond when conditions change
- growth stocks
- CANSLIM
- Trading
- position trading
- Stan Weinstein
- William O'Neil
- Momentum Trading Strategy
- Trade stocks
Sep 25, 2026 · Strategy & Tactics
Stage Analysis: How to Spot Stage 3 in Real Time
Recognize a developing Stage 3 using Stan Weinstein’s framework, with real chart examples, warning signs, and lessons for protecting your gains
- Momentum Trading
- Nasdaq
- technical analysis
- CANSLIM
- position trading
- Stan Weinstein
- QQQ
- Find True Market Leaders