
Trading articles/My Favorite Trade Setup: Big Momentum, Tight Contraction, Asymmetric Risk
Dec 20, 2025 · Momentum Trading Strategy
My Favorite Trade Setup: Big Momentum, Tight Contraction, Asymmetric Risk
How tightening price and drying volume create low-risk, high-reward opportunities
Originally published on Substack.
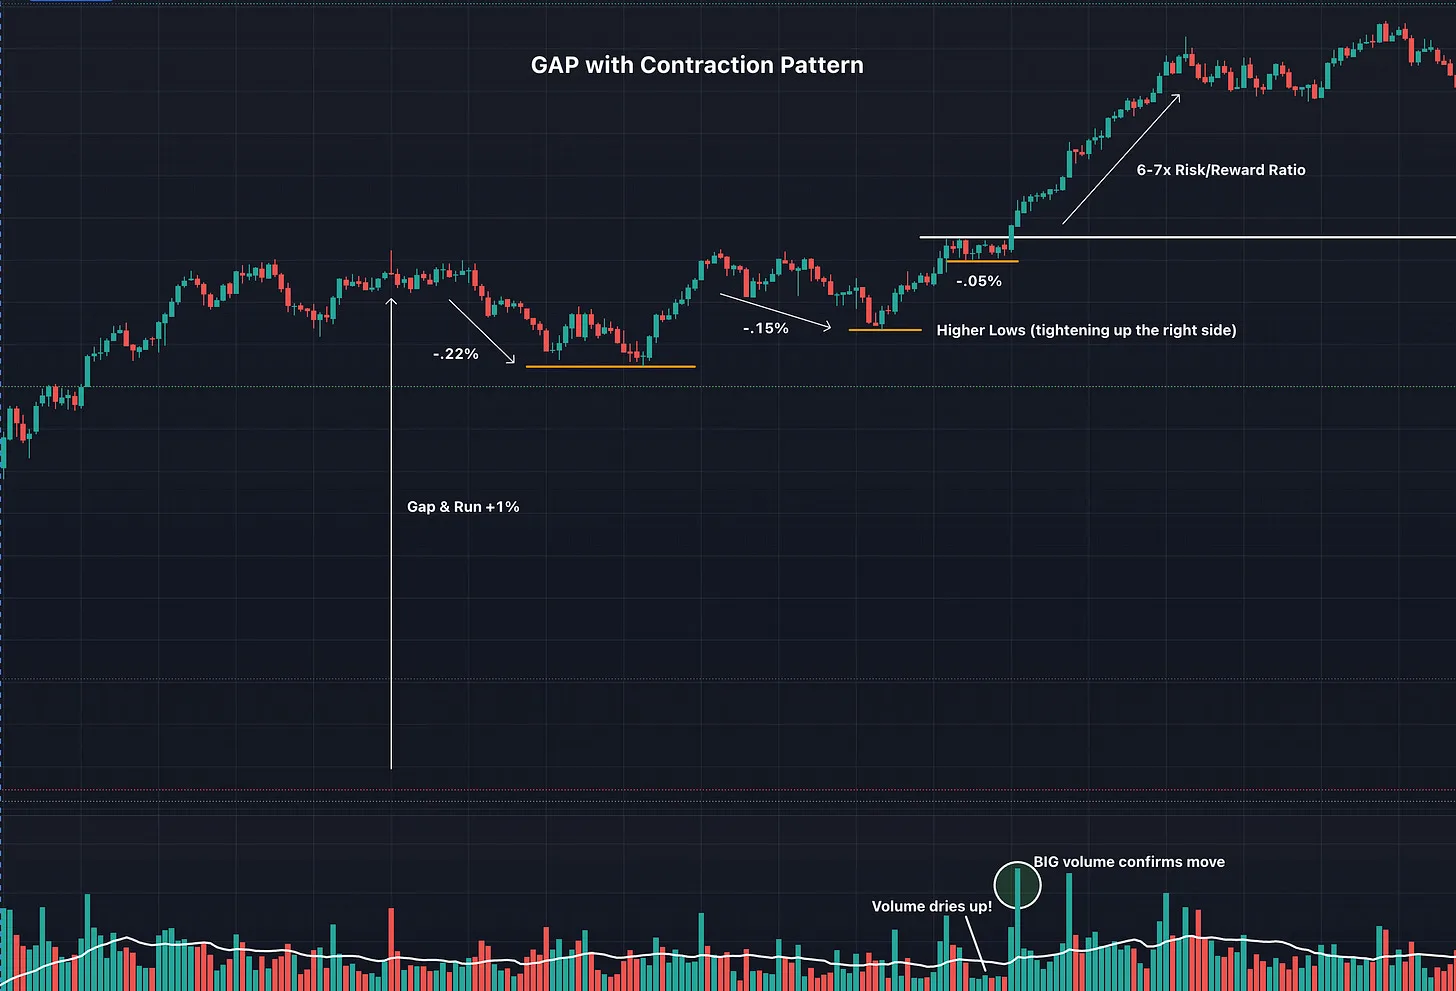
If you have traded long enough, you have probably noticed something.
The best setups often show up on multiple timeframes, and they usually look boring while they are forming. Most traders miss them because nothing feels urgent yet. Price is quiet. Volume is quiet. Everything looks uninteresting.
That is exactly why they work.
What separates consistent traders from everyone else is not prediction. It is the ability to recognize a real setup while it still looks like nothing, then have the patience to wait for the right conditions.
This post breaks down the one setup I come back to over and over again. It works on weekly and daily charts, intraday charts, and even short scalping timeframes.
The structure never changes because markets are fractal, just like nature.
Trading Is Fractal
Markets are fractal by nature.
The same price behavior that appears on weekly and daily charts also appears on 30 minute, 15 minute, 5 minute, and even 1 minute or sub minute charts.
The timeframe changes. The psychology does not.
Strong moves attract attention.
Price then pauses through contraction.
Risk tightens as price compresses on the right side of the chart.
Volume dries up during the consolidation.
Then volume returns as price expands again.
Once you understand this sequence, trading becomes much simpler.
Below are two charts showing the exact same behavior. One is NVDA on a weekly chart. The other is Nasdaq futures on a 5 second chart.
Different markets. Different timeframes.
Same structure. Same psychology.
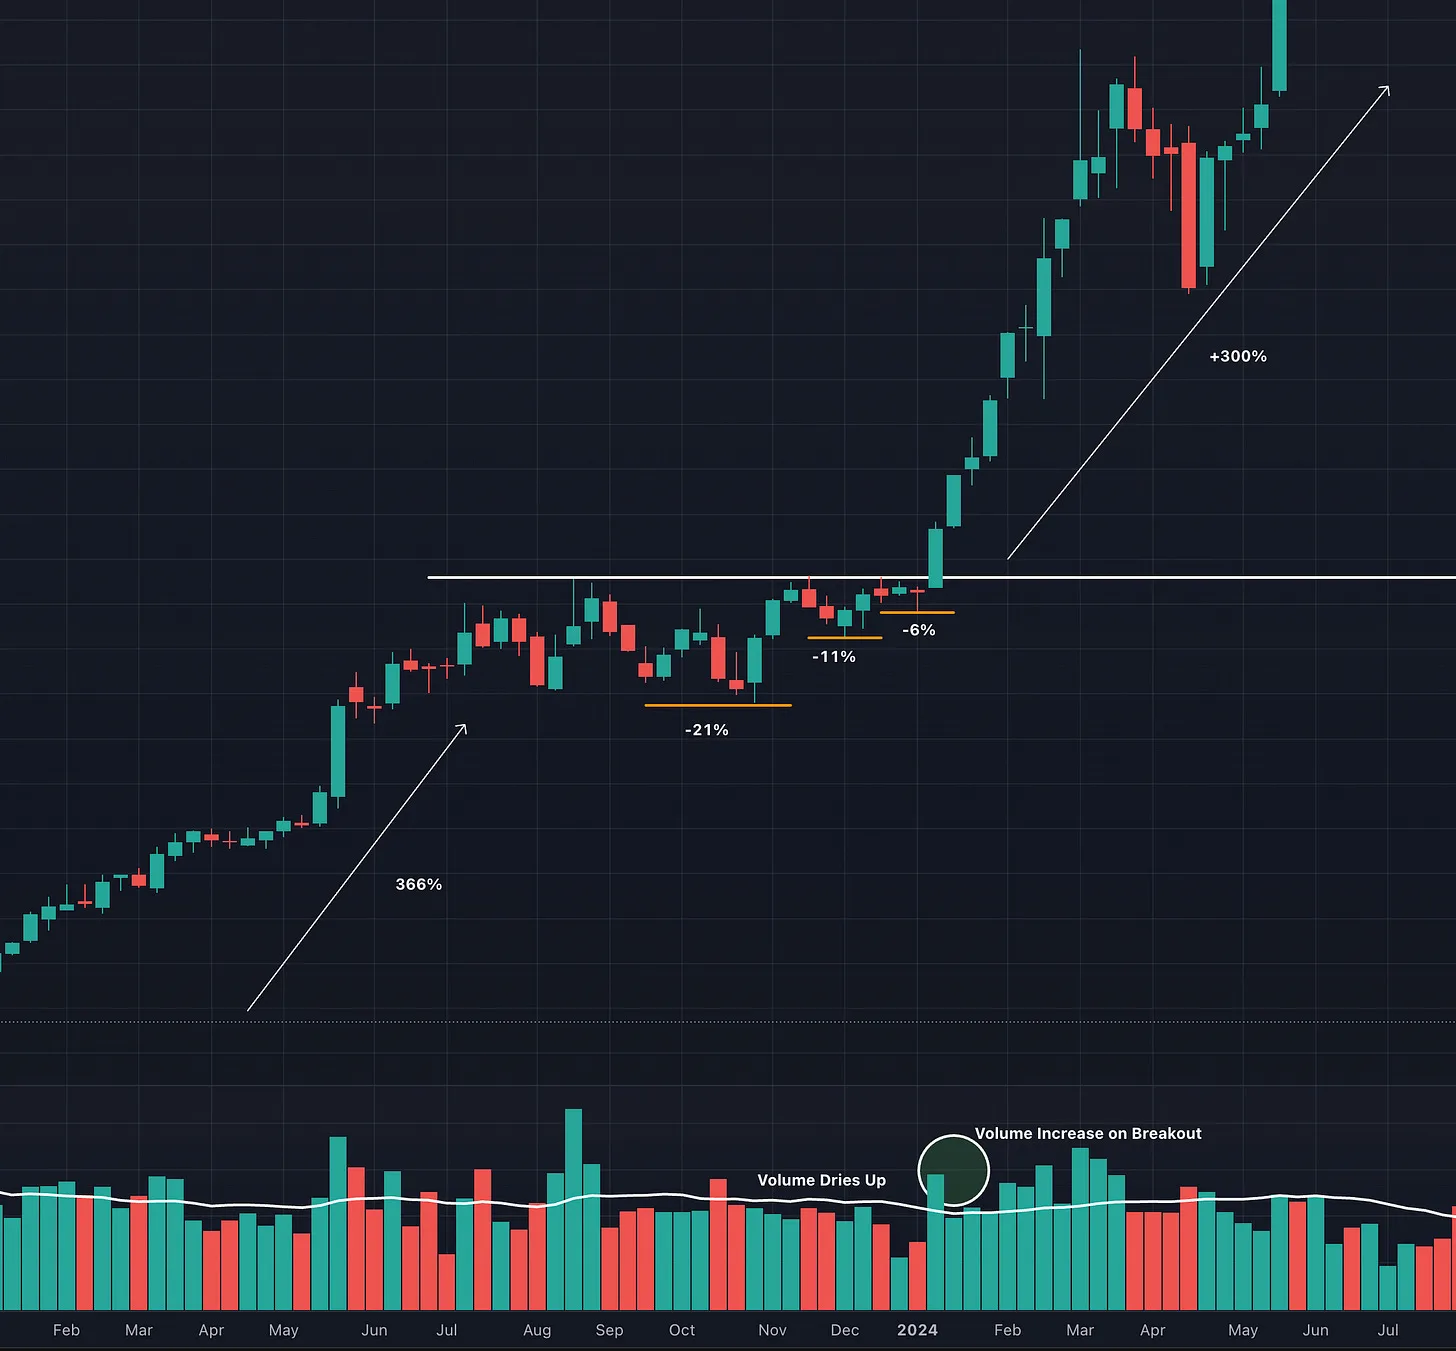
NVDA on Weekly Chart
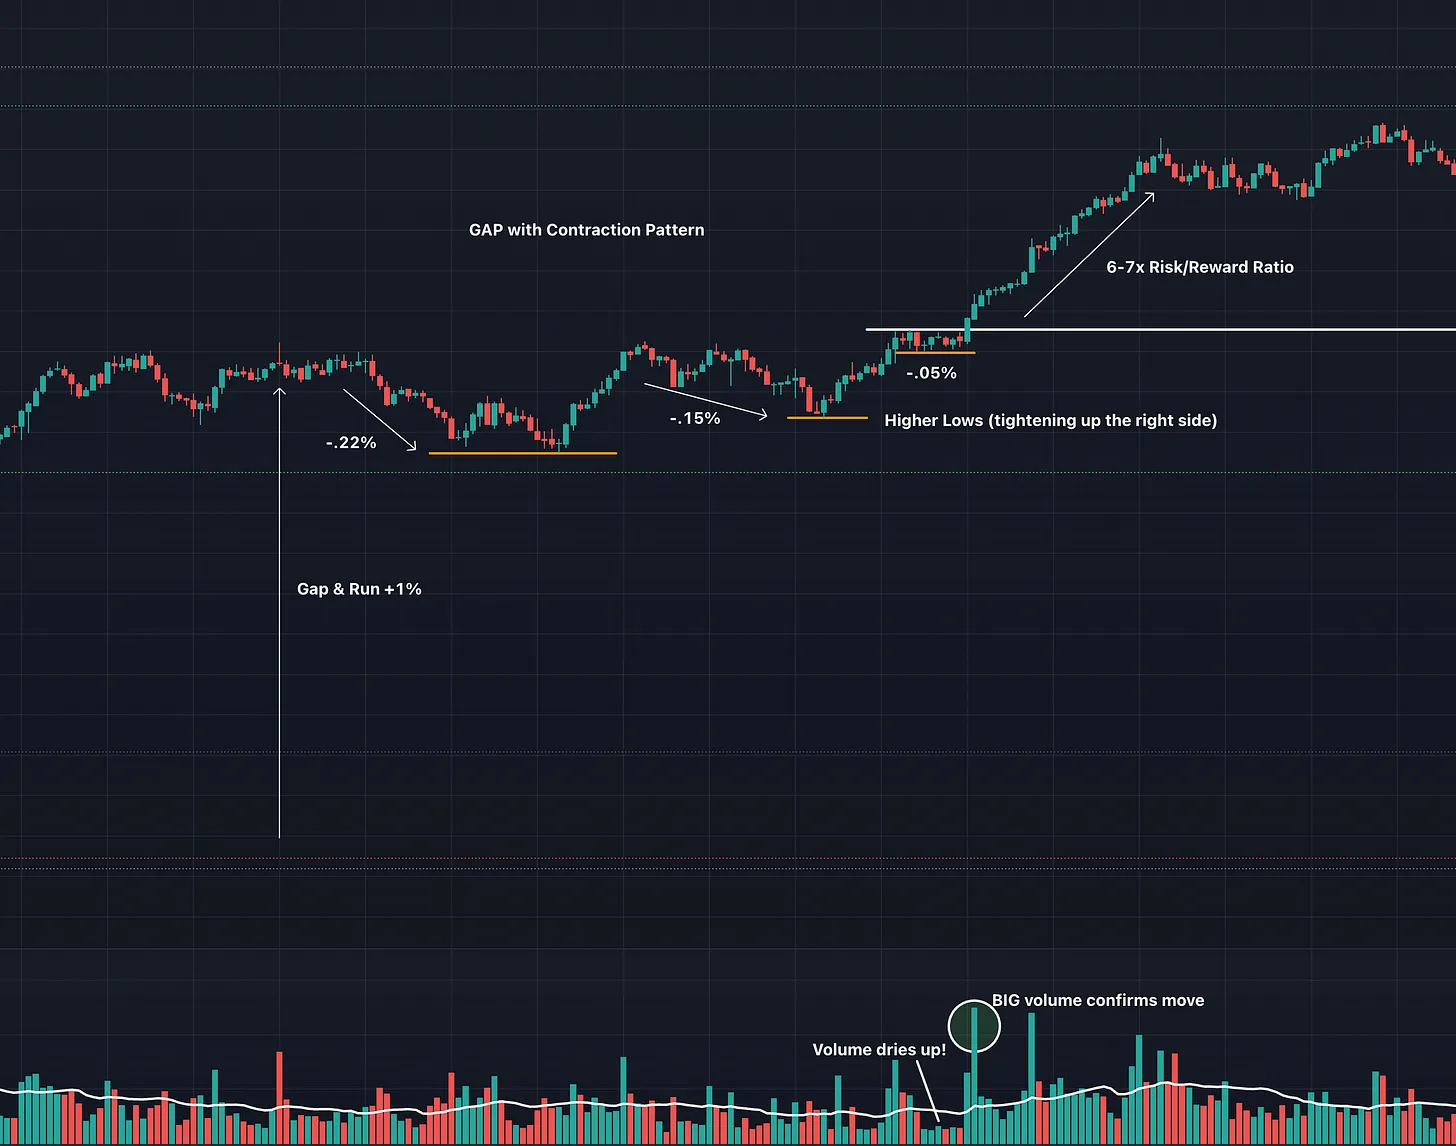
MNQ on 5 second chart
Step One: The Big Move Up
Every valid setup starts with powerful momentum.
I want to see a strong move higher that clearly stands out from the prior price action. This can come from a gap up, a sustained trend move, or a fast momentum push.
The purpose of this move is not to chase it.
The purpose is information.
A strong move tells you buyers are willing to act aggressively. It tells you demand exists and that institutions are involved.
During this stage, most traders start saying the same things.
“It is overextended.”
“It already had its move.”
“There is no way it can go higher.”
That thinking is exactly why this setup works.
Strong moves are not endings. They are signals. They create the conditions for what comes next.
This step is about preparation, not action. The big move sets the stage for a low risk, high reward opportunity that only appears if you are patient enough to wait for it.
Step Two: The Contraction Pattern
After the move, I do not want price to collapse. I want it to pause through consolidation and contraction.
Specifically, I am looking for a contraction pattern where pullbacks become progressively smaller and price tightens up on the right side of the chart.
An important detail is that the first contraction, even though it is the largest, should still be small relative to the size of the initial move up. This tells you the prior momentum remains in control.
This typically looks like:
- The first pullback is noticeable but shallow relative to the impulse
- The next pullback is smaller
- The next pullback is smaller again
- Lows begin to rise
- Price spends more time moving sideways than down
This is not random chop.
This is controlled digestion of the prior move. Selling pressure is drying up as buyers quietly absorb available supply.
As volatility contracts, risk contracts with it.
That is what creates the opportunity.
Step Three: Volume Must Dry Up
This is one of the most important parts of the setup.
During the contraction, volume should decline.
This tells you sellers are no longer urgent. It tells you supply is being absorbed quietly rather than dumped aggressively.
Low volume during a pause is not weakness. It is often strength.
When sellers are eager to exit, volume expands to the downside.
When selling pressure fades, volume disappears.
That is exactly what you want to see during a contraction pattern.
Quiet volume means weak hands have already exited and remaining supply is being absorbed. It sets the stage for the next move when demand returns.
This is how you know the contraction is constructive.
Step Four: Where I Look for Entry
I am not interested in predicting breakouts.
I wait for price to prove itself.
Entries typically come as price pushes above the tight consolidation, with volume expanding in the direction of the move. This confirms that demand is returning after the contraction.
My stop is placed below the most recent higher low or beneath the tightest part of the consolidation. The tighter the contraction, the tighter the stop.
This is exactly what Bruce Kovner described:
“Whenever I enter a position, I have a predetermined stop. That is the only way I can sleep. I know where I’m getting out before I get in. The position size on a trade is determined by the stop, and the stop is determined on a technical basis.”
This setup naturally allows for that approach.
The contraction defines the risk.
The structure defines the stop.
The expansion defines the reward.
There is no guessing involved.
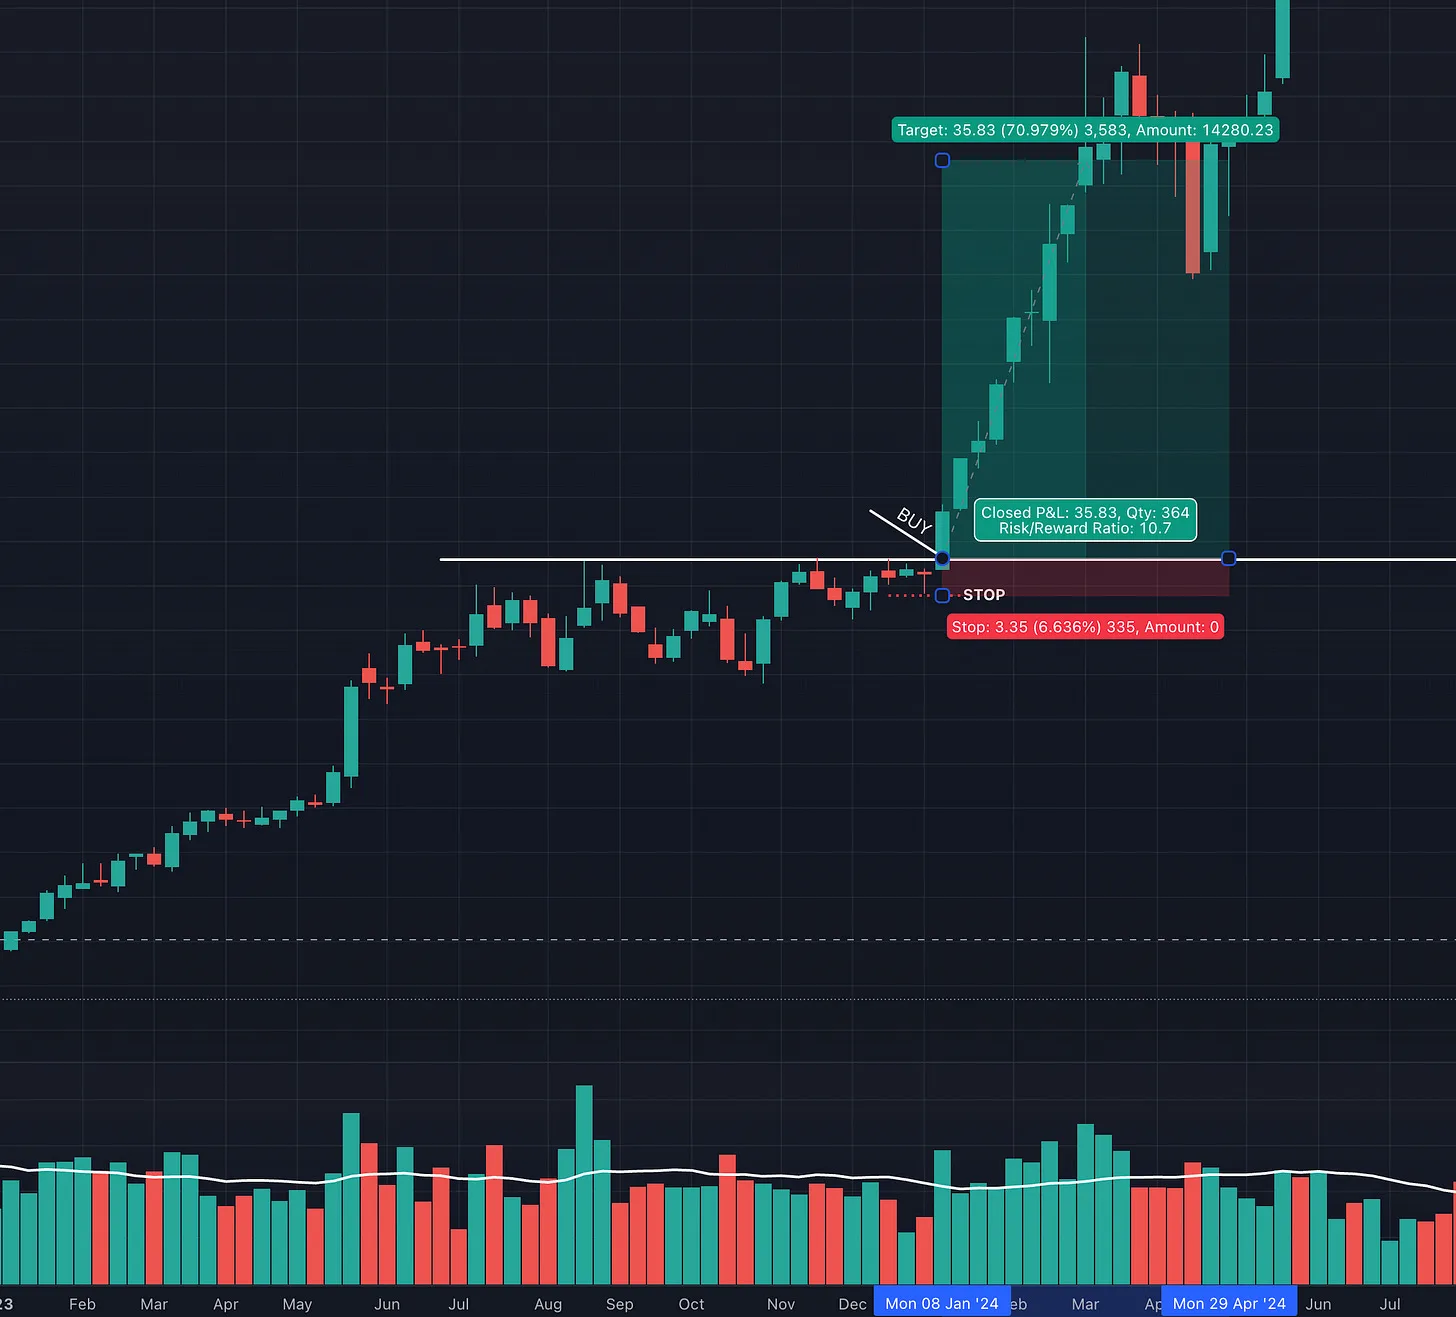
Step Five: Where the Stop Goes
Risk management is what makes this setup powerful.
My stop is placed:
- Below the lowest point of the final contraction
- Or below the tightest area of price compression
Because pullbacks are getting smaller, my stop naturally gets tighter.
This is not forced risk control.
It is structural.
If price breaks back down through the contraction, the setup is invalid.
There is no reason to stay in the trade.
Why the Risk to Reward Is So Favorable
As contractions shrink:
- Risk tightens
- Stops get closer
- Upside remains open
When price expands again, it often moves quickly.
That is how you get 5x, 10x, or 20x risk reward trades.
You are not trying to be right.
You are positioning yourself when the math is already in your favor.
When I Do Not Take This Setup
This matters more than entries.
I pass if:
- The initial move lacks strength
- Pullbacks are too deep or overlapping
- Volume increases on down moves
- Price cannot tighten on the right side
- Price action remains wide and loose
A contraction pattern is only valid if sellers are clearly losing control.
If that is not happening, I wait.
Patience is required.
Final Thought
This setup works because it is not a pattern.
It is behavior.
History has shown that true demand leaders will still pause and consolidate after a strong move, but supply behaves differently when buying pressure remains in control. Sellers are absorbed rather than aggressive. Price tightens instead of breaking down.
Over and over again, you will see the same sequence play out.
A strong move higher.
A contracting consolidation as sellers are absorbed by buyers.
Then another expansion move when demand reasserts itself.
This behavior appears on every timeframe, in every market, and in every cycle.
This setup is not common, and that is part of what makes it powerful. But when it appears and when it works, it can produce some of the most favorable risk to reward opportunities the market offers.
Patience is the cost of admission.
More in Strategy & Tactics
All Strategy & Tactics articles →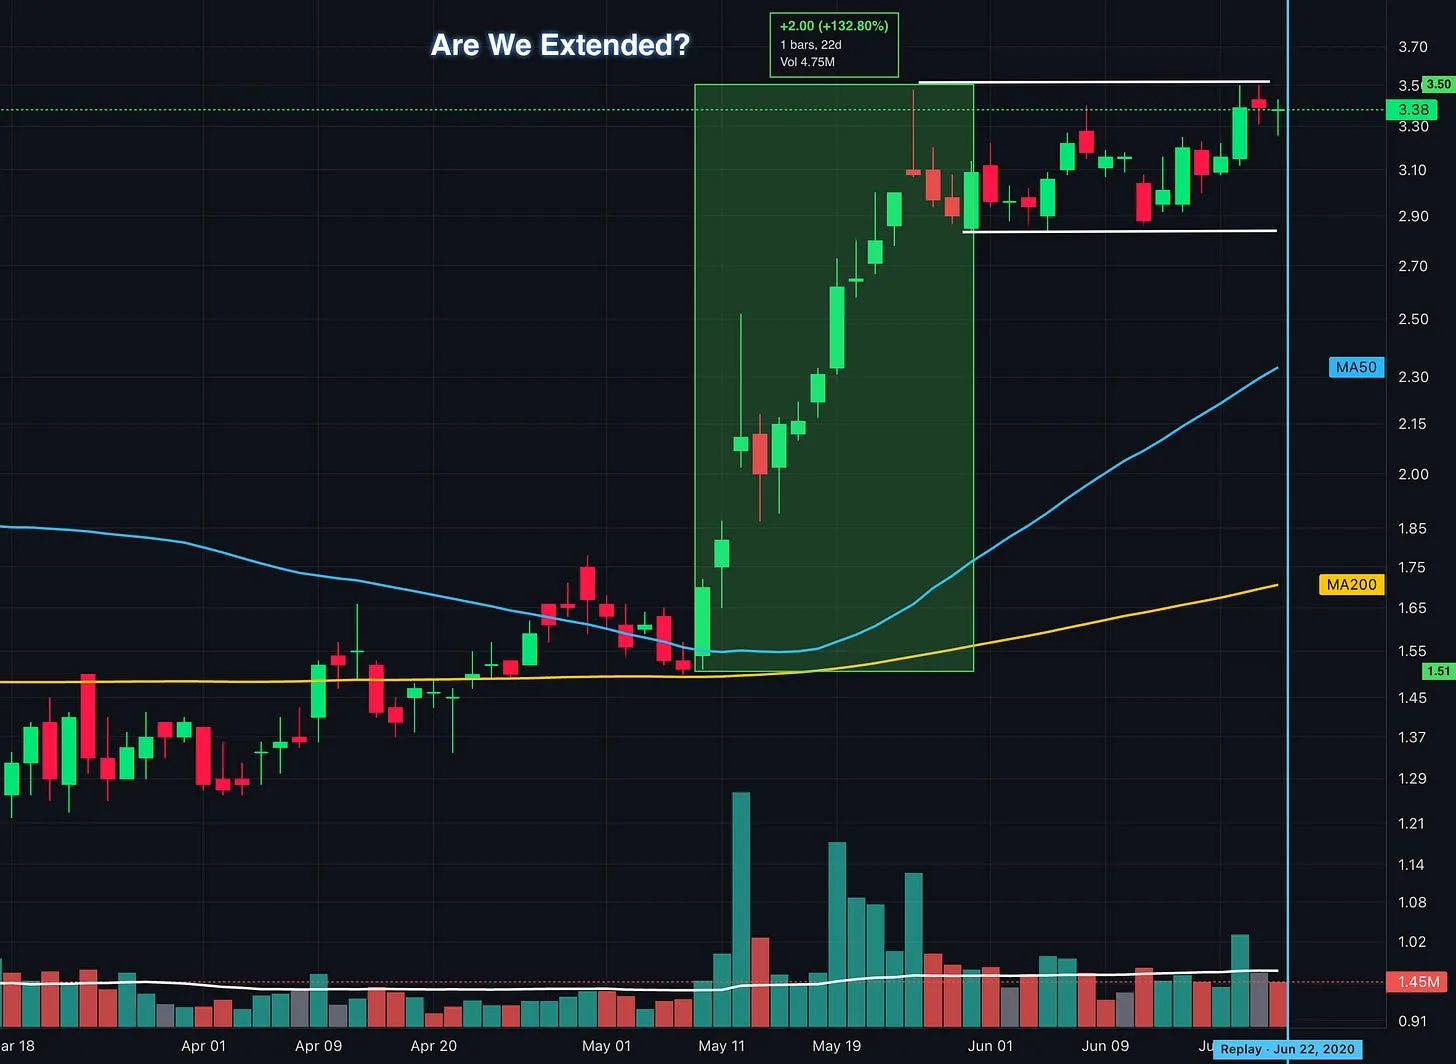
Oct 8, 2026 · Strategy & Tactics
Up 100% and Still Buyable? What Traders Get Wrong About Extended Stocks
How to identify proper buy points, avoid chasing stock breakouts, and manage entry risk using lessons from William O’Neil, Mark Minervini, David Ryan, and Dan Zanger.
- Momentum Trading
- VCP
- position trading
- Growth Stock Trading
- David Ryan
- Flag Pattern
- chart patterns
- Cup and Handle
Sep 27, 2026 · Strategy & Tactics
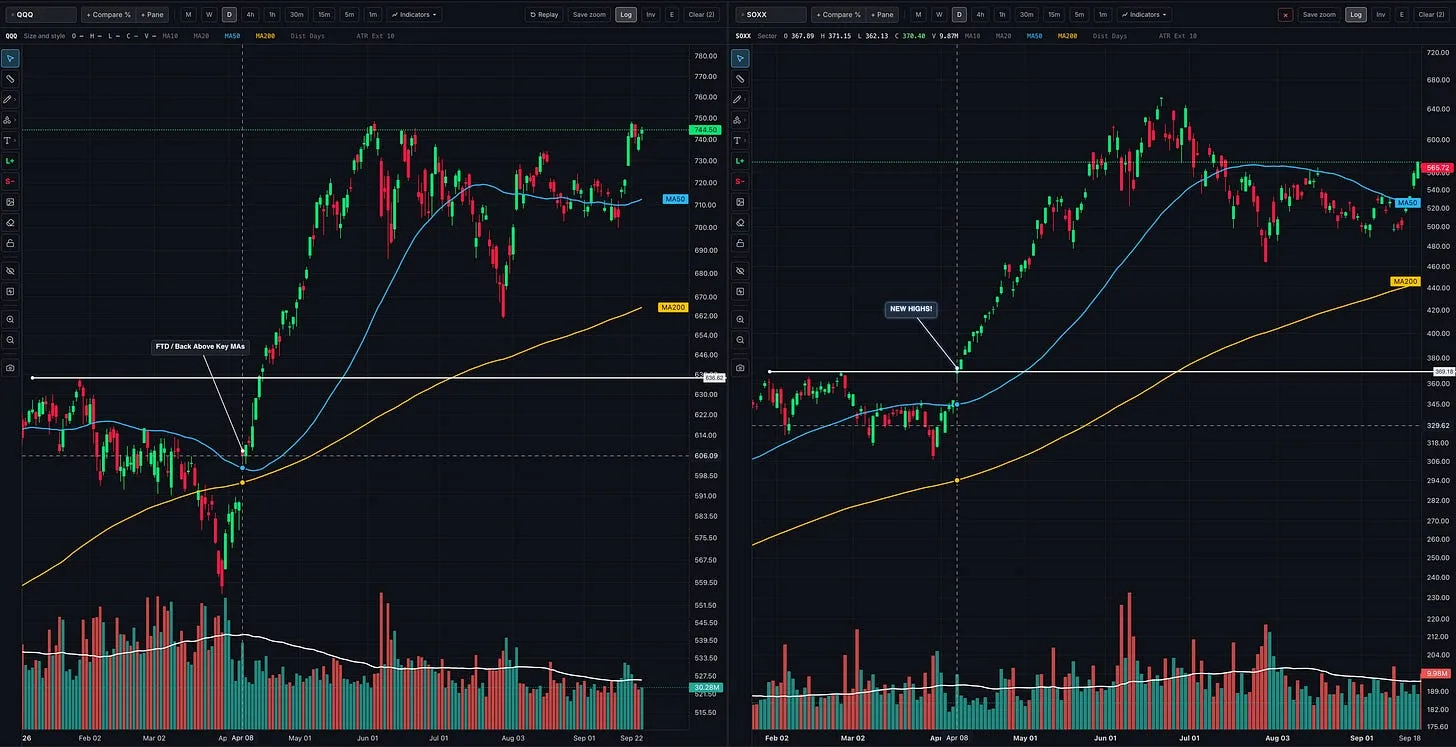
Should You Follow Leading Stocks or Wait for Market Confirmation?
How to read the market, industry groups, and individual stocks together so you can recognize opportunities, build exposure, and respond when conditions change
- growth stocks
- CANSLIM
- Trading
- position trading
- Stan Weinstein
- William O'Neil
- Momentum Trading Strategy
- Trade stocks
Sep 25, 2026 · Strategy & Tactics
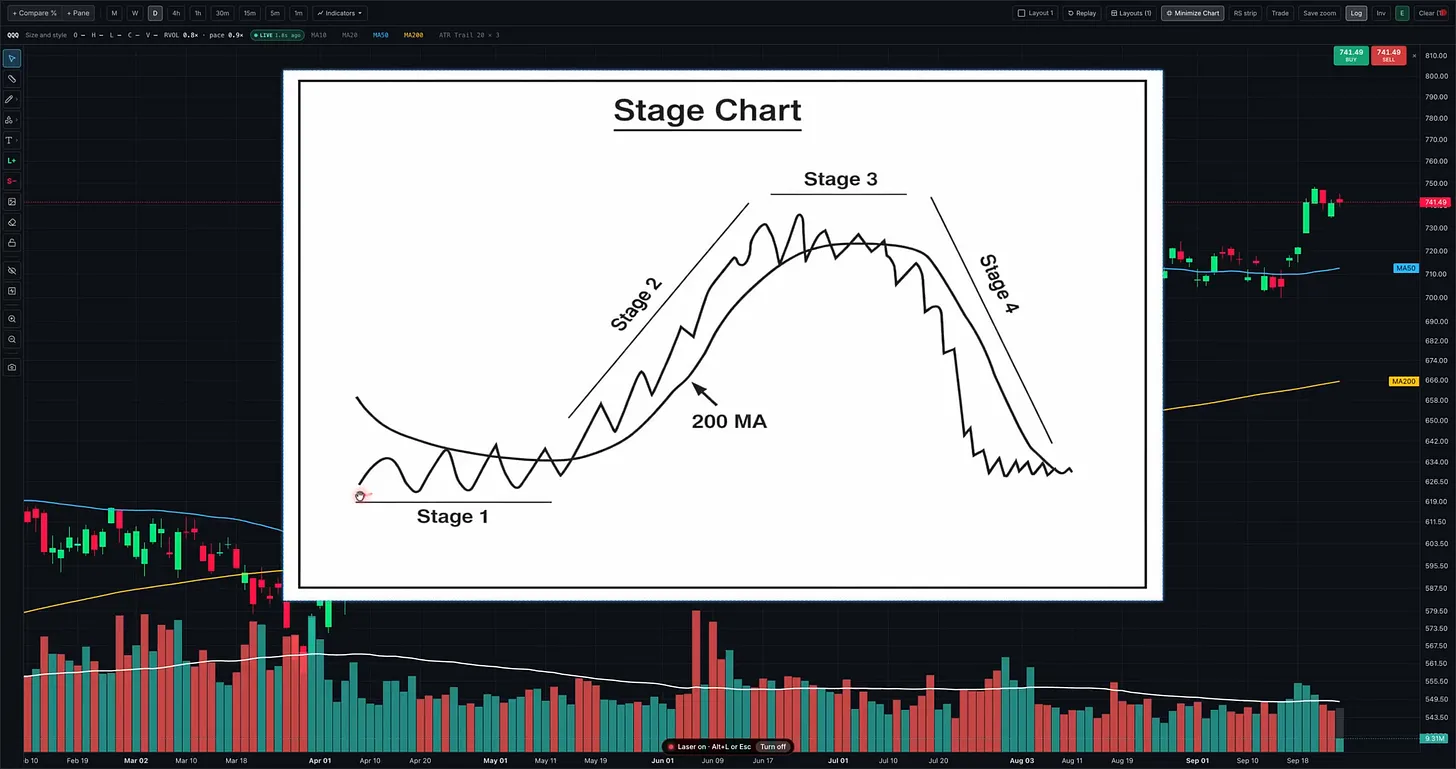
Stage Analysis: How to Spot Stage 3 in Real Time
Recognize a developing Stage 3 using Stan Weinstein’s framework, with real chart examples, warning signs, and lessons for protecting your gains
- Momentum Trading
- Nasdaq
- technical analysis
- CANSLIM
- position trading
- Stan Weinstein
- QQQ
- Find True Market Leaders