Momentum Trading Strategy

Notes

Short lessons on momentum trading, every day.

Every note from Substack, in one place: risk, setups, leading stocks, market conditions and the mindset behind them. Search them, browse by topic, or filter by stock.

Showing 141–160 of 1222 notes

View on Substack ↗

You Don’t Need Hindsight to Spot Stage 3

Someone recently commented that identifying Stage 3 is difficult and questioned whether it can only be spotted after the fact. It’s a fair concern. Recognizing a developing stage 3 takes practice, but it can be done while it is happening.

You won’t necessarily recognize Stage 3 the moment it begins. What initially looks like a normal pullback may gradually reveal a change in character as the evidence builds. That delay does not mean you have to wait until the damage is obvious.

Stan Weinstein and Mark Minervini describe the characteristics of a developing Stage 3. William O’Neil also emphasizes watching distribution, abnormal behavior in leading stocks, and the performance of your recent purchases. These observations help you recognize changing conditions and make decisions while the outcome is still uncertain.

That’s exactly what I walk through in this video. Using chart replay in MTS Velocity, I examine the indexes, sectors, industry groups, and leading stocks to show how the warning signs develop. We discuss what those changes mean for protecting gains, reducing exposure, and deciding when conditions justify getting more involved again.

A potential top can still resolve into another advance, so recognizing Stage 3 requires staying responsive to new evidence. I’ve sped the video up to 1.5× to keep the walkthrough moving. If you’re getting started with stage analysis, this should help you understand what to look for and how to practice recognizing it.

Watch the video: Stage Analysis: How to Spot Stage 3 in Real Time

https://tradingmomentum.substack.com/p/stage-analysis-how-to-spot-stage
ArticleStage Analysis: How to Spot Stage 3 in Real Time
View on Substack ↗

Compounding Isn’t Just About How Long You Hold

Everyone wants the stock that doubles. Fewer people appreciate what a series of smaller winners can do for their account.

When we talk about compounding, we usually talk about time and time is important. Holding an exceptional stock through a sustained advance can produce extraordinary returns.

But Minervini emphasizes another powerful factor: how often you can reinvest your capital and apply your edge.

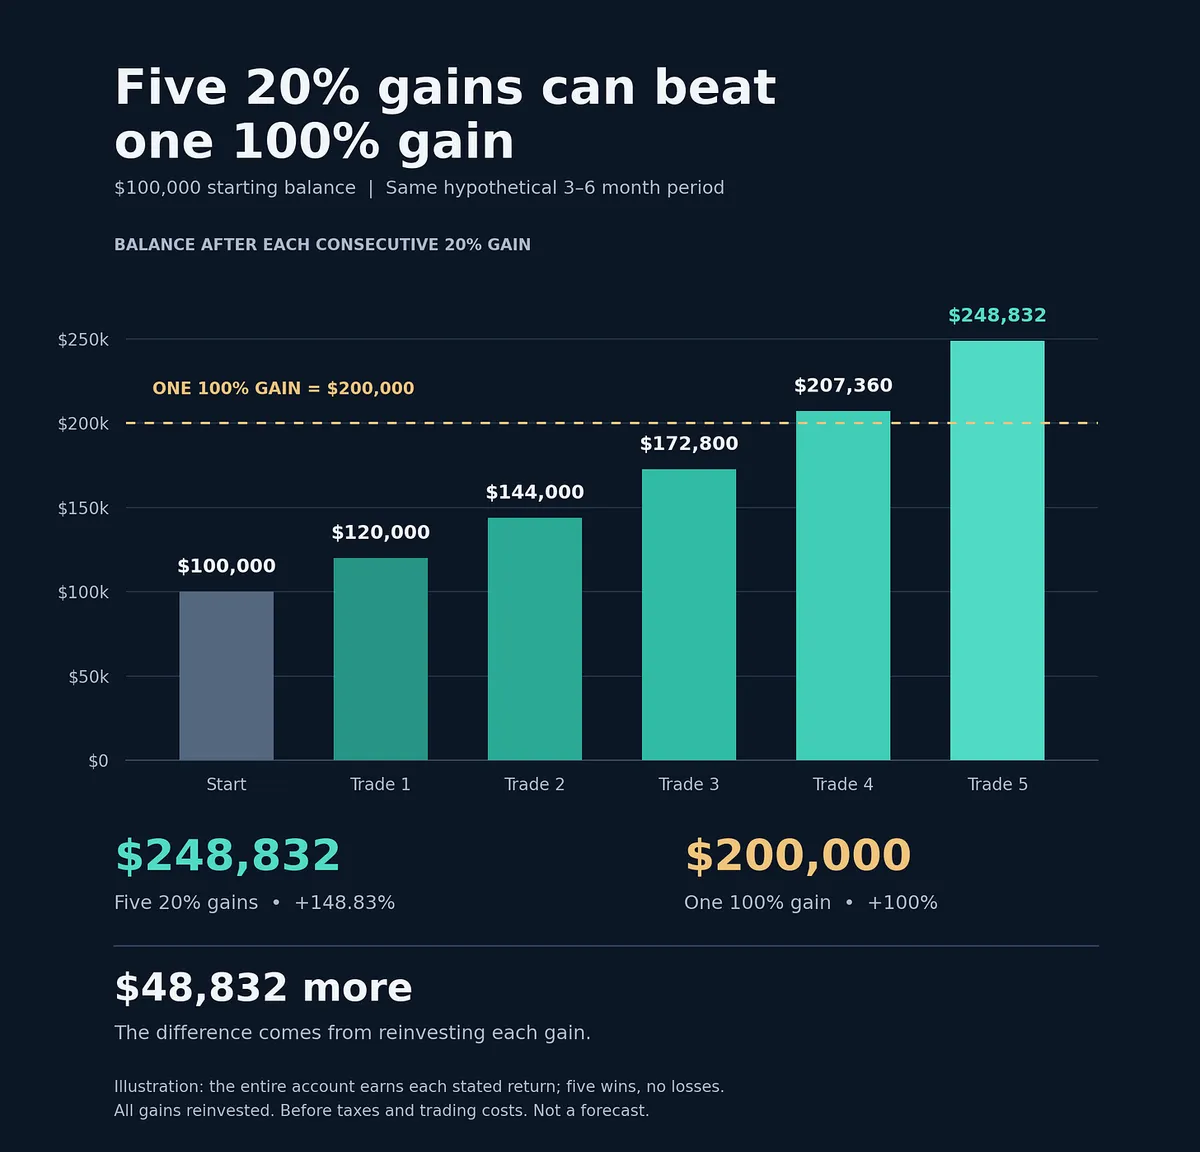
Consider the simple example in the image:

Starting with $100,000, one 100% gain produces $200,000.

Five consecutive 20% gains, with everything reinvested, produce $248,832.

That’s a 148.83% return without a single trade doubling. If both happen over the same period, the smaller compounded gains finish $48,832 ahead.

This simplified example assumes the entire balance earns each return, with five winners and no losses or trading costs. Actual account results depend on position sizing and the full mix of wins and losses.

But the principle deserves attention: repeated gains can produce an extraordinary result when you reinvest them.

A worthwhile gain captured in a few weeks can free capital for another qualifying opportunity. Each opportunity gives you another chance to apply your edge and compound the proceeds.

The benefit depends on maintaining that edge and controlling losses as you repeat the process.

You don’t need every winner to double for your account to achieve exceptional returns.

View on Substack ↗

Your Account Can Outgrow Your Comfort With Money

Before you ever learned to read a chart, you were learning what money meant. You learned from the bills your parents worried about, the arguments you overheard, and what the people around you considered a good income. Those experiences helped shape your expectations about what was normal, what was possible, and what you stood to lose.

Childhood experiences and inherited beliefs shape our self-image. What we repeatedly hear and experience can become what we expect from ourselves. Sometimes we carry an old definition of what’s possible into a life that has already changed.

Think about how that can show up in trading. One trader becomes overwhelmed risking $1000. Another stays composed at $10,000, while another feels that pressure at $100,000. Account size, position sizing, and exposure are all important, but so is what those dollars represent to each person.

That becomes especially important when you scale. You might follow your rules consistently at one size, then start hesitating, cutting winners prematurely, or resisting losses at the next. The percentage risk can stay the same while the dollar amount crosses an emotional threshold. Brett Steenbarger addresses this in The Daily Trading Coach, explaining how thinking in familiar dollar amounts can make increasing size psychologically difficult.

Mark Douglas describes an even more striking pattern in The Disciplined Trader: traders who make money consistently until they reach a certain threshold, then surrender their profits through decisions completely inconsistent with the trading that got them there. After the losses, they return to their usual approach, rebuild, and repeat. He connects this pattern to conflicts between the success traders consciously want and the beliefs they carry about money, work, and what they deserve.

That is one possible explanation for what looks like self-sabotage. A useful question is: When I reach that level, what changes in my decisions?

  • Do I start protecting every dollar instead of following the setup?

  • Do I feel pressure to make even more?

  • Does a normal loss suddenly feel like a verdict on my ability or a threat to my security?

Start noticing those patterns. Keep risk within your financial capacity, increase size gradually, and track whether you can still execute your plan. Give yourself repeated experience managing the new level before increasing it again.

These are the quiet parts of trading that don’t get enough attention, yet they can undermine even a well-developed strategy. It’s difficult to accept that you could be holding yourself back when you want so badly to move forward. But wanting success doesn’t automatically undo beliefs you’ve carried for decades.

Breaking those patterns may require examining parts of your life you never expected to confront through trading: what money meant growing up, what you learned to fear, and what you came to believe was possible for someone like you. Recognizing those beliefs is the beginning. Changing their influence on your decisions takes deliberate work and repeated practice.

For the next version of you to grow, some of the old beliefs have to die. Part of that growth is rewiring what you learned to expect from yourself, so yesterday’s conditioning stops setting tomorrow’s limits.

View on Substack ↗

The Market Doesn’t Owe You an Equation

A company can have exceptional earnings, strong sales, and a compelling story, yet its stock can break down weeks after the report. It may even enter a Stage 4 decline with no obvious news to explain the move. A breakout can fail when nearly everything appears to line up.

That is why I think about trading in probabilities. The comparison to quantum physics is a metaphor, but a useful one: strong evidence can improve the odds without guaranteeing the outcome. Good fundamentals do not force institutions to keep buying, and we may never know exactly why they stopped.

William O’Neil emphasized earnings and sales, but he also studied price, volume, and the direction of the market. Larry Hite’s point in Market Wizards was that a good bet can still lose. Mark Douglas made the same distinction in Trading in the Zone: an edge improves your odds across many trades; it cannot promise the result of any one trade.

This applies on earnings day, weeks later, or on an ordinary Tuesday with no headline. The fundamentals tell me why a stock deserves attention, but price action tells me whether the trade is working. I don’t need an explanation for every decline to respect it. Price is always right.

View on Substack ↗

Same Stock. Same Exit. 67% More Profit

“It’s only a little above my buy point.”

That small compromise can cost more than you think.

In the Master Trader Program, Minervini illustrates this with a stock breaking through a $20 pivot. Two traders buy the same number of shares and eventually sell at the same price.

Trader A Buys at $20.20, just 1% above the pivot.

Sells at $21.20.

Profit: $1.00 per share, before costs.

Trader B Hesitates and buys at $20.60, now 3% above the pivot.

Sells at $21.20.

Profit: $0.60 per share, before costs.

Trader A makes roughly 67% more profit.

Trader B’s extra 40 cents at entry consumed 40% of the profit Trader A captured. The difference came entirely from the purchase price.

Now think about repeating that habit across 200 trades. Then add hesitation on the exit: a little more given back while waiting for a bounce, another loss allowed to drift past the planned stop.

Small execution mistakes become big performance problems when you repeat them.

You can identify the right stocks and understand the right setups, yet still weaken your results by consistently paying too much and acting too late.

That’s why I want to know my entry, maximum acceptable purchase price, and exit plan before the trade. If the stock runs beyond my entry range, I can wait for another qualifying opportunity.

Missing a trade is frustrating. Repeatedly compromising the math is expensive.

Set your maximum entry price before you buy. Respect it. When your exit rule triggers, act.

View on Substack ↗

You Don’t Need Every Winner to Be a Home Run

A 15% winner can look unimpressive when everyone is talking about stocks that doubled.

But how much did you risk to earn that 15%, and how long did it take?

A 15% gain against a planned 5% risk is a 3R winner.

That’s a meaningful trade. You’ve earned three times your initial planned risk. Across a series of trades, keeping your average gains substantially larger than your average losses, with a sufficient win rate, can support a profitable strategy without requiring a steady supply of 100% winners.

Minervini emphasizes the power of smaller gains compounded over time. When you have an edge, capturing and reinvesting a series of smaller gains can compound capital faster than waiting for one larger move. O’Neil’s familiar 20–25% profit-taking guidelines also recognize the value of capturing intermediate moves, while making exceptions for unusually powerful stocks.

Time matters, too. A gain captured in a few weeks can free capital for another qualifying opportunity. Waiting months for a hoped-for move while better setups develop has an opportunity cost.

Singles and doubles deserve a place in a strategy designed to find exceptional winners.

I screen for stocks with the earnings, sales, relative strength, and price-and-volume characteristics that can support a major advance, but I can’t know in advance which qualifying stock will become the home run.

Some will fail. Some will produce worthwhile gains. A few may develop into something much bigger.

My job is to manage each one as the evidence unfolds: cut losses, take partial profits when justified, protect gains, and give strong positions room to continue.

A 15% gain isn’t an automatic instruction to sell everything. The stock’s behavior, market conditions, and my sell rules guide that decision.

The home runs can emerge from that same process. I don’t have to correctly predict them before buying, and I don’t have to dismiss every smaller winner while waiting for one.

Build a process that makes singles and doubles worthwhile and gives home runs room to develop.

View on Substack ↗

The First Loss Is Your Best Loss

The stop is easy to agree with before the trade. The test comes when the stock reaches it.

Suddenly, you start negotiating.

“It’s probably just a shakeout.” “I’ll give it another day.” “I’ll sell when it bounces.”

A planned 5% loss can become 10%, then 15%. The setup that justified your entry has failed, but now you’re holding because you don’t want to accept the loss.

Moving the stop lower changes how much you’re risking. It doesn’t improve the trade.

If your plan calls for an exit 5% below your entry, honor that decision. If the setup needs more room, account for that before buying through your stop placement and position size. Once your exit is triggered, follow through.

Sometimes the stock will recover after you sell. That doesn’t make following your stop a mistake. If it produces another qualifying entry, you can evaluate it again.

You don’t need to stay in a failed trade to participate in a future opportunity.

The first loss is the one you planned and sized for. Refusing to take it opens the door to a loss you never intended to carry.

You won’t avoid every losing trade. You can build the discipline to exit when your rules tell you to.

Decide where you’re getting out before you get in. When that exit triggers, act.

View on Substack ↗

The Best Trades Tend to Prove Themselves Early

When I review my biggest winners, one characteristic keeps showing up: they made meaningful progress soon after the entry. Some accelerated away from the buy point. Others reached 2R or 3R before pulling back and continuing higher.

Jesse Livermore emphasized commitments in a stock or commodity “showing a profit right from the start.”

That’s an important lesson about timing. A good company can spend months going nowhere. A well-timed entry aims to put your capital to work as demand begins moving the stock out of its consolidation.

Early progress gives you a profit cushion and evidence that the setup is working. When that progress never arrives, you need to reassess whether the stock is behaving as expected.

Too many traders make “it hasn’t hit my stop” their entire reason for holding. Days become weeks. The stock chops around, other opportunities develop, and patience gradually turns into an excuse to avoid making a decision.

Normal pullbacks and retests are part of trading. A winner can revisit its entry, and one quiet session doesn’t invalidate a setup. What matters is whether the stock’s behavior remains consistent with your plan and the market environment.

Before entering, know what constructive follow-through should look like. Then evaluate what actually happens: Is the stock advancing, holding its gains, and finding support? Or repeatedly stalling and failing to attract demand?

Your capital has a time cost as well as a price risk.

A trade that hasn’t stopped you out still has to earn its place in your account.

View on Substack ↗

Larry Hite once said in Market Wizards:

“I don’t know of too many people who get rich by taking small profits.”

Everyone knows the famous saying: Cut your losers short and let your winners run. But look at how many traders actually behave. They give a losing position more room because they hope it will recover, then sell a winning position at the first small gain because they’re afraid of giving it back.

They give their weakest trades patience and their strongest trades a deadline.

Hite’s comment came in a discussion about seeing the bigger picture, controlling risk, and following the trend. Catching a meaningful move requires staying with a stock while it continues to act right, including through normal pullbacks and consolidations.

Taking partial profits can help manage risk and make holding the remainder easier, but if you consistently sell your entire position at the first small gain, you never give a potential big winner the chance to become one.

Stop giving your losers the patience your winners deserve.

View on Substack ↗

Great Earnings Don’t Cancel a Stage 3 Top

The company reports great earnings. The headlines are glowing, but the stock has already started acting differently.

Pullbacks are deeper. Price swings are wider. Heavy selling keeps interrupting rallies. Breakouts struggle to hold.

The business can still look strong while the stock is topping.

That’s what makes Stage 3 so deceptive. After a long advance, the story is widely known and the recent results can look outstanding. Fresh buyers see the earnings report and assume the stock has another big move ahead.

That demand can give institutions an opportunity to sell into strength.

A rally on good news might even look like a fresh breakout, but if it reverses on heavy volume and fails to hold the breakout, the headline doesn’t erase that warning.

Watch what the stock does with good news.

Does it advance, hold its gains, and attract support on pullbacks? Or does every attempt higher meet selling?

I care about earnings and sales growth, but I also want the stock’s behavior to confirm those fundamentals. Strong numbers don’t give a deteriorating chart a free pass.

For new buys, a Stage 2 uptrend is my starting requirement. Then I need a qualifying setup, and defined risk.

If a stock repairs its structure and establishes a fresh Stage 2 advance, I can reconsider it. I don’t need to anticipate that recovery because the story sounds convincing.

Great earnings never override evidence of distribution.

View on Substack ↗

You Can’t Predict the Reward. You Can Plan the Risk

You don’t know how far a stock will go after you buy it. You can study past winners, estimate the potential, and identify a strong setup. You still don’t know what this particular trade will deliver.

When I review my biggest winners, many went much farther than I ever expected. Meanwhile, some of the stocks I thought had the greatest potential barely went anywhere.

That’s why I’ve never placed too much emphasis on predicting an exact price at which to take profits. I focus on finding stocks with the characteristics I teach in the MTS Course, entering at a sound buy point, and managing my risk and position size. From there, price and volume action, along with my sell rules, guide how I manage the position.

Before you start counting the potential profit, calculate the planned loss.

  • Where is your entry?

  • What would tell you the setup has failed?

  • Where will you place your stop?

  • How many shares can you own while keeping the planned loss within your risk limit?

Those decisions belong before the buy, while you can evaluate the trade without the pressure of an open position.

Your historical win rate, average gain, and average loss help you evaluate your strategy across a series of trades. They don’t tell you whether the next trade will fail or become your biggest winner of the year.

That’s why I want a defined exit if I’m wrong and room for the stock to develop if I’m right. As the trade unfolds, I can take partial profits, raise stops, and respond to changes in the stock’s behavior.

I don’t need to know the final reward to make a disciplined decision about the risk.

Rule: Quantify your planned risk before entry. Manage the reward as the trade develops.

View on Substack ↗

Your Gut Hasn’t Earned Your Trust Yet

“Follow your rules. Don’t blindly trust your gut.”

Early in your trading career, that is essential advice. Fear can make you hesitate when a qualifying setup triggers. Excitement can make you chase an extended stock. Comfort in a winning position can make you dismiss the signals telling you to sell.

Your emotions can pull you in the opposite direction of what your strategy requires.

Even after some success, you may still lack the experience to distinguish useful intuition from false confidence, fear, or wishful thinking.

But that doesn’t mean intuition has no place in trading. Learning to understand your feelings is part of developing judgment. You can acknowledge a feeling without automatically acting on it.

Minervini describes a “crossover.” Through disciplined practice, consistent execution, and honest review, your feel for the market can become useful. You begin recognizing changes in behavior because you’ve studied and traded through similar situations repeatedly.

Sometimes you recognize that something has changed before you can fully explain every detail.

That kind of judgment can pick up subtle information your mechanical rules may not capture.

I’m a rules-based discretionary trader. My rules provide the framework for selecting trades and controlling risk. Experience helps me interpret the action within that framework. Developing that feel takes work, and simply spending years in the market doesn’t guarantee you’ve developed it.

Ed Seykota, known for his systematic approach, expressed the distinction in Market Wizards:

“Gut feel is important. If ignored, it may come out in subtle ways by coloring your logic. It can be dealt with through meditation and reflection to determine what’s behind it. If it persists, then it might be a valuable subconscious analysis of some subtle information. Otherwise, it might be a dangerous sublimation of an inner desire for excitement and not reflect market conditions. Be sensitive to the subtle differences between ‘intuition’ and ‘into wishing.’”

That is the question worth asking: Am I recognizing something in the market, or am I feeling what I want to happen?

Wanting a stock to recover can feel like conviction. Wanting to avoid another loss can feel like a warning. Wanting action can feel like spotting an opportunity.

Experience and self-awareness can help you distinguish those reactions from useful recognition. Pay attention to what you feel, examine its source, and review the decisions that follow. Your intuition earns credibility through that process, while your risk limits remain in place.

The mistake is trying to trade with a veteran’s intuition before you’ve done the work to develop it.

There’s no shortcut. Study the market. Study yourself. Review your decisions. Over time, learning from that experience can help you develop intuition that sharpens your judgment and takes your trading to the next level.

View on Substack ↗

EDRY Just Showed Why Sell Rules Matter

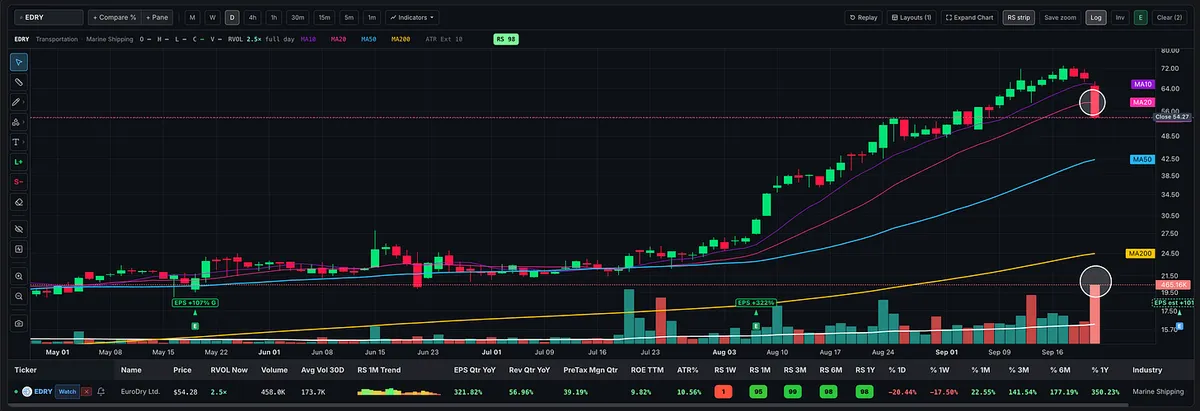
EDRY fell 20.44% today on roughly 2.5× relative volume. After a powerful advance that largely followed the 10-day moving average, the stock delivered a clear change in character.

The first warning was the gap below the 10-day. Selling continued through much of the morning, and price then broke through the 20-day. In MTS Velocity, RVOL Now was already flagging elevated volume early in the session, giving us another reason to pay attention.

An alert near your planned exit level brings the stock front and center. Your sell rules determine what you do next. If you caught the earlier breakout, an orderly exit could still leave you with a substantial profit, even after giving back some of the advance.

Unfortunately, catching a big winner doesn’t automatically make someone good at managing it. Without sell rules, it’s easy to keep finding reasons to hold: the earnings still look great, the industry is strong, or the stock will probably bounce. Meanwhile, a meaningful gain starts disappearing.

Kullamägi’s approach is relevant here. His published breakout rules include taking partial profits after the initial burst and trailing the remaining shares with the 10-day or 20-day moving average, using a closing break of the selected average as the exit signal. EDRY finished below both today.

For a swing trader following a similar approach, this is a textbook sell signal. Other traders may have acted earlier under rules for a sharp, heavy-volume breakdown. The important thing is having those rules established before the selling starts.

And if EDRY rebounds tomorrow or reaches new highs again? That wouldn’t invalidate a disciplined exit based on today’s evidence. You evaluate a trading process across many trades, and protecting gains sometimes means leaving before a stock’s final advance.

Sell rules exist because you cannot know which breakdown will recover and which will become a much larger decline.

A single unmanaged position can undo months of good trading. You don’t need to capture the exact top, but you do need to know when your plan says the trade is over.

View on Substack ↗

Give Me the Meat in the Middle

A lot of traders obsess over buying the exact bottom and selling the exact top. I’ve found plenty of success, and a lot more contentment, taking the meat in the middle.

Look at EDRY.

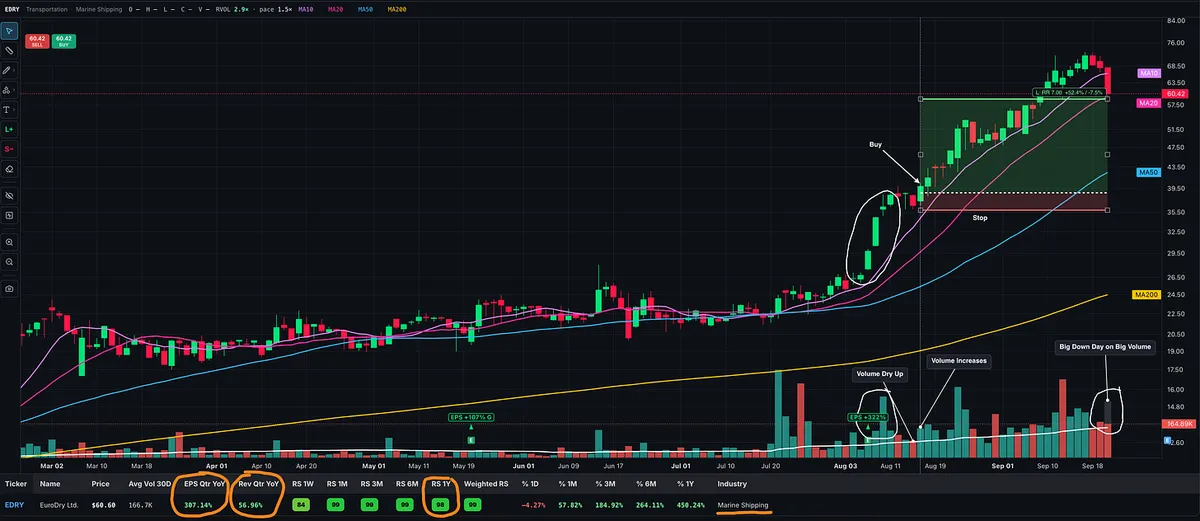
For months, it chopped sideways, developing higher lows and finding support around the 50-day. Buying a pullback might have kept you involved, but your capital could have spent considerable time waiting for sustained progress. Minervini addresses this directly: money sitting in a stock that goes nowhere has an opportunity cost while other setups develop.

Then August brought an explosive earnings move on heavy volume.

Buying immediately before the announcement would have meant gambling on the market’s reaction. Instead, you could wait and study that reaction, how well the stock held its gains, and whether buying continued afterward. Missing the first burst doesn’t necessarily mean missing the opportunity.

EDRY then tightened up. After several sessions of strong momentum, price moved sideways and volume dried up. Both Minervini and O’Neil describe tight price action accompanied by contracting volume as constructive evidence that selling pressure is diminishing.

When volume returned and price pushed out of that short consolidation, there was an entry opportunity with a nearby low against which to define risk. Depending on the entry, the low of the day could also serve as the stop.

As O’Neil writes: “You want a stock to prove its strength to you before you invest in it.”

From there, EDRY largely followed its 10-day moving average higher. Now the sharp break beneath that line on heavy volume, toward the 20-day, marks a change in behavior. For a swing trader managing this move around those averages, that deserves attention.

Kullamägi’s published approach includes taking partial profits and trailing the remaining position with the 10-day or 20-day moving average. His moving-average exit rule looks for a close below the selected line, which matters when evaluating an intraday break.

There were opportunities to sell some into strength along the way, too. Many successful traders have made the broader point that consistently capturing the exact low and high is unrealistic. Successful trading leaves some of the move behind.

You could miss the bottom, wait until after earnings, and exit below the peak while still capturing a substantial move.

That’s why I maintain a watchlist, set alerts, and look for momentum followed by tightness, drying volume, and renewed demand.

Give me a sound entry and defined risk. The meat in the middle is enough.

And if I miss it? Stay patient and move on to the next setup.

View on Substack ↗

The Discovery That Turned “Buy Low” on Its Head

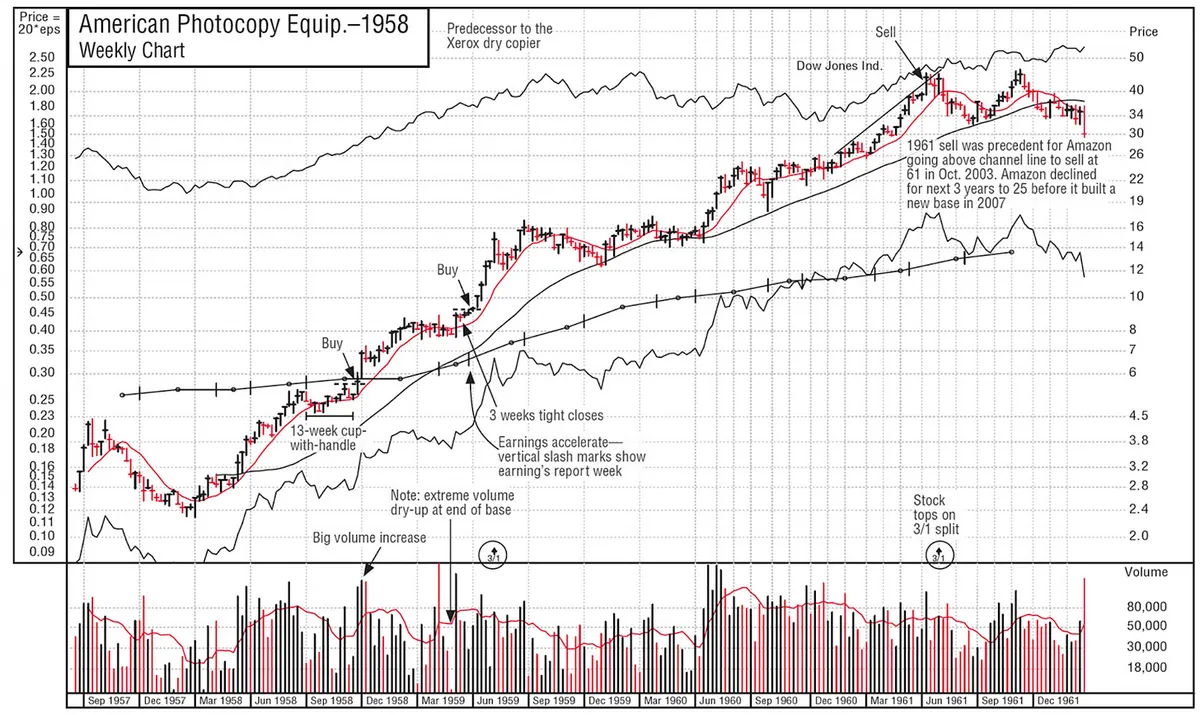
In January 1960, William O’Neil studied the best-performing mutual funds to understand what separated them from their competitors. The Dreyfus Fund stood out. He obtained its reports from 1957 through 1959, calculated the average purchase prices of its new holdings, and marked those prices on stock charts.

After examining more than 100 new purchases, he made what he called a “stunning discovery”: every stock in that sample had been bought at the highest price it had traded at during the preceding year.

Think about that. While many investors associated bargains with stocks that had fallen, one of the standout funds was buying stocks reaching new highs. Those purchases also followed recognizable chart patterns. O’Neil had found two essential clues: strength mattered, and the pattern preceding the breakout mattered.

For an individual stock, a new high shows that price has overcome the selling that previously contained it. When that happens as the stock emerges from a sound base on heavy volume, it provides evidence of demand consistent with institutional buying. Combine that with strong earnings, sales, and relative strength, and you begin to understand why new highs became central to O’Neil’s stock selection.

A true all-time high adds another advantage: the stock has cleared its historical overhead supply. Investors who bought at higher prices are no longer waiting above it to sell at breakeven. A 52-week high is significant too, although older resistance can still exist.

For the general market, new highs help reveal the strength of the environment in which those stocks are trading. O’Neil studied the major indexes’ price and volume action because market direction could support or undermine even an excellent stock selection. An index reaching new highs is good evidence, while volume, distribution, and the behavior of leading stocks help determine how much confidence that strength deserves.

He also examined which industries dominated the new-high list. Multiple strong stocks from the same group helped identify where leadership was developing.

This became part of a coherent strategy: a supportive market, leading companies, sound bases, and strong demand at the breakout. New highs off properly formed bases were explicitly part of the “N” in CAN SLIM.

O’Neil’s lesson was to study what successful stocks actually did and let that evidence challenge what felt comfortable.

A new high can be the beginning of a major move. Learn to recognize the conditions that make it worth buying.

View on Substack ↗

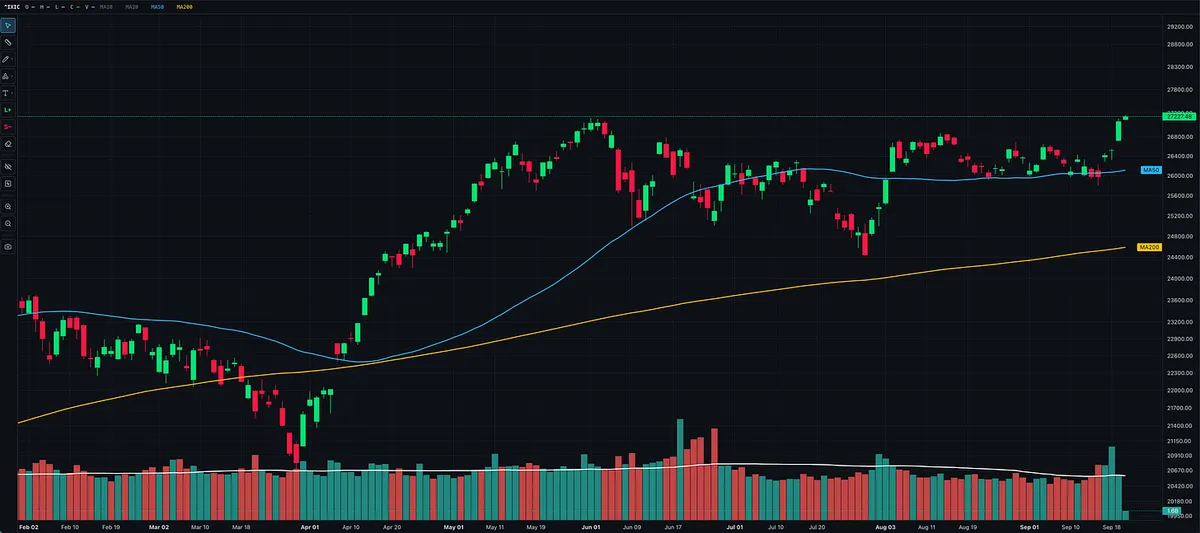
🚨 Attention: The Nasdaq Composite is at an all-time high. That’s telling you something.

After months of sideways trading, the index is pushing above its prior peak and trading above its 50-day and 200-day moving averages. That is a meaningful improvement in price action, and it deserves our attention.

William O’Neil emphasized studying the major indexes’ price and volume action to determine the market’s direction. In How to Make Money in Stocks, he writes: “Learn to accurately read what the market is actually doing each day as it is doing it.”

That means being willing to change our outlook as the evidence changes. If a sideways market has kept us cautious, a move into all-time highs is a reason to reassess. Our opinions have to remain flexible.

Now I’m watching whether the Nasdaq holds this breakout into the close, whether volume expands versus the prior session, and whether leading stocks confirm the strength by breaking out of sound bases on strong volume.

The index is showing strength. Let the quality of the setups and the success of our trades determine how aggressively we respond.

View on Substack ↗

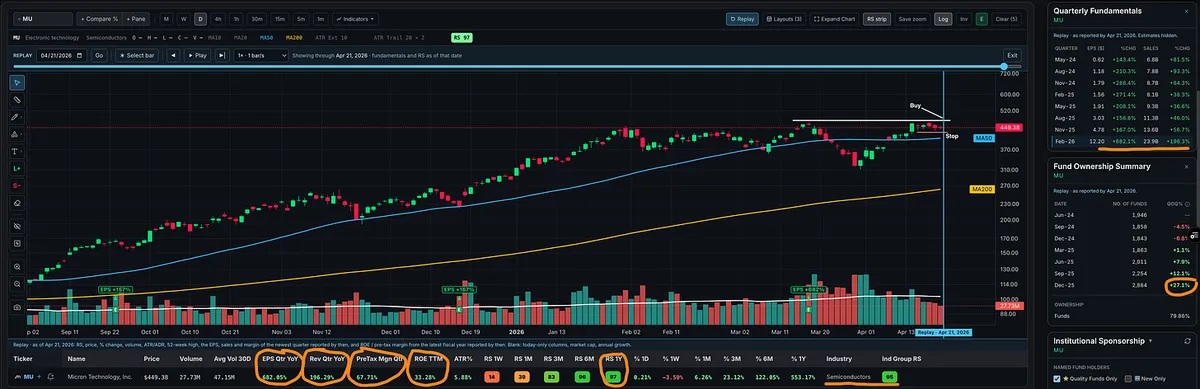
What Did the Numbers Look Like Before the Breakout?

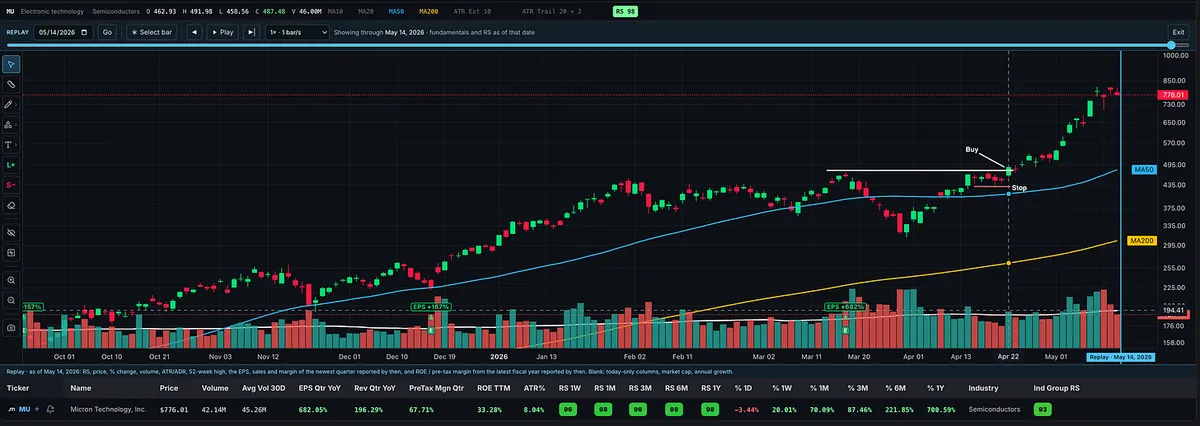
I need to do a better job highlighting some of the features I’ve added to MTS Velocity. One of my favorites is chart replay.

Rewinding a stock’s chart helps you train your eye to recognize the setup before the breakout. You can also see what its earnings, sales, margins, and relative strength ratings looked like at that point in time.

That makes it useful for studying past winners. Go back before the big move and examine the whole picture: the setup, the growth, the profitability, and the relative strength.

Were the characteristics there before the breakout? Would this stock have earned a place on your watchlist?

That’s how I want people to use it: to study what made a stock stand out before the outcome was obvious.

View on Substack ↗

Growth Stocks Took the Wheel Today

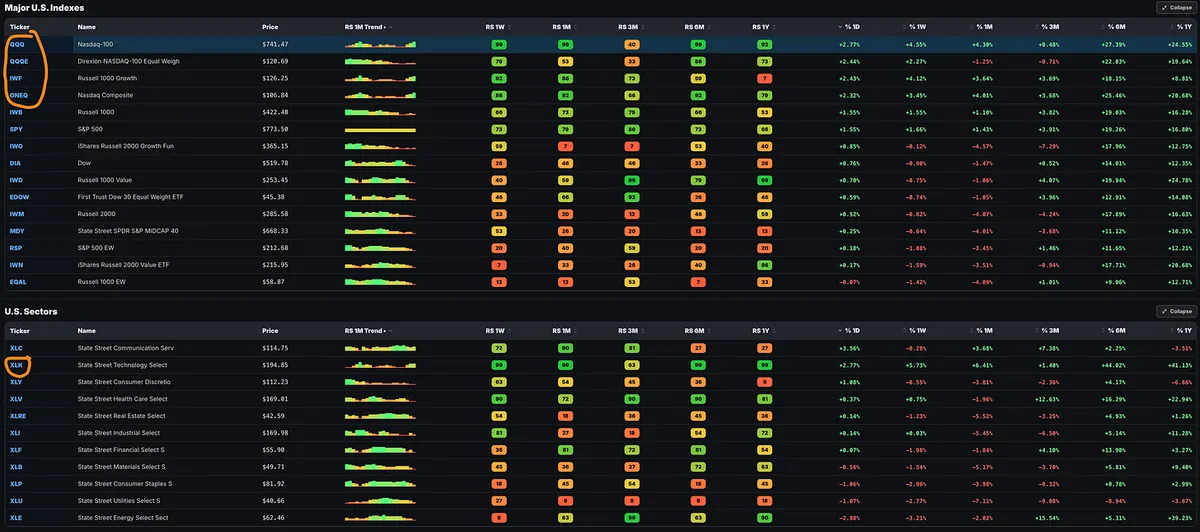
Nice day today, especially in growth and technology. A look at MTS Velocity’s RS Dashboard shows where the strength showed up:

  • Nasdaq-100 $QQQ: +2.77%

  • Nasdaq-100 Equal Weight $QQQE: +2.44%

  • Russell 1000 Growth $IWF: +2.43%

  • Nasdaq Composite ETF $ONEQ: +2.32%

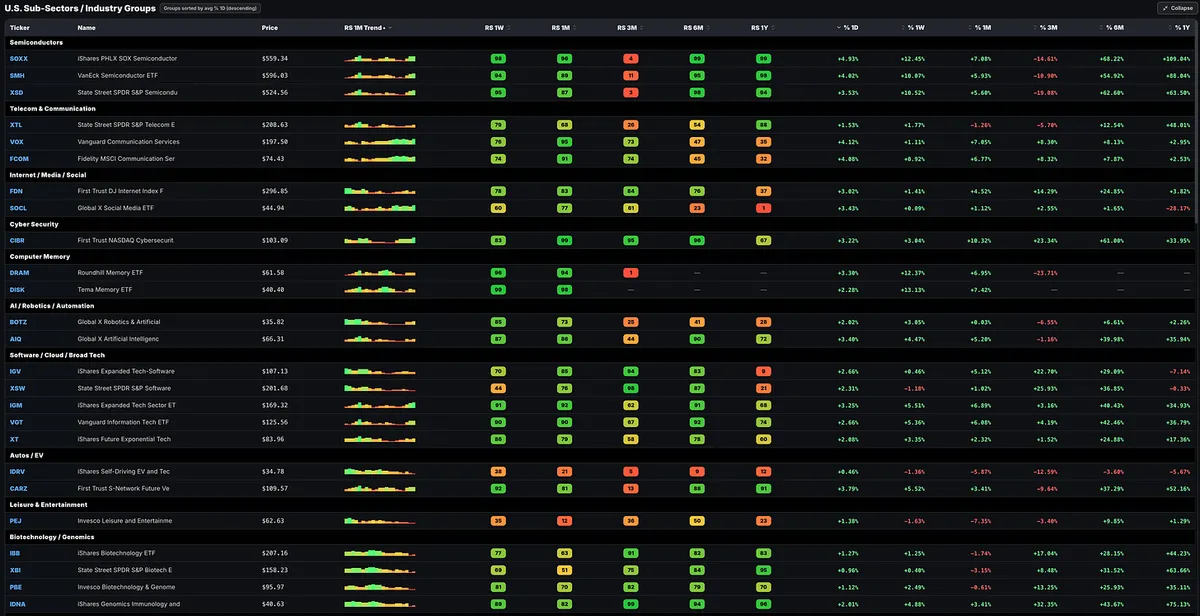
Semiconductors led the industry groups, with $SOXX gaining 4.93% and $SMH 4.02%. Memory, cybersecurity, internet, and software participated too. At the sector level, Communication Services +3.56% and Technology +2.77% led the way.

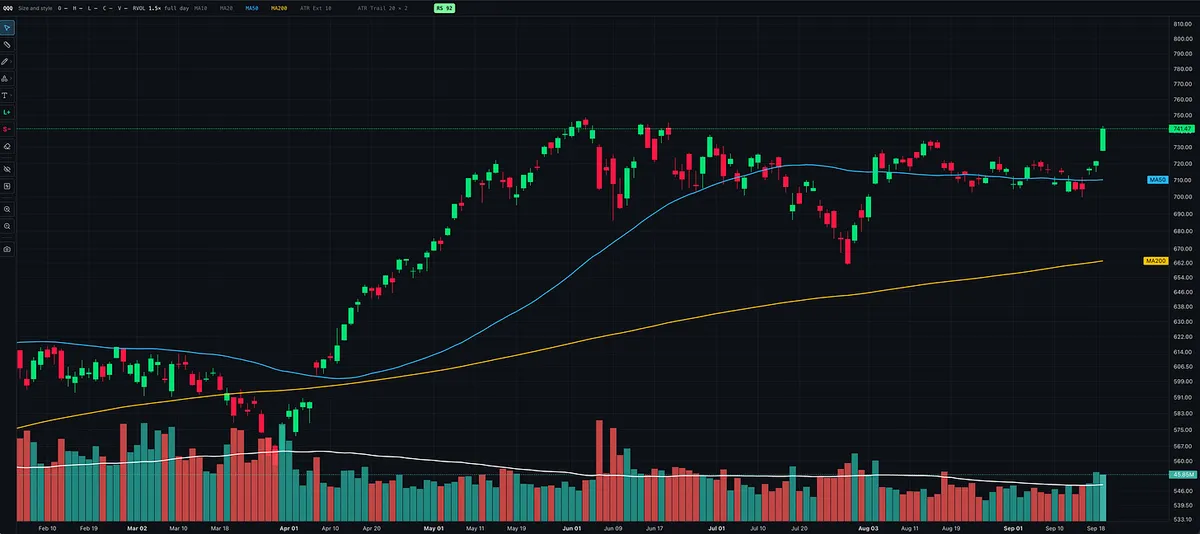
The QQQ chart is looking good: a strong move back toward the top of its multi-month range on above-average volume, putting the prior highs within reach.

Encouraging action in growth. Now I’m watching whether Nasdaq Composite and QQQ can clear those prior highs and whether more individual stocks can complete their bases and break out alongside it.

View on Substack ↗

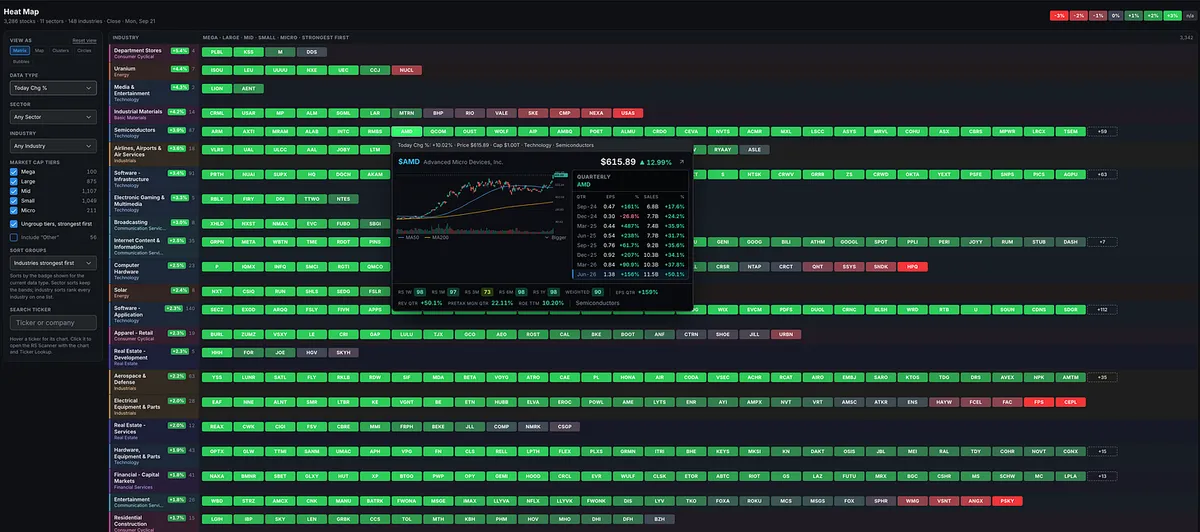
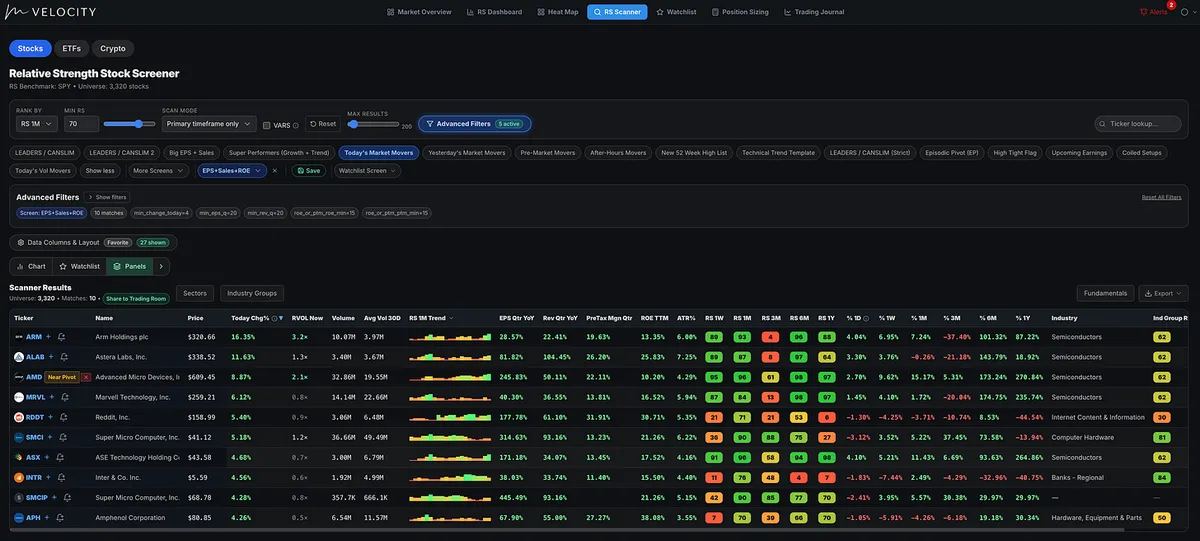
“Hey MTS Velocity, show me today’s market movers with the earnings, sales, and profitability to back up the move.”

Here’s the scan:

✅ Up at least 4% today

✅ 1-month RS rating of 70+

✅ Quarterly EPS growth of at least 20%

✅ Quarterly sales growth of at least 20%

✅ ROE or pre-tax margins of at least 15%

My starting universe: 3,320 NYSE and Nasdaq stocks, already filtered for minimum price, average trading volume, and market cap.

Just 10 matches.

$ARM · $ALAB · $AMD · $MRVL · $RDDT · $SMCI · $ASX · $INTR · $SMCIP · $APH

Leading the list when I ran the scan: ARM +16.35%, ALAB +11.63%, and AMD +8.87%.