Momentum Trading Strategy

Notes

Short lessons on momentum trading, every day.

Every note from Substack, in one place: risk, setups, leading stocks, market conditions and the mindset behind them. Search them, browse by topic, or filter by stock.

Showing 121–140 of 1222 notes

View on Substack ↗

An A+ Setup Doesn’t Automatically Deserve Your Biggest Position

The best chart you’ve seen all month appears. Everything lines up.

Do you take your biggest position?

That depends on two things: the quality of the opportunity and how well your trading has been working.

1. Grade the stock and the setup.

For my CAN SLIM-style trades, the strongest opportunities combine:

  • A healthy market and a leading industry group.

  • A leading stock with high relative strength across multiple timeframes.

  • Strong earnings and sales growth, supported by strong ROE and/or margins.

  • A constructive base, such as a cup with handle or VCP.

  • A precise entry with a logical, tight stop and attractive reward potential.

When those characteristics line up, the opportunity earns consideration for a larger position.

2. Let your results determine how much size you’ve earned.

If your recent trades have been failing, even an A+ setup gets a smaller commitment. A beautiful chart doesn’t erase a string of losses.

If your trades are working and you’re building profits, you can progressively increase exposure. This is the principle behind Minervini’s progressive exposure: build on success and reduce on failure.

Your best opportunities, arriving when your trading is working, are where your largest positions belong.

All within your predetermined risk limits. The distance to your stop still determines how much you can buy for the risk you’re willing to take.

Grade the opportunity. Check your results. Then size the trade.
View on Substack ↗

You Can Filter Yourself Out of Every Winner

You take a loss. Add a rule.

Take another loss. Add another rule.

Eventually, your checklist looks bulletproof. Except nothing qualifies anymore.

It feels like progress because every new restriction would have prevented a past loss. but how many future winners will it eliminate?

During a discussion with Mark Minervini, Tom Basso put it perfectly: “You’ll be 100% reliable on zero trades.”

Minervini followed with a screening example: require a stock to pass 100 parameters, and it can meet 99 of them and still never appear on your screen. That’s why he keeps his screens straightforward and basic.

A screen gives you candidates. You still have to evaluate the trade.

You need clear setup criteria, position sizing, exits, and risk limits. Those rules matter, but a losing trade doesn’t automatically mean your strategy needs another restriction. Even a properly executed trade can lose.

Before adding the next filter, ask:

Does this improve my process across many trades, or would it just have saved me from the last loss?

View on Substack ↗

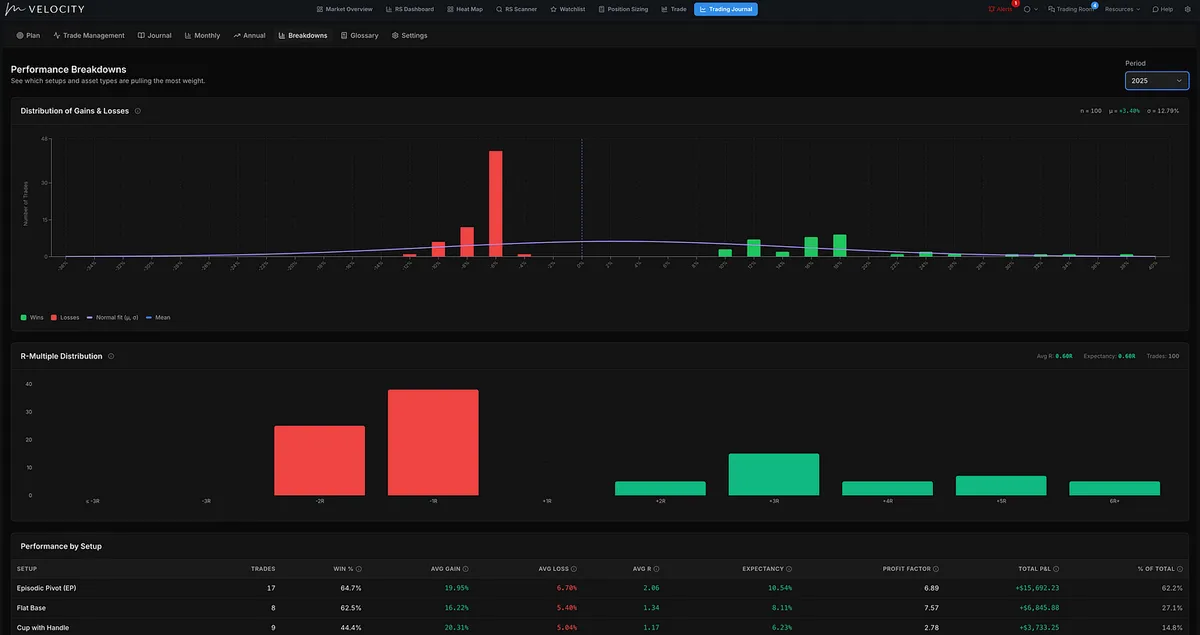
The Trading Metrics That Actually Tell You If You Have an Edge

Most traders know their P&L.

Far fewer know where that P&L actually comes from.

In Diary of a Professional Commodity Trader, Peter Brandt explains that his monthly, quarterly, and annual reviews go beyond the account balance. He tracks how often his trades are profitable, average profit per winner versus average loss per loser, the distribution and win/loss results of different trade categories, and the trades responsible for his net profitability.

That last one is especially important.

Historically, Brandt found that roughly 10% of his trades accounted for his net trading profits. The remaining trades included winners and losers that, collectively, largely offset one another.

His trading plan also expected only about 32% of trades to be profitable in a typical year. Over shorter periods, he noted that the figure could fall to 15%–20%. Those were characteristics of his approach, not targets for everyone to copy.

A low win rate doesn’t automatically mean you have a bad strategy. A high win rate doesn’t automatically mean you have a good one.

What matters is the relationship between how often you win, how much you make when you’re right, and how much you lose when you’re wrong.

Then comes the deeper question: Which setups are producing those results?

A profitable month can hide an unprofitable habit. One category of trades may be making the money while another keeps taking it back.

That’s what your trading journal should help you uncover.

Not simply, “Did I make money this month?”

But:

  • Which setups made the money?

  • What’s my win rate for each setup?

  • How large are my average winners compared with my average losers?

  • Which trades account for most of my profits?

  • Which types of trades repeatedly cost me money?

The purpose of tracking metrics isn’t to collect interesting statistics.

It’s to understand what deserves repeating, what needs improvement, and what may be holding you back.

That’s why I built a Trading Journal and a full suite of analytics into MTS Velocity, included with every paid Momentum Trading Strategy subscription. Not just to help you record your trades, but to help you learn from them.

You’ve already paid for the trading lessons. Don’t leave them buried in your trade history.

View on Substack ↗

Are You Backtesting an Edge or Feeding a Fear?

Sometimes, the obsession with backtesting becomes a search for emotional certainty. If you keep testing because you need a system that removes every loss and every doubt, ask yourself whether you’re improving your edge or postponing the discomfort of being wrong.

No amount of research can eliminate uncertainty. Part of becoming a trader is learning to execute a tested process, accept losses, and keep risk under control. Intelligence and analytical skill alone cannot do that work for you.

The Turtle Traders offer a powerful example. Richard Dennis and William Eckhardt taught participants the same core trend-following framework, yet their results differed. Participants did not follow the methods they were taught. Others, including Jerry Parker, built enduring trading careers from that foundation.

As Richard Dennis told Jack Schwager in Market Wizards:

“I always say that you could publish trading rules in the newspaper and no one would follow them. The key is consistency and discipline.”

This applies to systematic trading, too. A well-designed system can reduce emotional decision-making, but adopting one does not automatically resolve your relationship with uncertainty. You can still skip valid signals, increase your size impulsively, override exits, or abandon a strategy during a drawdown it was designed to withstand.

Backtesting can be a valuable tool, but it cannot remove the emotional demands of trading. If you keep running tests in search of certainty, more research can become a way to postpone confronting your fear of losses or being wrong. You may improve the backtest without improving your ability to execute when real money is on the line.

At some point, you have to put as much work into yourself as you put into your backtesting.

Quoting Momentum Trading StrategyToo Much Backtesting, Not Enough Modeling I see endless social media posts about backtesting. I see far fewer about modeling. Yet studying exceptional stocks and successful traders was foundational to several of the approaches everyone loves to quote. Mark Minervini makes that distinction. He describes factor modeli…
View on Substack ↗

Too Much Backtesting, Not Enough Modeling

I see endless social media posts about backtesting. I see far fewer about modeling. Yet studying exceptional stocks and successful traders was foundational to several of the approaches everyone loves to quote.

Mark Minervini makes that distinction. He describes factor modeling as studying the biggest winners and identifying their common characteristics, much like studying gold medalists to understand what they did similarly. His criticism targets testing endless possibilities and backing into whatever historical relationship produces an attractive result: “That’s called curve fitting.”

William O’Neil built CAN SLIM from studying the characteristics of past stock market winners. Minervini describes his own approach as modeling success, studying both exceptional stocks and legendary traders. Kristjan Kullamägi built a database containing thousands of historical setup examples, examining the charts, catalysts, and conditions behind the moves.

Dr. Van Tharp approached modeling through the trader: how successful people think, research, manage risk, and size positions. He also recognized the value of testing. In Trading Beyond the Matrix, he writes: “Backtesting is fine, but some people do way too much.”

You can spend years optimizing settings and still struggle to turn that research into actual profits. An impressive historical equity curve does not automatically give you the judgment or discipline to execute when money is on the line. Backtesting has its place, but it cannot do every part of your development for you.

William O’Neil, David Ryan, Mark Minervini, Dan Zanger, and Kristjan Kullamägi share an important thread: learning from successful traders and studying the market’s past winners, then refining their approach through experience with real capital. Ryan learned directly from O’Neil, and Zanger describes O’Neil’s teaching as a turning point in his development. Their careers demonstrate the value of studying excellence and putting those lessons into practice.

Athletes study champions. Musicians study masters. Traders can follow the same principle: study successful examples, understand the decisions behind them, examine failures, and test what you learn, but if you’re endlessly testing strategies without modeling excellence or learning to execute, you may be perfecting the research instead of developing the trader.

If you’ve spent hundreds of hours backtesting, how many have you spent modeling the stocks and traders you want to understand?

View on Substack ↗

The Entry Is Simple The Hard Part Is You

Someone asked how I manage fast-moving stocks when timing the entry and knowing when to sell can feel so difficult.

My entry and management tactics are basic: a defined entry, a stop, trailing higher lows, and selling some into strength. There’s nothing revolutionary about them. Knowing the tactics and executing them under pressure are two different skills.

I believe a big part of my improvement comes from staying calm at the entry and throughout the trade. That comes from experience. I’ve made almost every mistake in the book, and a stock moving fast no longer gets me nearly as excited as it once did.

I can sell some while the stock is still climbing without needing to squeeze out every last dollar. I can take a loss without needing to prove I was right. I still feel emotions, but they have much less influence over my decisions.

If a stock runs 150%, I can be perfectly content capturing a 30% gain. I’d rather take a trade with 3–4% initial risk and capture 30% than accept 40% risk trying to capture the entire 150%.

I don’t need the whole move. I need a worthwhile return for the risk I take, and the discipline to execute my plan.

View on Substack ↗

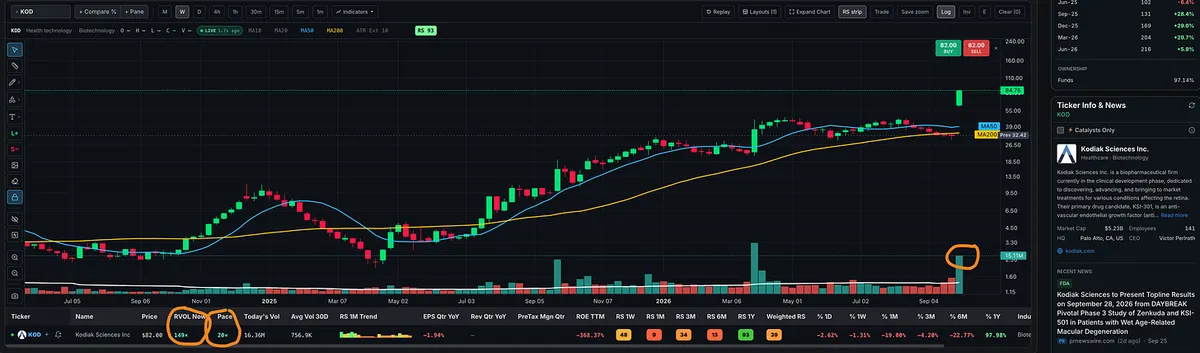
KOD Exploded 148% Here’s Where the Entry Was

I get a lot of questions about intraday entry tactics and the opening range breakout (ORB), so here’s a quick example from my playbook. How do you find a stock like this early, and where do you actually buy?

In this short video, I walk through $KOD’s one-minute opening range breakout, the entry concept Kristjan Kullamägi describes as buying the opening range highs. Dan Zanger also teaches opening range breakouts and has influenced both Kullamägi’s trading and my own.

Using MTS Velocity, I explain how to spot the premarket mover, check the catalyst, and identify an entry above the first minute’s high with an initial stop at the day’s low. Then I cover the higher lows, taking partial profits into strength, and ways to manage the remainder.

Less than three minutes: finding the stock, defining the entry, and planning the risk.

Want to go deeper? I cover this tactic in more detail in Module 5 of the Momentum Trading Strategy Course.

Watch the video on Substack →
View on Substack ↗

Another Monster Move in Biotech

$KOD with a huge gap up and massive volume today. Another explosive biotech move that brings $MRNA to mind.

Today’s catalyst: positive Phase 3 results from Kodiak’s DAYBREAK trial for wet age-related macular degeneration. Clinical results can change expectations for a company very quickly, and the chart shows that repricing in real time.

Looking further ahead, I think AI will help accelerate drug discovery and development, potentially opening the door to more biotech breakthroughs. If those advances translate into successful treatments, we could see more massive moves like this in the years ahead.

Biotech is an area worth watching.

View on Substack ↗

He Sold His Winner to Keep His Loser Alive

Bernard Baruch didn’t just lose money on a bad trade. He sacrificed a profitable investment to keep funding it.

In My Own Story, he recalls buying coffee heavily on margin in 1905. When prices started falling, a respected coffee merchant advised him to hold on. Baruch listened as the losses mounted and profits from years of successful trading began disappearing.

Meanwhile, his Canadian Pacific shares had risen substantially. Instead of closing the losing coffee position, he sold those profitable shares to raise more margin money. Eventually, all his Canadian Pacific stock was gone, and coffee was still falling.

By his account, the experience cost him $700,000 or $800,000. He suffered nervous indigestion for days afterward.

He sold what was working to defend what wasn’t.

But the most important part of the story is that Baruch already knew better. He understood the temptation to sell a winner because taking a profit feels easier than admitting a loss. He knew the correct response was to let go of the bad position rather than sacrifice the good one. He did the opposite anyway.

That’s the uncomfortable lesson: knowing your trading rules is not the same as following them when money and ego are involved.

Taking profits isn’t the mistake. Selling a healthy position simply to keep an unhealthy one alive is. At that point, you’re no longer evaluating each trade on its merits. You’re reorganizing your account around the one mistake you refuse to accept.

Baruch resolved never again to take a major risk in something he didn’t understand. He also made cutting losses quickly an explicit rule.

Don’t make your winners pay for your refusal to admit you’re wrong.

View on Substack ↗

Train Your Eye to See This

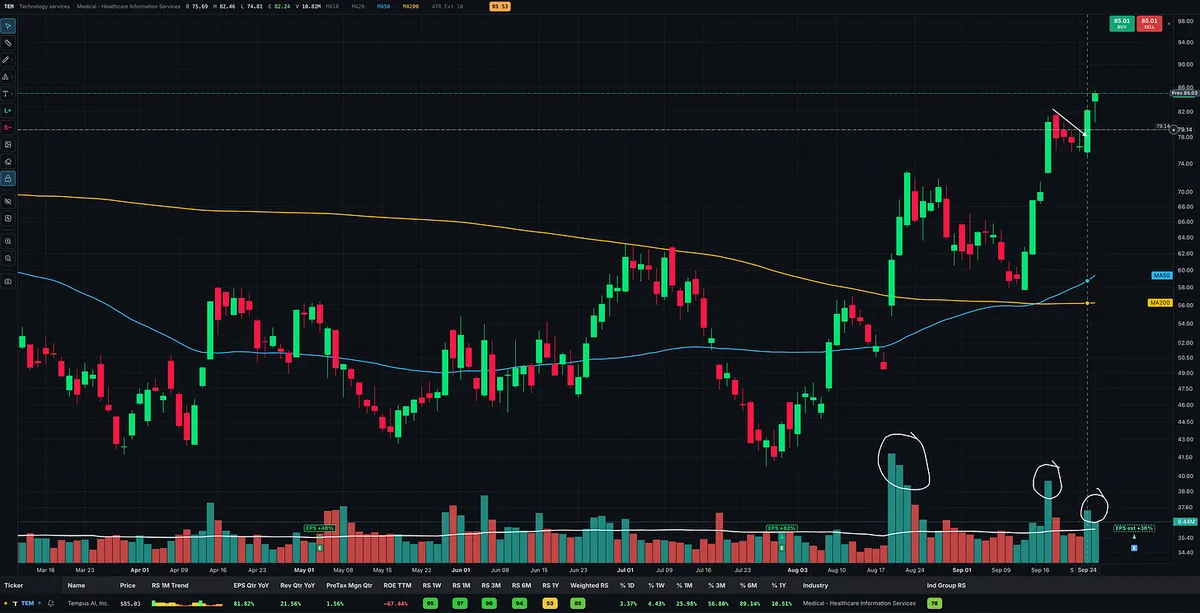
I post charts like TEM because this is the price and volume action you need to learn to recognize. Big, explosive advances on heavy volume, followed by controlled pullbacks or sideways pauses as volume dries up. Then another strong push that more than recovers the ground lost during the pullback.

Compare the character of the advances with the character of the declines. The strongest moves higher show expanding volume and meaningful price progress. The retreats attract less volume, and price holds enough of its gains to build a series of higher highs and higher lows.

That fading activity suggests selling pressure is easing as the stock pauses.

Strong demand on the way up, quieter action on the way back, and renewed demand that carries price higher again.

View on Substack ↗

Think Today’s Market Is Different? Read This

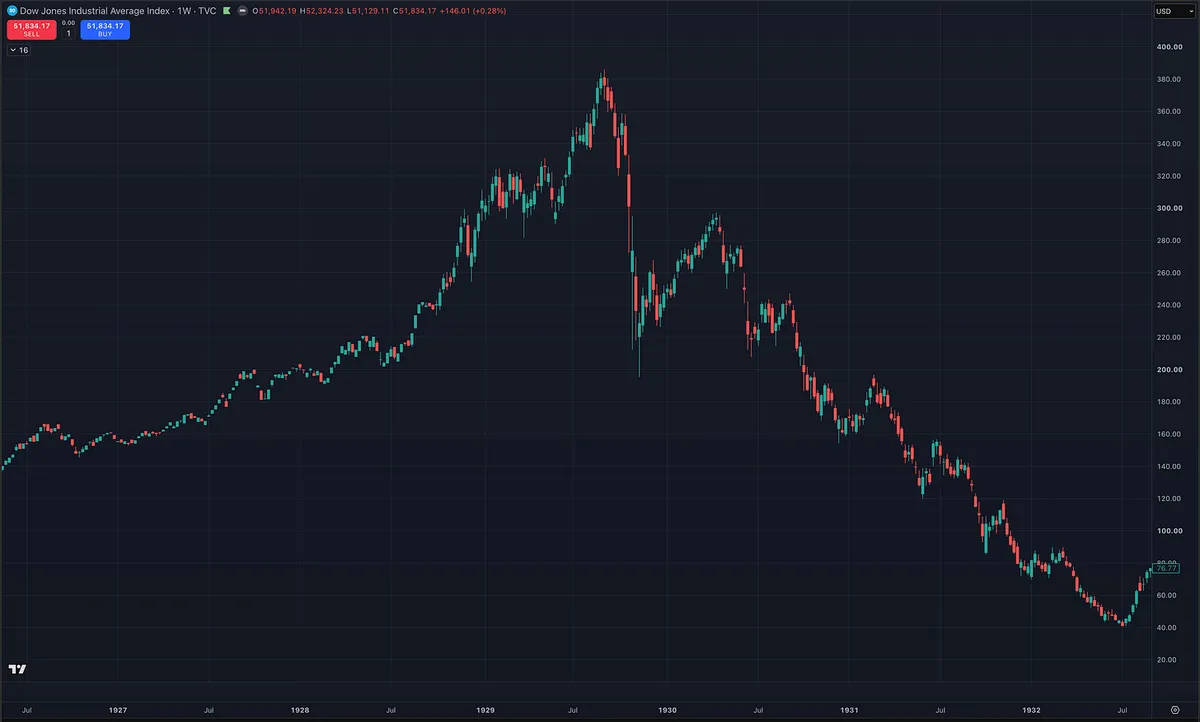
Before the 1929 crash, Gerald Loeb noticed something familiar: his leading stocks were starting to act badly.

He sold them and moved into other names. Then those started deteriorating too. Eventually, he looked for something strong to buy and couldn’t find anything.

The market was pushing him toward cash, one failed opportunity at a time.

Loeb later placed the market’s top on September 3, almost two months before the Great Crash. By his own account, he was mostly out when it arrived.

The lesson isn’t that you should be able to predict the next crash. It’s that you don’t need to predict a crash to recognize when your stocks have stopped behaving well.

That is the same lesson I emphasize today. Watch the leaders. Watch what happens after you buy. When leading stocks deteriorate, replacement ideas keep failing, and your screens stop producing quality setups, stop forcing trades.

You don’t have to find something to buy just because you have money available.

Yes, technology has changed. But faster execution doesn’t turn a broken leader into a healthy stock. More information doesn’t make a failed breakout successful. And a sophisticated platform won’t protect you from refusing to take a loss.

Loeb was learning these lessons nearly a century ago. He later wrote The Battle for Investment Survival, a title that tells you something about how those experiences shaped his thinking.

Recognize when the market is no longer rewarding what you’re doing, protect your capital, and be ready when conditions improve.

Before dismissing an old trading lesson, make sure you aren’t repeating the mistake that taught it.

View on Substack ↗

The Biggest Down Day Can Be Your Warning

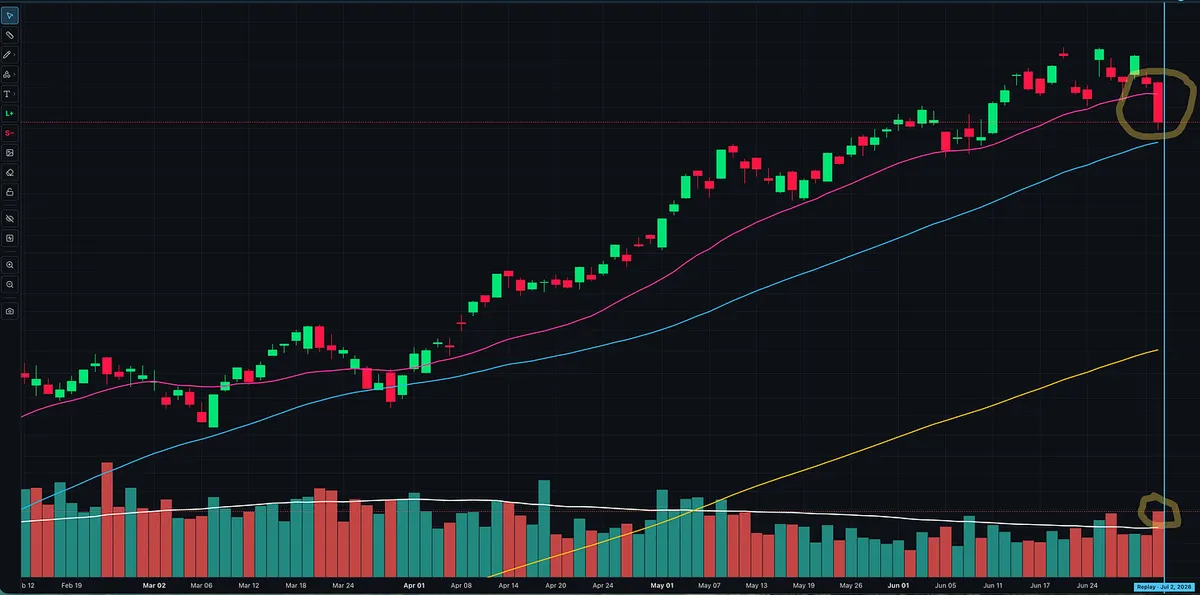
After a strong advance, one warning sign gets my attention: the biggest down day or week of the move, accompanied by the heaviest volume.

The stock may have spent weeks climbing steadily, with controlled pullbacks and quick recoveries. Then selling suddenly becomes more aggressive than anything seen during that advance.

That combination can signal institutional distribution. A stock that previously absorbed selling is now struggling under it.

“It’s still well above where I bought it” does not explain away abnormal action.

One bar doesn’t prove the final top is in. But it deserves a reassessment of the position: where the stock closes, whether important support breaks, and how the action compares with its previous pullbacks.

If a sell rule is triggered, I act. I don’t move the standard simply because the stock has made me money or because I still like its story.

A big winner can remain a great company while becoming a poor trade to hold.

You don’t need to prove the top is in to respond to a change in character.

View on Substack ↗

A Hot Group Doesn’t Make Every Stock a Leader

“I missed the leader. I’ll buy this one. It hasn’t moved yet.”

That’s how you can identify the right industry group and still buy the wrong stock.

Strong groups often have a few stocks setting the pace. Those are the names I want to study first: strong earnings and sales, leading relative strength, and constructive price-and-volume action.

The stock that looks cheaper may have weaker growth, more overhead supply, or less demand. Sharing an industry with a big winner doesn’t mean it deserves the same buying interest.

“It hasn’t moved yet” is not evidence that it will catch up.

A later breakout isn’t automatically a laggard, but that stock still needs to qualify on its own. I want evidence of strength, not a discount to another stock’s performance.

And identifying the leader doesn’t give me permission to chase it. If it’s extended, I wait for another qualifying entry or look for a different stock that meets my criteria.

Find the leading group. Find the leading stocks in that group. Then wait for your entry.

View on Substack ↗

Your P&L Can Hide Bad Trading

A profitable month doesn’t mean everything you’re doing is working. Some of your trades may be making the money while others quietly take it back.

Peter Brandt shows this in Diary of a Professional Commodity Trader. During the five-month period he reviewed, Brandt reported $5,473 in net profits from 68 trades per $100,000 trading unit. But underneath that total, major-pattern completions earned $6,089, while just eight “miscellaneous” trades lost $3,960.

Knowing he made money was not the same as understanding how he traded.

That’s why Brandt’s monthly, quarterly, and annual reviews went beyond the account balance. He tracked how often his trades were profitable, average profit per winner versus average loss per loser, how his trades were distributed across categories, and the win/loss results within each category.

Those measurements help you ask better questions:

  • Are you losing too often, losing too much when you’re wrong, or making too little when you’re right?

  • Are you repeatedly taking trades in a category that is subtracting from otherwise good results?

  • Are those losses part of executing your strategy, or are they coming from decisions outside your plan?

A losing trade is not automatically a bad trade. A profitable trade is not automatically a good one.

He also tracked what he called “net bottom liners.” Historically, roughly 10% of his trades accounted for his net trading profits, while the remaining trades effectively offset one another. That was a characteristic of his trading, not a percentage everyone should expect. But it reveals why counting winners alone can miss what actually drives performance.

The review also exposed behavior. Brandt acknowledged that some minor-reversal trades involved patterns shorter than his own guidelines allowed. His journal was revealing where his decisions had drifted outside his plan.

Despite decades of experience, he said keeping and writing about his trades forced him to examine his process more deeply than ever before.

That is why I built a Trading Journal and full Trading Analytics inside MTS Velocity. Recording what you bought and sold is the starting point. The real value comes from investigating what deserves repeating, what needs improvement, and what may be holding you back.

Start putting your own trading under the microscope.

View on Substack ↗

You Don’t Need Margin to Make Big Returns

It’s easy to assume that growing your account faster requires more buying power.

But a powerful stock can make a substantial move without you borrowing a dollar.

Individual stocks can advance far more than the major indexes over the same period. Selecting those opportunities gives you a way to pursue exceptional performance with the capital you already have.

The other half of the equation is keeping failed trades small.

A 20% gain against a planned 6% risk is approximately a 3.3R winner. With a position representing 20% of your account, that translates to a 4% account gain against 1.2% planned account risk.

No borrowed money required.

Margin can amplify results in both directions. It doesn’t improve the stock, fix a poor entry, or create an edge. One of the most dangerous mistakes a beginner can make is adding borrowed money before developing consistent execution and disciplined risk management.

Learn to manage the capital you have before borrowing more to magnify the results.

View on Substack ↗

The “Bargain” Can Be Your Most Expensive Trade

A stock near its 52-week high with a high P/E gets dismissed as “too expensive.”

A stock down 60% gets called “a bargain.”

But the first may be attracting buyers because its business is accelerating. The second may be falling because its prospects are deteriorating.

A lower price doesn’t automatically mean better value.

Minervini makes this point in Trade Like a Stock Market Wizard: many exceptional growth stocks looked expensive before their biggest advances. Investors were willing to pay a premium for rapid growth.

Meanwhile, buying a stock simply because it has fallen creates a dangerous trap. If it drops again, it looks even cheaper. The reason you bought becomes the excuse for staying.

I want strong earnings and sales, leading relative strength, and constructive price and volume action. Then I need a qualifying entry with defined risk.

Don’t let a high P/E alone scare you away from a potential winner.

View on Substack ↗

Concentrate on Your Best Ideas. Control What You Risk

“Diversification is a hedge for ignorance.”

William O’Neil said that in Market Wizards. His reasoning was straightforward: own a manageable number of carefully selected stocks, understand them, and watch them closely.

Minervini reinforces the same principle. If you have a demonstrated edge, spreading your capital across too many positions can dilute the contribution of your best ideas.

But concentration makes position sizing and sell discipline even more important.

A stock can deserve a meaningful position without deserving an unlimited amount of risk.

For example, allocating 20% of your account to a stock with a stop 5% below your entry puts approximately 1% of your account at planned risk.

Concentrate your capital where you have an edge. Size your risk so you can withstand being wrong repeatedly.

View on Substack ↗

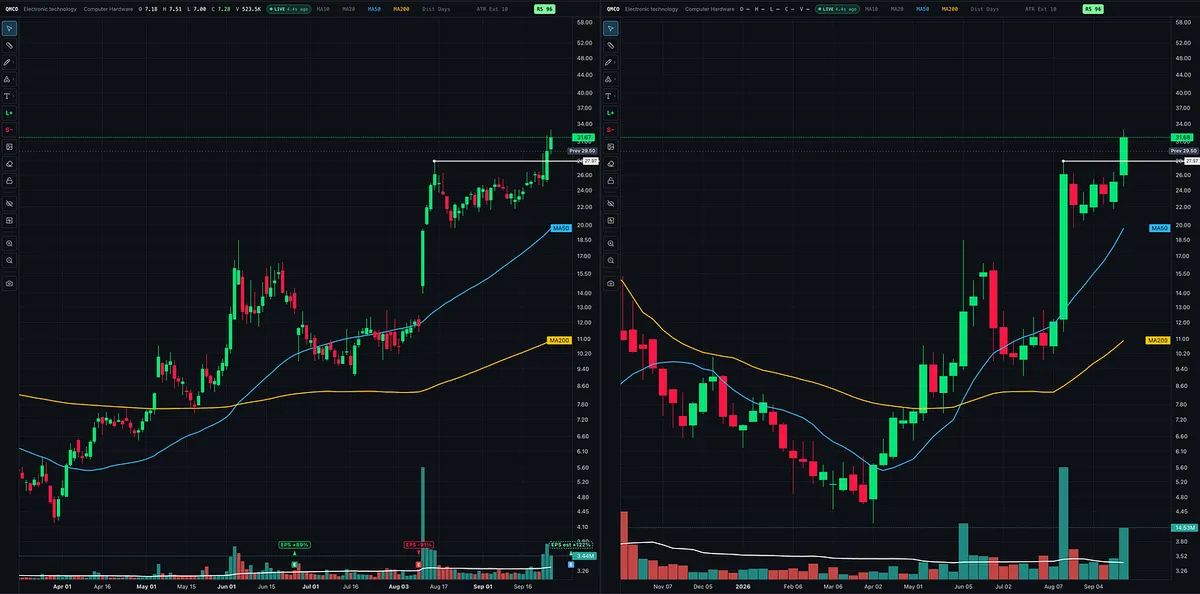
QMCO: 125% in One Week, Then a High, Tight Flag 👀

A 125% surge in one week, followed by five weeks of sideways consolidation. Now QMCO is breaking above the flag.

That is the structure behind the rare high tight flag: an explosive advance, followed by a relatively brief consolidation that holds much of the gain before the next move higher.

View on Substack ↗

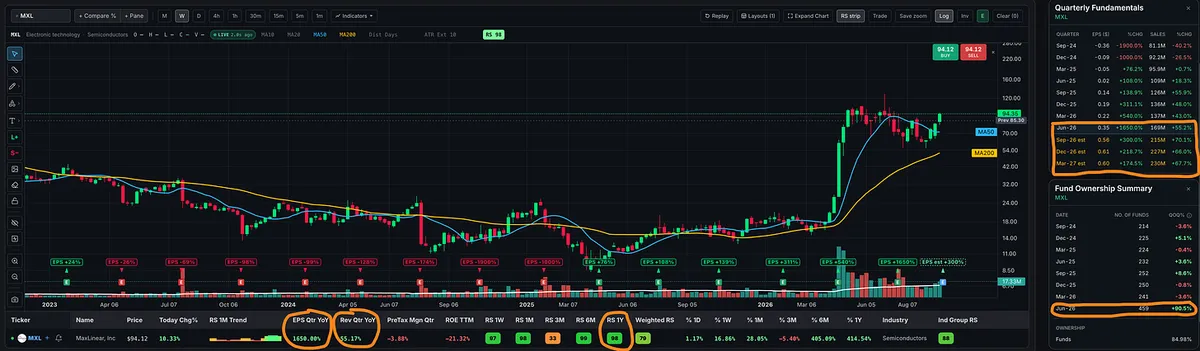
Hello Again, $MXL 👀

Making a comeback, I see.

Up +10% today, sporting a 98 Relative Strength rating, and working back up the right side of its consolidation. Latest quarterly sales growth: 55%. BIG jump in fund ownership.

View on Substack ↗

The Warnings Are There, but So Is the Strength

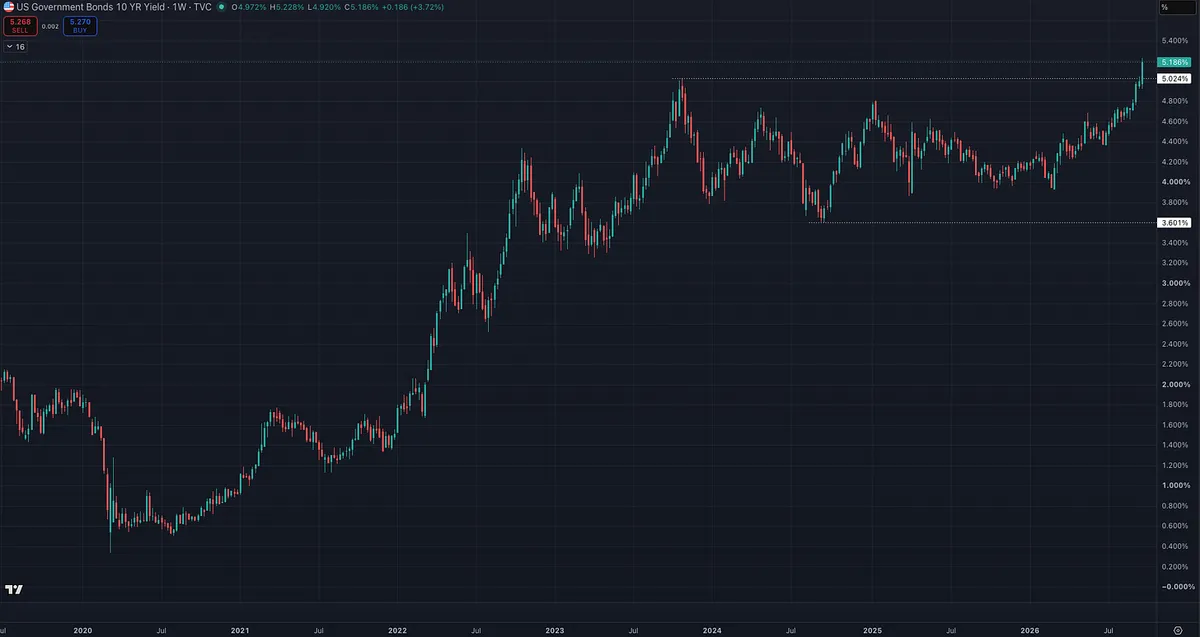
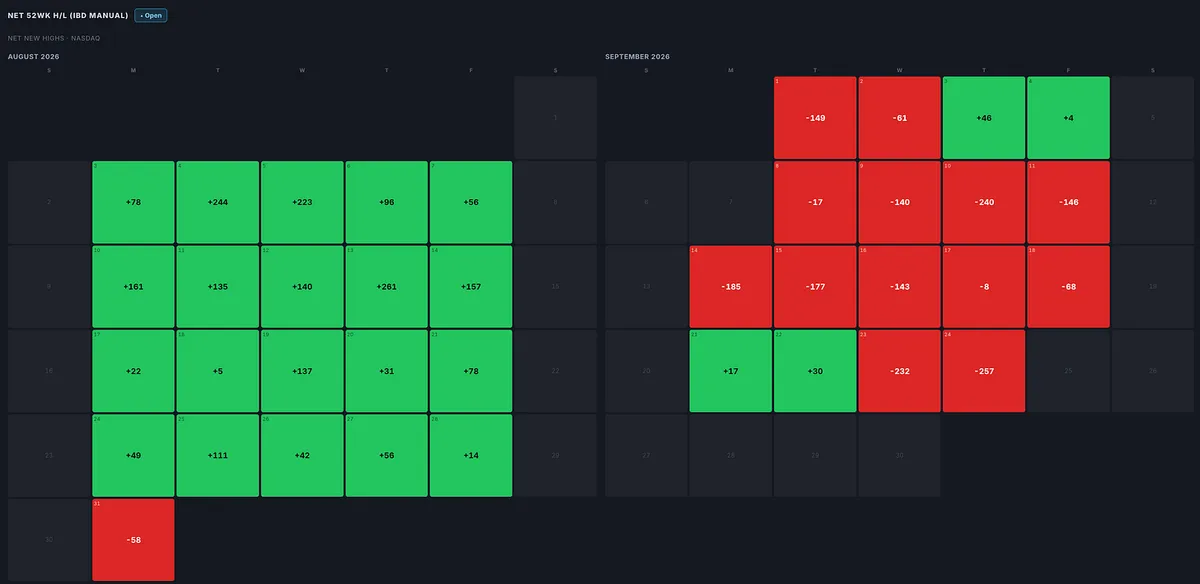
Net new lows and the percentage of stocks above key moving averages are showing some of the weakest readings I’ve seen since March. Stocks falling 4% have substantially outnumbered those rising 4%. Add a 10-year Treasury yield around 5.2%, and there are plenty of reasons to approach this market cautiously.

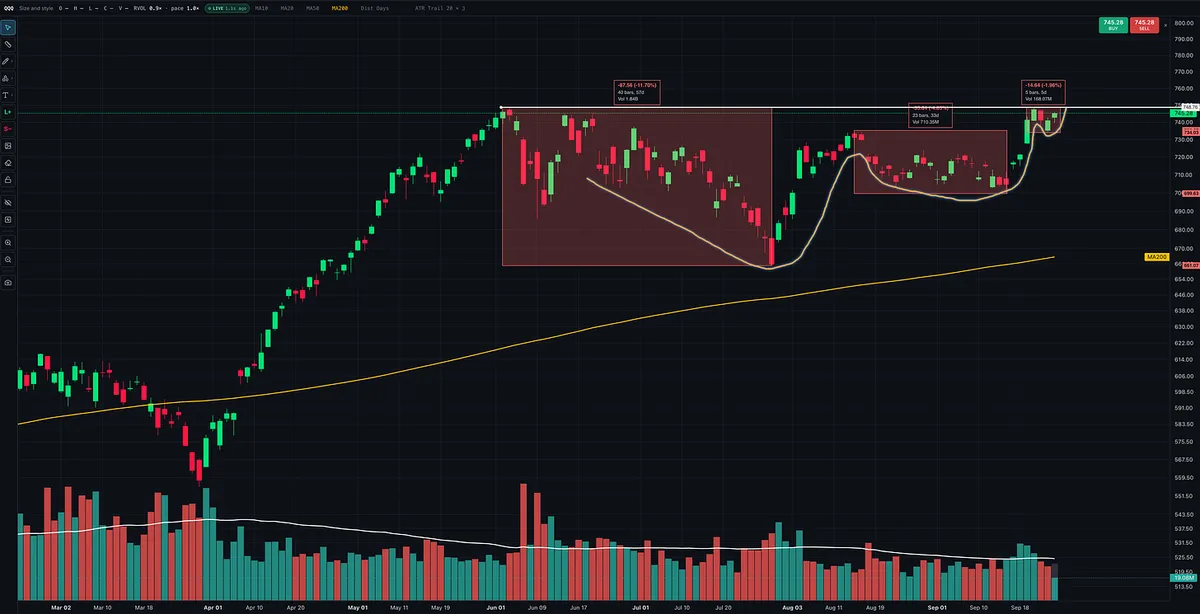
Yet look at QQQ and the Nasdaq Composite.

Both are sitting near their highs. On QQQ, successive pullbacks have narrowed from roughly 12% to 5% to 2%, creating VCP-like tightening up the right side of the chart. Meanwhile, leaders such as AMD continue to show strength.

The internal weakness is real, but so is the resilience in the leaders.

O’Neil explained that a market can continue advancing under the leadership of fewer, stronger stocks even as breadth deteriorates. Weinstein emphasized that weakening participation can warn of trouble before it becomes obvious in the averages. Those observations help explain why a constructive index chart and a weak broader market can exist at the same time.

The mistake would be letting either observation erase the other. QQQ holding near its highs doesn’t make the breadth deterioration irrelevant. Weak breadth doesn’t establish when the strongest stocks will stop advancing.

My approach is to respect the leading stocks and the indexes that reflect their strength. We are growth stock investors and momentum traders. We do not need every part of the market to be doing well to find opportunities in our stocks. Leadership is selective, and substantial gains can be concentrated in a relatively narrow group.

If stocks are setting up, breaking out, and following through, I will let those results help determine my exposure. The 10-year, the Dow, the Russell, and broader participation all provide context, but they do not automatically overrule constructive action in the stocks I trade. Price remains my most important indicator.

Will I remain aware of the poor breadth and rising yields? Absolutely.

But those warnings alone will not keep me on the sidelines while leading stocks continue to offer valid entries and reward them with progress. Successful breakouts and an expanding list of quality setups would support becoming more aggressive. Failed breakouts and deterioration in the leaders would support becoming more defensive.

Does participation improve around the leaders, or does the broader weakness eventually reach them?

That is what I’m watching, and I’ll adjust my exposure as the evidence develops.