Train Your Eye to See This
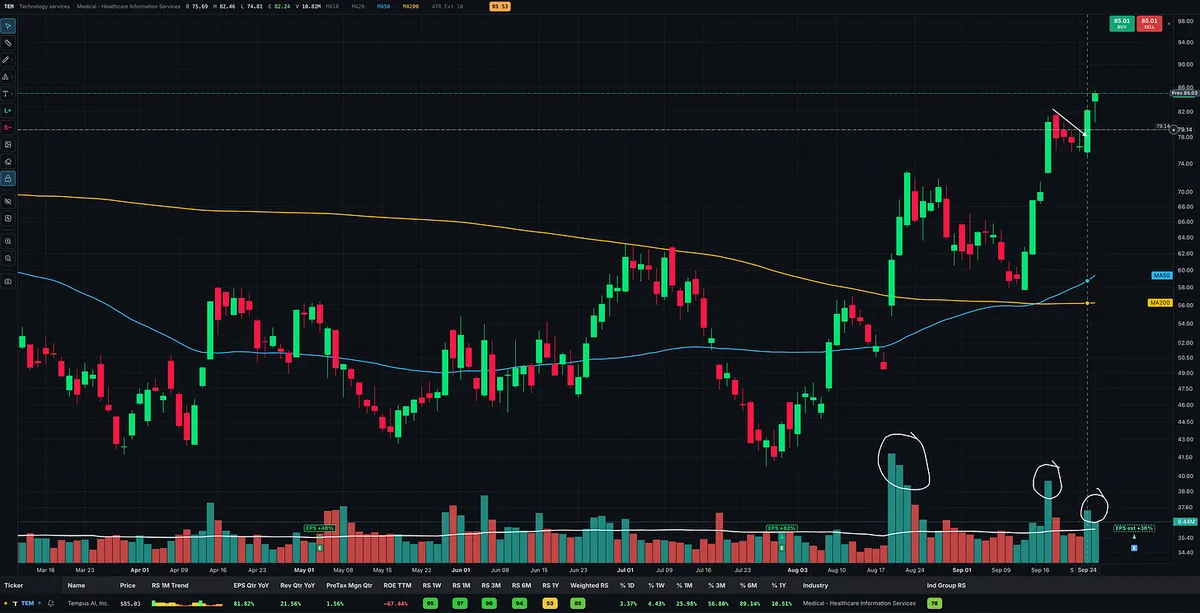
I post charts like TEM because this is the price and volume action you need to learn to recognize. Big, explosive advances on heavy volume, followed by controlled pullbacks or sideways pauses as volume dries up. Then another strong push that more than recovers the ground lost during the pullback.
Compare the character of the advances with the character of the declines. The strongest moves higher show expanding volume and meaningful price progress. The retreats attract less volume, and price holds enough of its gains to build a series of higher highs and higher lows.
That fading activity suggests selling pressure is easing as the stock pauses.
Strong demand on the way up, quieter action on the way back, and renewed demand that carries price higher again.