Momentum Trading Strategy

Notes

Short lessons on momentum trading, every day.

Every note from Substack, in one place: risk, setups, leading stocks, market conditions and the mindset behind them. Search them, browse by topic, or filter by stock.

Showing 861–880 of 1230 notes

View on Substack ↗

Stanley Druckenmiller on Why Trend Beats Ego

Lots of great wisdom from Stan Druckenmiller in his recent interview with Morgan Stanley.

One line stood out:

“I think contrarianism is overrated.”

He doubles down with:

“Soros used to say the crowd's right 80% of the time. You just can't be caught in the other 20% because you can get your head handed to you.”

And then makes it simple:

“I don't care if a trade is crowded, if I think the thesis is right and the trend is with me.”

This is one of our core rules:

Follow the Trend.

Not because it feels good. Not because it is popular.

Because probability favors alignment over ego.

View on Substack ↗

The 50/80 Rule and Why You Must Never Fall in Love With a Stock

I once heard Mark Minervini say something that every trader should remember.

50 percent of past leaders once they top will go down 80 percent.

80 percent of past leaders will go down at least 50 percent.

Think about that.

The biggest winners of the bull market. The strongest charts. The companies with explosive earnings and dominant narratives.

Half of them will eventually collapse by 80 percent. Most will lose at least half their value.

This is why you cannot fall in love with your stocks.

It always starts the same way.

You admire the company. You believe in the product. You made great money in it before.

Now it feels familiar. Personal. Safe.

That is when it becomes dangerous.

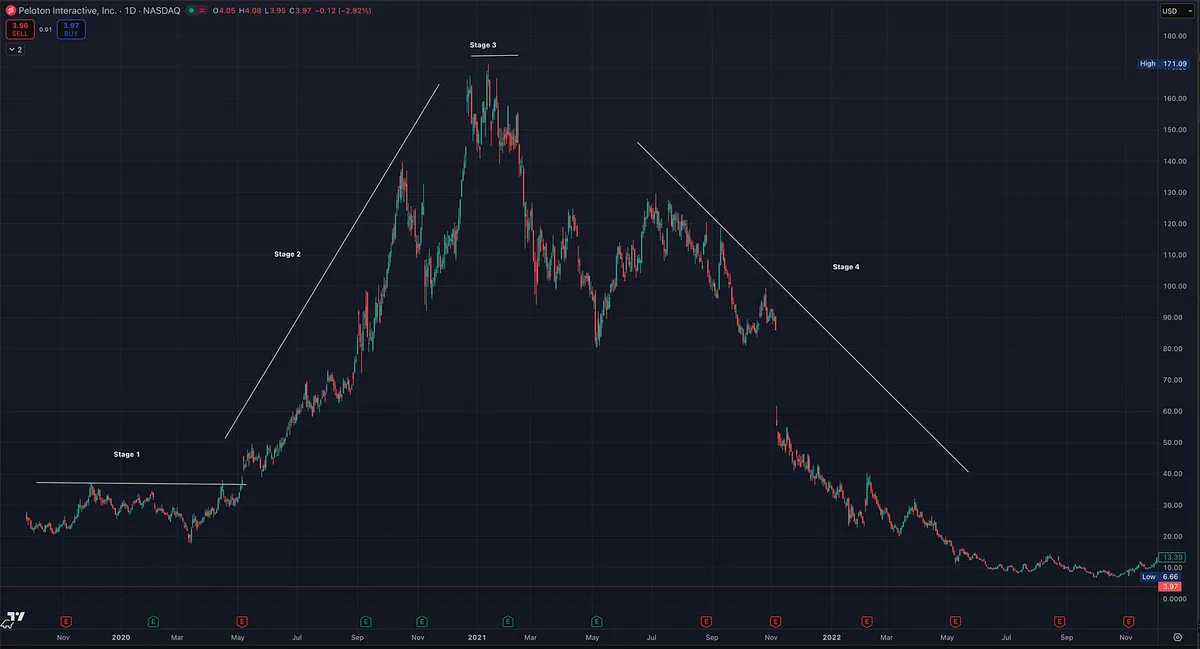
Stan Weinstein outlined the four stages of a stock cycle in Secrets for Profiting in Bull and Bear Markets . Stage 2 is where fortunes are made. Institutional accumulation drives powerful advances. That is where you press your advantage.

But Stage 4 is different.

Stage 4 is distribution. Stage 4 is broken structure. Stage 4 is long, grinding declines that destroy capital and confidence.

Once a stock transitions from leadership to deterioration, the risk profile changes completely.

If earnings and sales momentum slows. If relative strength fades. If price breaks key support. If rallies become weaker and selling becomes heavier.

You get out.

There is no way to know how far down it will go.

That is the illusion that traps investors.

They wait for it to bounce. They wait to get back to even. They tell themselves it cannot fall much further.

But a stock down 30 percent can go down 50 percent. A stock down 50 percent can go down 80 percent.

A 50 percent decline requires a 100 percent gain just to recover. An 80 percent decline requires a 400 percent gain.

The market does not care how great the company is. It does not care how much you love the story. It does not care what price you paid.

Leaders lead on the way up and they can devastate portfolios on the way down.

Great traders are not loyal to stocks. They are loyal to their process.

When the characteristics change, they act.

Love your craft. Love your discipline.

But never fall in love with your stocks.
View on Substack ↗

Why I Don’t Care About the P/E Ratio

P/E is simply how much investors are paying for each dollar of earnings.

That’s it.

In the late 1990s, Yahoo traded at 938x earnings. By 2000, it traded at 1700x earnings.

The stock went up roughly 8000%.

High P/E did not stop it.

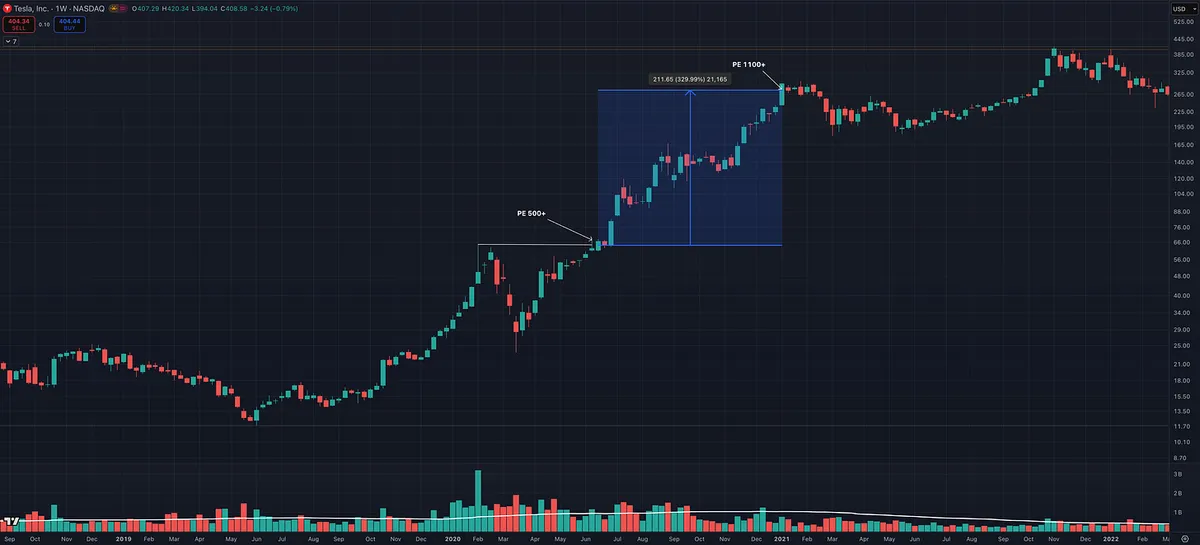
Now look at Tesla.

In 2020, Tesla traded above 500x earnings. It later pushed above 1100x earnings.

The stock kept going higher.

If you waited for it to look cheap, you missed the move.

Here’s what most investors miss:

In growth stocks, multiple compression is a symptom of slowing expectations.

Growth decelerates. Institutions distribute. The P/E contracts.

And that’s when retail investors buy it because it looks “cheap.”

That is how you get stuck in Stage 4 decline or dead money.

Low P/E does not create demand.

High P/E does not prevent it.

Price moves when growth accelerates and buyers compete.

Valuation comfort is not a catalyst.

Demand is.

View on Substack ↗

What Growth Momentum Traders DON’T Do

There are thousands of posts about what traders should do.

Let’s talk about what we do not do.

We do not sit through massive Stage 4 declines. We do not average down in broken stocks. We do not marry positions. We do not wait decades to get back to even.

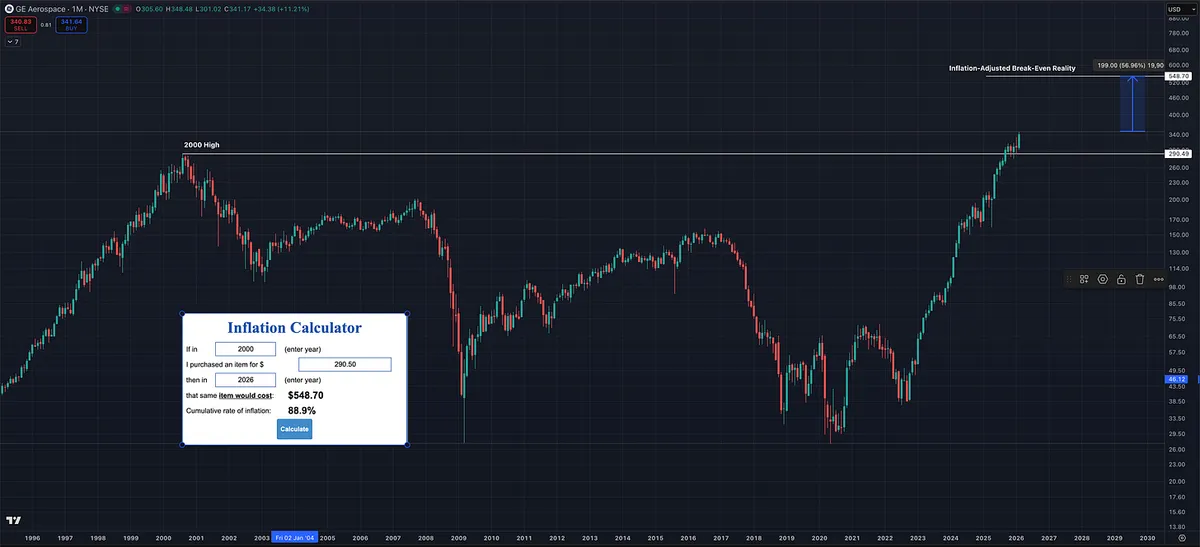
At one time, General Electric was considered one of the safest companies in America. Blue chip. Institutional favorite. A “forever” stock.

It peaked in 2000.

If you bought near the highs and held, you waited decades just to see price approach those levels again. Adjusted for inflation, you are still not truly made whole. From the inflation adjusted breakeven level, the stock would need to rise another 57 percent just to restore purchasing power.

That is the hidden cost of buy and hold without risk management.

This can happen to any stock.

There are no permanent leaders. Capital rotates. Industries evolve. Institutions move on.

Growth momentum trading is built differently.

We cut losses short. We follow the trend. We concentrate in strength. We protect capital.

A great company can be a bad stock. A bad company can be a good stock.

Ideally, we want both at the same time. A strong company in a confirmed Stage 2 advance.

That is where real compounding happens.

William O’Neil said it best:

“There are no good stocks unless they go up in price. If they go down instead, you have to cut your losses fast.”

View on Substack ↗

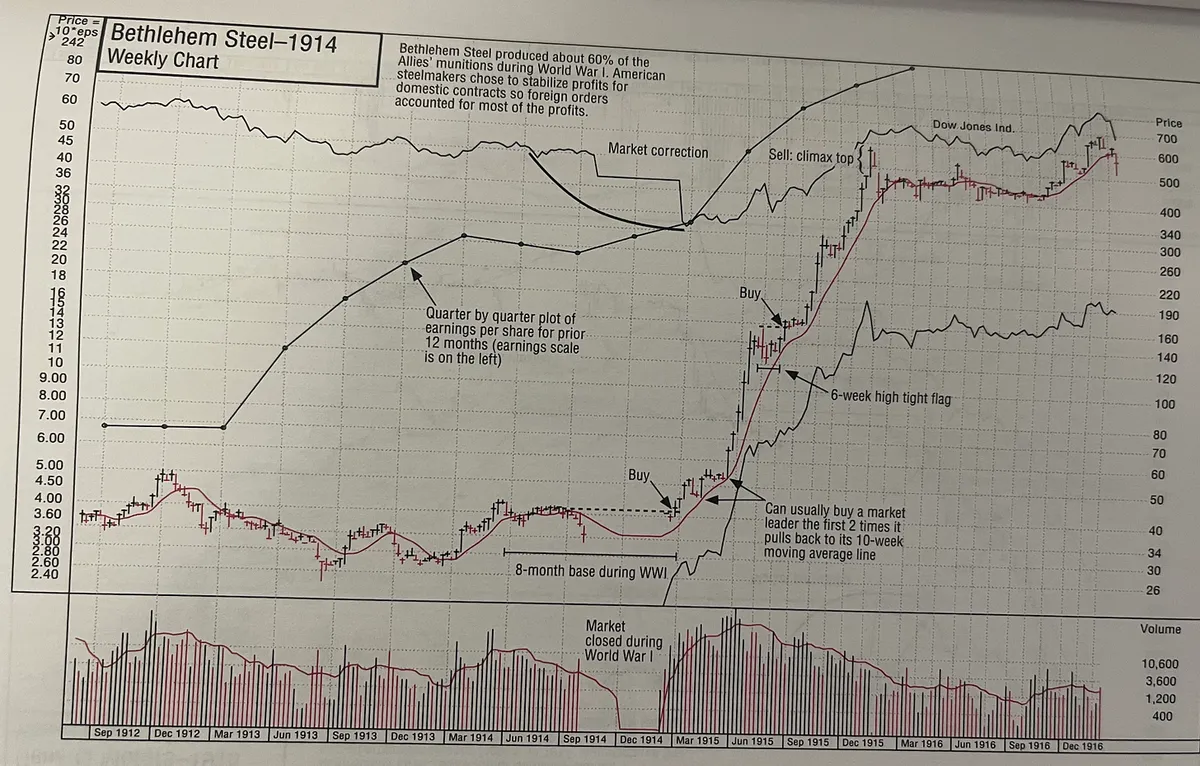
Every Bull Market Starts With Something New

If you study over 100 years of market history, one pattern becomes impossible to ignore.

Every major bull market has been driven by something new.

Not cheap stocks. Not low PEs. Not high dividends.

Something new.

Let’s walk through it by decade.

1900s

Steel, railroads, oil, electrification. Industrial expansion reshaped the American economy. Capital flowed into companies building the physical backbone of the country.

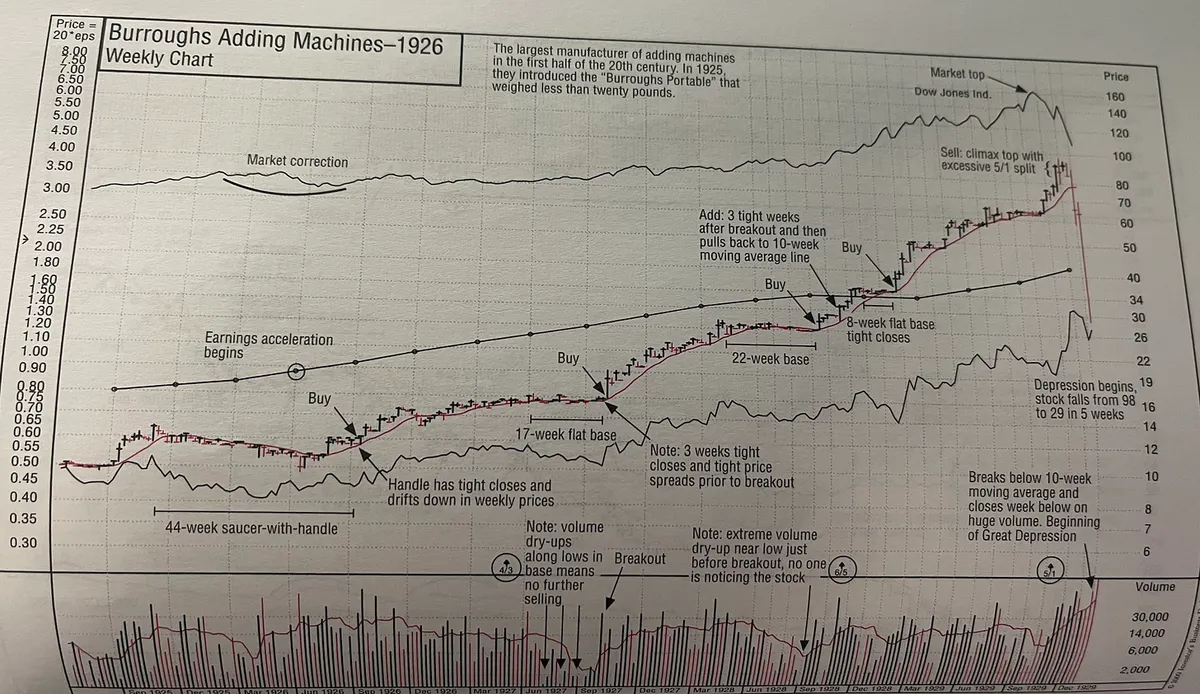
1920s

Automobiles and mass production. Ford changed transportation. Consumer expansion exploded. Entire new industries were born.

1950s and 1960s

Television, aerospace, post war consumer growth. America industrialized further and globalized.

1980s

Personal computers. IBM, Microsoft, and others brought computing to businesses and households. Productivity shifted permanently.

1990s

The internet. Search, networking, ecommerce. Cisco. Google. Amazon. A completely new digital infrastructure.

2000s

Broadband, smartphones, and software at scale. Entire industries were digitized.

2010s

Cloud computing and mobile ecosystems. Apple. Salesforce. The rise of SaaS and platform dominance.

2020s

Artificial Intelligence. AI infrastructure. AI software. Automation. The early innings of another structural shift.

Industries change. Technology evolves, but the pattern does not.

A new innovation creates a new category. Capital concentrates into the strongest companies in that category. Market leaders emerge. Momentum follows.

This is the N in CANSLIM.

New products. New services. New industry conditions. New leadership. New Price Highs.

Every generation says, “This time is different.”

It never is.

The innovation changes.

The behavior of money does not.

If you want to understand where the next big winners come from, start by asking one question:

What is truly NEW right now?

That question has worked for over a century.

View on Substack ↗

“It’s extended.”

That’s what people say when they haven’t studied enough.

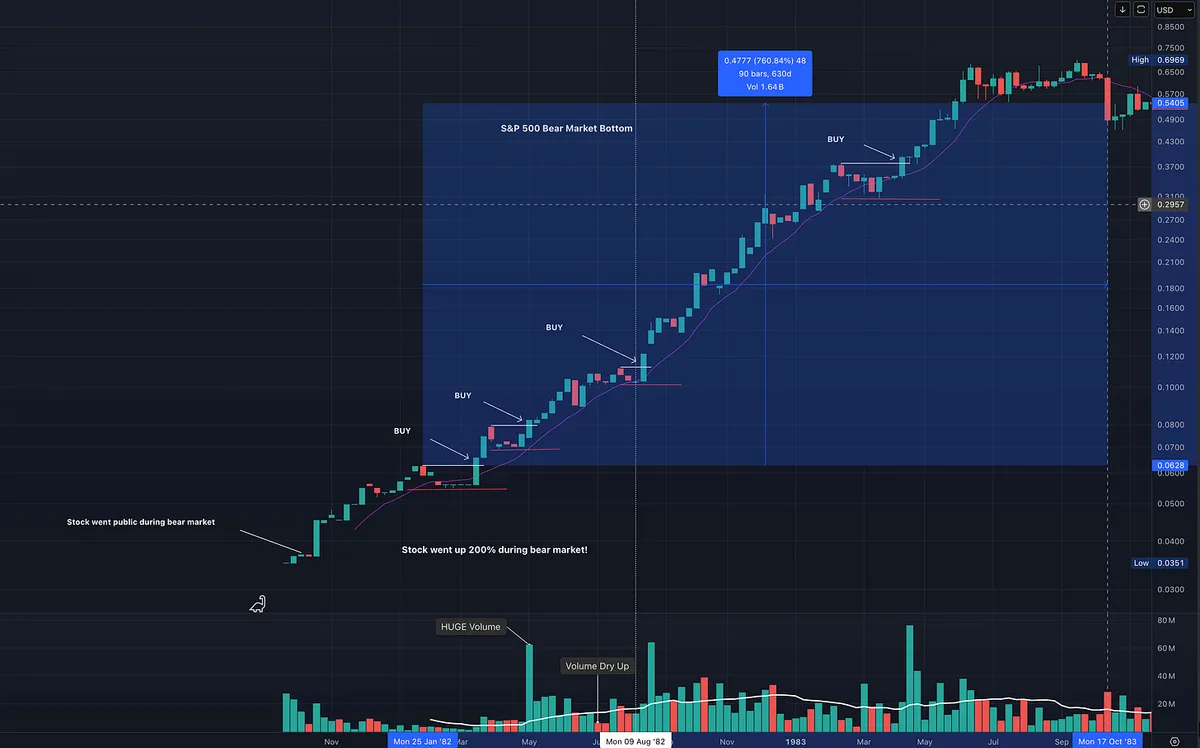
This chart, originally shown in How to Make Money in Stocks by William J. O’Neil , shows something important.

Yes, the stock is extended from what most would call a traditional base.

But Home Depot in the early 80s kept offering low risk, high reward entries inside a powerful Stage 2 uptrend.

Look at the areas marked BUY:

  • Tight consolidations

  • Volume contraction

  • Higher lows

  • Breakout through short resistance

  • Immediate continuation

That is not chasing.

That is entering strength with defined risk.

You do not always need:

  • A cup with handle

  • A massive reset

  • A 30 percent correction

Big institutional leaders often stair step higher.

They build tight flags. They pause. They break out. They continue.

If the stock is trending above a rising moving average, If price is contracting, If volume dries up before expansion,

That is opportunity.

This is not FOMO into a straight up name. We are still being patient. We are still waiting for tight pullbacks inside strength.

It looks very similar to some of the biggest winners we have had recently.

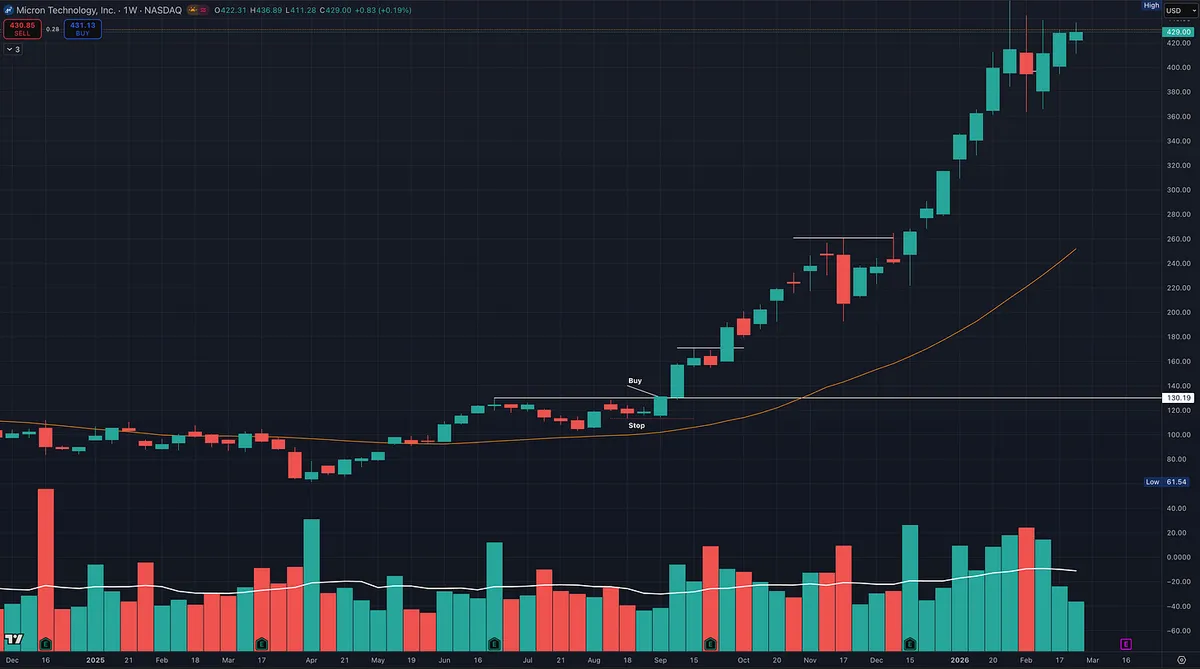
How many could have stepped into MU, LITE, or AVGO using similar entry tactics?

Study that difference.

View on Substack ↗

Why Momentum Has Persisted for Over 100 Years

Markets evolve.

Technology changes. Execution gets faster. Information spreads instantly.

But the core drivers of markets have not changed.

Human nature has not changed.

Fear and greed still drive behavior. Crowd psychology still amplifies trends. Overconfidence still creates bubbles. Panic still creates collapses.

Charts are not just pictures of price.

They are visual representations of supply and demand.

When demand consistently exceeds supply, price trends upward. When supply overwhelms demand, price declines. That dynamic is timeless.

Institutional capital is a major force behind sustained trends.

Large funds cannot build or exit positions in a single day. Their accumulation creates prolonged advances. Their distribution creates extended declines.

Leadership also concentrates.

In strong market cycles, a relatively small group of stocks drive the majority of gains. This has been true for over a century.

Earnings growth attracts capital. Capital flow reinforces trend. Trend persistence becomes structural, not random.

Momentum works not because markets are inefficient in some abstract academic sense.

It works because human behavior and capital flow dynamics repeat.

As long as fear, greed, and competition exist, strength will attract more strength.

That is why principles used in the early 1900s still apply in modern markets.

Technology changes.

Human behavior does not.

And that is where trend and momentum strategies find their edge.

View on Substack ↗

Most Traders Want Results. The Professionals Focus on Process.

One thing that becomes obvious when you study the great traders across history is this:

They did not become profitable overnight.

Jesse Livermore didn’t.

Gerald Loeb didn’t.

Nicolas Darvas didn’t.

William O’Neil didn’t.

And neither did the modern growth traders people admire today.

It took years.

Years of refining rules. Years of mistakes. Years of emotional discipline. Years of learning what not to do.

Trading is treated casually by most people because it looks simple on the surface. Click buy. Click sell. Watch the screen.

But the reality is this:

Trading is a profession.

And like any profession, mastery takes time.

The problem is that most people approach the market focused on the outcome.

How much can I make? How fast can I grow this account? What stock will double next?

But there is a paradox in markets.

When you obsess over the result, you usually sabotage it.

You hesitate to cut losses. You size too big. You chase. You revenge trade.

The professionals focus on something else.

They focus on process.

They define what they buy. They define when they buy. They define when they exit. They manage risk first. They let probability do the heavy lifting.

The result becomes a byproduct of disciplined execution.

Markets change structurally. Technology evolves. Speed increases.

But human nature has not changed.

Fear and greed still drive price. Supply and demand still govern movement. Leadership still concentrates in a small group of names during strong cycles.

If you want long-term success in momentum and growth trading, the shift is simple but difficult:

Stop chasing results. Start building process.

Everything compounds from there.

View on Substack ↗

One of the Most Important Lessons in Trading That Most Ignore

One of the most important lessons in Market Wizards was this from Bruce Kovner:

“Whenever I enter a position, I have a predetermined stop. That is the only way I can sleep. I know where I’m getting out before I get in. The position size on a trade is determined by the stop, and the stop is determined on a technical basis.”

Read that again.

The chart determines the stop. The stop determines the position size.

Most traders invert that.

They choose size first. Then force the stop to fit.

That is not risk management. That is guesswork.

Do you actually know how to implement this inside your own setups?

I break it down step by step with real chart examples and a full walkthrough video.

Read it here → https://tradingmomentum.substack.com/p/most-traders-get-position-sizing

ArticleMost Traders Get Position Sizing Wrong. Here’s the Risk Management Fix.
View on Substack ↗

Most Traders Size Positions Backwards. Here’s the Risk Management Fix.

Most traders don’t blow up because of bad entries.

They blow up because they size positions backwards.

They decide how much they want to risk.

Then they force the stop to fit.

That’s not risk management. That’s guesswork.

I just published a deep breakdown showing:

• How structure defines the stop

• How the stop defines position size

• How exposure caps reshape portfolio risk

• Real chart examples + full walkthrough video

Read it here → https://tradingmomentum.substack.com/p/most-traders-get-position-sizing

ArticleMost Traders Get Position Sizing Wrong. Here’s the Risk Management Fix.
View on Substack ↗

If You Want Big Winners, Start With Relative Strength

Before a stock makes a massive move, it almost always shows one thing first.

Relative strength.

I spot nearly every big winner the same way. It shows up on a relative strength scan before it shows up on social media, before it becomes obvious, before the breakout gets attention.

Running a daily relative strength screen takes minutes.

When you start seeing the same names appear day after day, week after week, that is your signal.

That is not noise. That is accumulation.

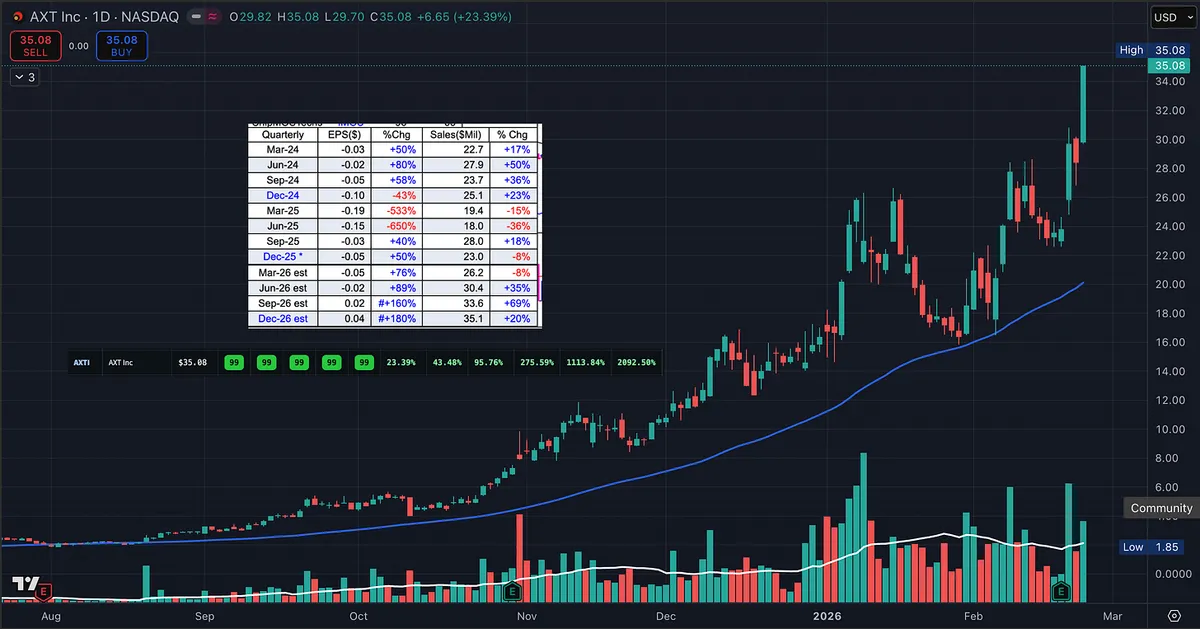
Look at AXTI.

RS 1W: 99 RS 1M: 99 RS 3M: 99 RS 6M: 99 RS 1Y: 99

That is sustained outperformance across every meaningful timeframe.

Now look at the returns:

1 month: +95% 3 months: +275% 6 months: +1113% 1 year: +2092%

Big winners do not come out of nowhere.

They begin by outperforming the market quietly.

Institutions accumulate strength, not weakness. Capital flows toward leaders.

Relative strength tells you:

• Where money is going

• Which stocks are being accumulated

• Who is leading right now

If you want to catch outsized moves, stop looking for cheap.

Start looking for strong.

View on Substack ↗

Protecting a Winner Before It Becomes a Loser

“You may feel dumb breaking even on a trade that was once at a profit; however, you’ll feel a lot worse if you turn a good-size gain into a loser.” — Mark Minervini

At the start of a trade, your stop serves one purpose.

To cap your loss.

You are defining risk. You are protecting capital. Nothing more.

If you risk 5 percent, that is the maximum you are willing to lose if the trade fails.

But once the stock advances meaningfully in your favor, the responsibility shifts.

In Think and Trade Like a Champion, an example is given where a stock moves roughly two times the initial risk. At that point, the stop can be raised to breakeven.

Now the trade changes.

You are no longer just limiting downside. You have removed the possibility of turning the position into a loss.

If the stock continues to make higher highs and higher lows, the position is managed accordingly.

That may include:

• Selling a portion into strength

• Raising the stop to a prior higher low

• Using a trailing method such as ATR

• Using a moving average as a guide

The objective is not to capture every last point.

It is to protect progress.

Breaking even after a meaningful advance may feel premature.

But allowing a solid gain to turn into a loss is far worse.

Risk management begins with capping losses.

It evolves into protecting gains.

View on Substack ↗

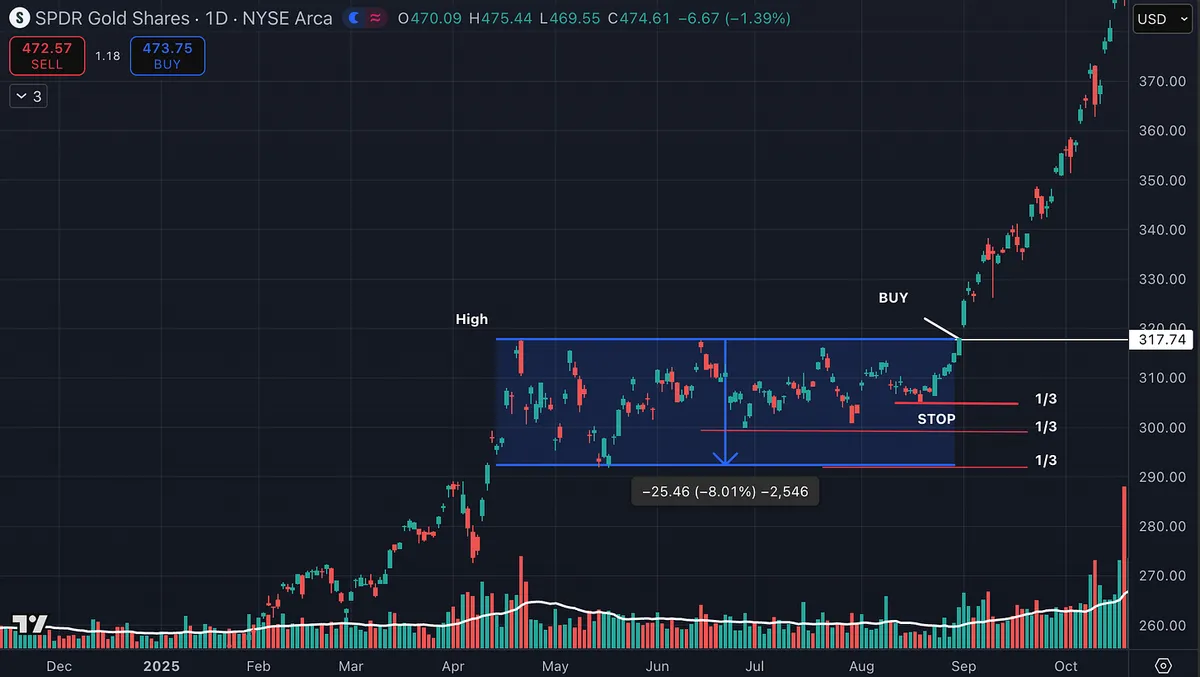
Using Staggered Stops

You do not have to set your stop-loss on your entire position at one price.

Instead, you can use staggered or bracketed stops and still mitigate losses at your desired level while giving yourself a better chance of maintaining at least a portion of the position if the stock moves against you.

The total risk remains defined.

The position is simply divided into pieces.

For example, instead of using one stop for the full position, you can divide it into thirds and place stops at different levels while keeping the overall loss within your acceptable range.

In the GLD example shown:

• One third is stopped at 4 percent

• One third is stopped at 6 percent

• One third is stopped at 8 percent

If all three stops are hit, the average loss is 6 percent.

The 4 percent and 6 percent stops are placed around higher low areas within the consolidation.

The 8 percent stop is placed just below the entire consolidation low.

This keeps the total risk defined while giving part of the position more room.

The objective is to maintain your line without getting knocked out of the entire position.

The percentages themselves are not fixed.

They are based on the structure of the stock and the level of risk you are willing to accept.

The concept is simple.

Define total risk. Divide the position. Bracket the stops around logical levels.

View on Substack ↗

4 Legendary Entry Tactics That Built Trading Fortunes

Minervini.

O’Neil.

Darvas.

Kullamägi.

Different decades. Different styles. Same structural edge.

I broke down exactly how each one enters momentum growth stocks with precision.

If you trade breakouts, this is mandatory reading.

Read it here ↓

https://tradingmomentum.substack.com/p/the-4-breakout-entry-architectures

ArticleThe 4 Breakout Entry Architectures Used by Market Legends
View on Substack ↗

Don’t Choose a Win Rate. Discover It.

A lot of people ask me:

“How do I know what my win rate should be?” “Should I aim for 40%? 50%? 60%?”

You don’t choose it.

You discover it.

The best way to figure out your real win rate and risk-reward profile is simple:

Take the setups you naturally like. The market type you prefer. The kinds of stocks you’re drawn to.

And forward test them.

Not backtest.

Forward test.

Actually trade them in the current market.

Use:

  • A small amount of real money or

  • A paper trading account

Then take a large enough sample size. 50 to 100 trades minimum.

Now look at your data:

  • What’s your batting average?

  • What’s your average win in R?

  • What’s your average loss in R?

  • What’s your largest winner?

  • What’s your largest loser?

Two things happen.

First, you’ll know whether you actually have positive expectancy.

Second, you’ll know what kind of trader you really are.

Maybe you’re a 35% trader with 4R winners. Maybe you’re a 55% trader with 1.8R winners.

Neither is better.

But now you’re not guessing.

Now your position sizing, risk management, and expectations are based on evidence.

Think of it as market research.

You’re not “trying to make money” during this phase.

You’re collecting statistical proof.

Stop trying to pick a win rate.

Build a process. Forward test it. Let the numbers tell you who you are.

View on Substack ↗

Stop Asking If 30% or 60% Is Better.

It’s the wrong question.

You can get rich with a 30% win rate. You can get rich with a 60% win rate.

You can go broke with a 30% win rate. You can go broke with a 60% win rate.

Neither is better.

A 30% trader gets rich if:

  • Losses are small

  • Winners are 3R, 4R, 5R

  • Outliers are allowed to expand

That same 30% trader goes broke if:

  • Winners are cut early

  • Losses drift

  • Risk is inconsistent

A 60% trader gets rich if:

  • Risk is controlled

  • Winners are at least 1.5R to 2R

  • No single loss wipes out progress

That same 60% trader goes broke if:

  • Reward equals risk

  • One oversized loss slips through

  • Discipline fades

The market does not reward win rate.

It rewards positive expectancy.

Your job is not to choose 30% or 60%.

Your job is to build a style that fits your personality, matches market conditions, and produces winners large enough to pay for losers.

Win rate is a characteristic.

Expectancy is the edge.

View on Substack ↗

When Not to Sell an Extended Stock

Most traders see a stock up 15 or 20 percent from a base and think one thing.

It’s too extended. Time to sell.

David Ryan, three-time U.S. Investing Champion and William O’Neil protégé who ran the New USA Growth Fund, noticed something different.

In Think & Trade Like a Champion, Minervini explains that Ryan defined “extended” as more than 10 percent above the most recent consolidation. He would not buy extended stocks.

But he observed that some of these names did not roll over. They kept advancing. In many cases, they went on to make huge gains.

That observation led to a hypothesis.

If large institutions cannot fill their positions in one or two days, they must accumulate over time. That steady institutional demand pushes the stock higher across multiple sessions.

Ryan studied this relentlessly and, with programmer Rajneesh Gupta, identified specific characteristics. He originally called the setup ANTS, later referred to as the MVP indicator for Momentum, Volume, and Price.

The traits were precise:

  • 12 out of 15 up days

  • Volume up 25 percent or more

  • Price up 20 percent or more in 15 days

Here is the nuance most traders miss.

Ryan warned against buying solely on these traits if the stock is already extended. He advised waiting for a pullback or a new base to form.

But sometimes that 15-day surge begins near the bottom of a base. In that case, the stock is not extended. It is under accumulation and in position to be bought immediately.

The lesson is simple.

Do not sell strength that is under accumulation.

What feels extended to you may be institutions just getting started.

View on Substack ↗

CANSLIM Stock Screener Results: High EPS+Sales Growth, High RS Ratings, and Breakout Setups

When leadership shifts, most traders get cut up because they keep trading what used to work.

So instead of guessing, I scanned for strict CANSLIM criteria.

Not opinions. Not narratives. Numbers.

Here is the minimum framework I used:

  • Quarterly EPS growth: 18 to 20 percent minimum

  • Preferred quarterly EPS: 40 percent or higher

  • Quarterly sales growth: 25 percent or higher

  • Annual EPS growth: 25 percent for three consecutive years

  • ROE minimum: 17 percent

  • Preferred ROE: 25 to 50 percent

  • RS Rating minimum: 80

  • Preferred RS: 80 to 90 plus

In other words, I looked for companies showing real fundamental acceleration and institutional grade relative strength.

Strong earnings. Strong sales. High profitability. And price action confirming demand.

Then I narrowed it further to names that are either near pivots, pulling back constructively, or tightening before potential breakouts.

This is how we stack probability.

Strong fundamentals and technical confirmation. Defined risk always.

Latest updates have been added directly to the post, with additional names and real-time notes shared inside the paid subscriber chat.

https://tradingmomentum.substack.com/p/canslim-watchlist-update

On SubstackCANSLIM Watchlist Update
View on Substack ↗

The M in CAN SLIM Is Not Optional

Stay aligned with the M in CAN SLIM.

Zoom out before you zoom in.

Before screening stocks, building watchlists, setting alerts or mapping out your trades for the week, step back and evaluate the overall market environment.

Many traders have experienced a “death by a thousand cuts” over the past several weeks. Not because the market is broken, but because what worked earlier in this bull phase is not what is working now.

Leadership has shifted.

Those who zoomed out sooner recognized the rotation. Others may now be realizing that the areas showing strength are not their typical expertise or preferred style of trading.

That awareness matters.

The market does not care what worked last year. It rewards alignment, not habit.

Start with the market. Then refine your process.

The full post is live.

https://tradingmomentum.substack.com/p/big-picture-market-pulse-february-0be

On SubstackBig Picture Market Pulse | February 22, 2026
View on Substack ↗

The Best Traders Never Outgrow the Basics

I have been trading for over 20 years.

And I still reread the same trading books.

Not because I do not know the material.

Because the market has a way of pulling you slightly off process over time.

When I review, I often see that any performance slip traces back to simple foundational rules. Rules I already know.

Cut losses quickly. Buy strength, not weakness. Respect proper position size. Wait for correct setups.

It is not the fancy stuff. It is the basics.

All professionals in every field are great because they master the basics and maintain that mastery.

Elite athletes drill fundamentals. World class surgeons rehearse procedures. Top musicians practice scales.

Trading is no different.

The edge is not complexity. It is disciplined repetition.

Do not read the great books once.

Read them five to ten times.

Each pass deepens understanding. Each review sharpens execution.

Master the basics.