Momentum Trading Strategy

Notes

Short lessons on momentum trading, every day.

Every note from Substack, in one place: risk, setups, leading stocks, market conditions and the mindset behind them. Search them, browse by topic, or filter by stock.

Showing 1–2 of 2 notes

$GLD ×
View on Substack ↗

Using Staggered Stops

You do not have to set your stop-loss on your entire position at one price.

Instead, you can use staggered or bracketed stops and still mitigate losses at your desired level while giving yourself a better chance of maintaining at least a portion of the position if the stock moves against you.

The total risk remains defined.

The position is simply divided into pieces.

For example, instead of using one stop for the full position, you can divide it into thirds and place stops at different levels while keeping the overall loss within your acceptable range.

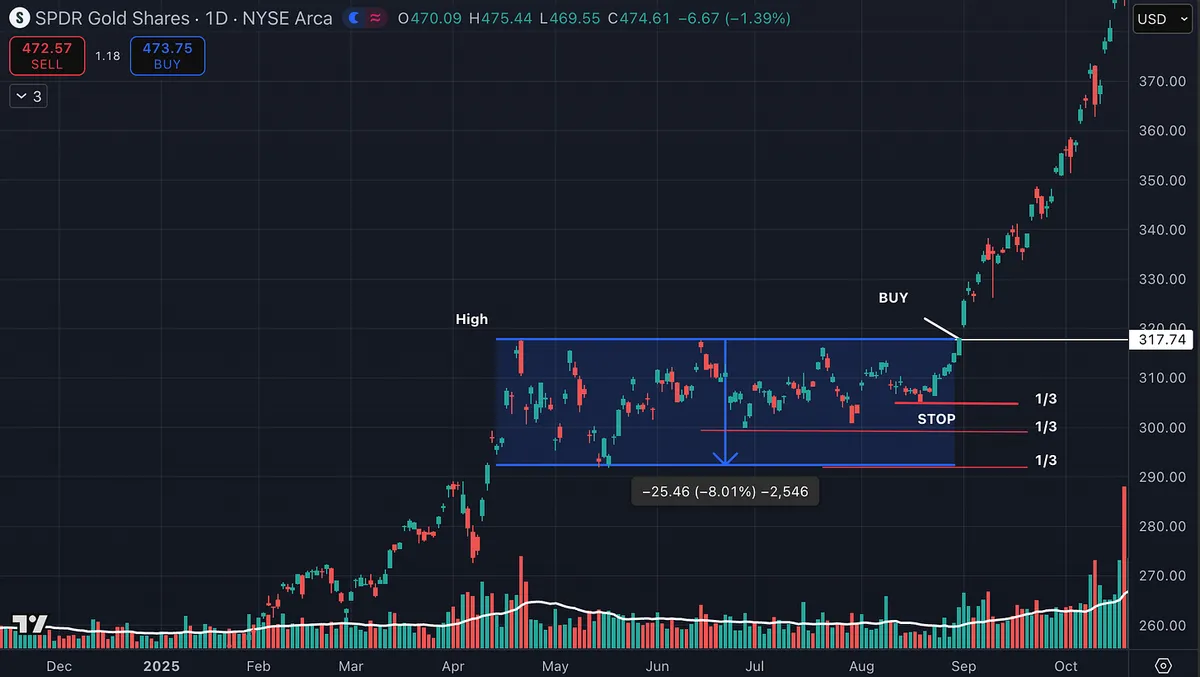
In the GLD example shown:

• One third is stopped at 4 percent

• One third is stopped at 6 percent

• One third is stopped at 8 percent

If all three stops are hit, the average loss is 6 percent.

The 4 percent and 6 percent stops are placed around higher low areas within the consolidation.

The 8 percent stop is placed just below the entire consolidation low.

This keeps the total risk defined while giving part of the position more room.

The objective is to maintain your line without getting knocked out of the entire position.

The percentages themselves are not fixed.

They are based on the structure of the stock and the level of risk you are willing to accept.

The concept is simple.

Define total risk. Divide the position. Bracket the stops around logical levels.
View on Substack ↗

The Quiet Leaders: What’s Been Outperforming the Market All Year

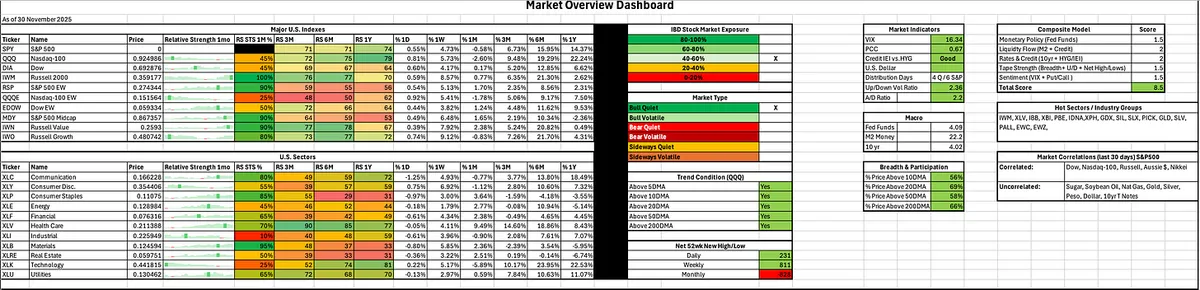
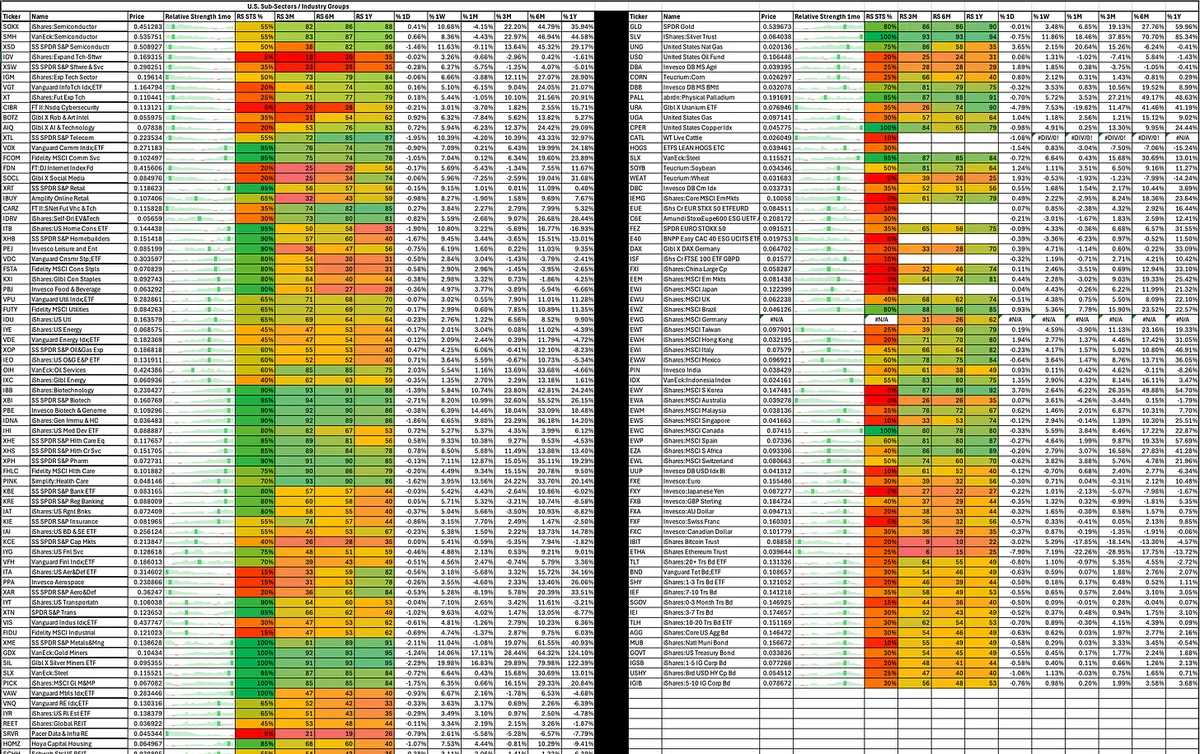
Looking at my Relative Strength Dashboard and combining it with IBD’s RS data, which ranks stocks and ETFs against over 11,000 tickers across the entire market, a clear group of long-term leaders emerges.

These are not just beating the S&P 500, they are outperforming almost everything.

Here is what has dominated across 1-year RS, 6-month RS, 3-month RS, and 1-month RS:

Biotech: IBB, IHI, XPH, PBE Biotech consistently shows up at the top regardless of timeframe. It has been one of the most reliable pockets of strength in the entire market, even during periods when growth cooled off.

Metals and Mining: XME, GDX, SIL, SLX, GLD, SLV This entire complex has been a powerhouse. Industrial metals, gold miners, silver, broad miners. Every category keeps landing near the top of the RS rankings. This is structural strength, not a short-term theme.

Chips (Semiconductors): Semis have shown strong RS over 1-year, 6-month, and 3-month windows. The only softness has been in the past month, and even that looks more like normal digestion after a big run.

Foreign Markets: Canada and Brazil consistently rank near the top across multiple timeframes.

Bottom Line: When RS leadership shows up in every timeframe, and across 11,000 plus tickers, it is not random. Biotech and metals and mining have been the real leaders all year.

This is why I rely on Relative Strength. Leadership is obvious when you measure it.