Momentum Trading Strategy

Notes

Short lessons on momentum trading, every day.

Every note from Substack, in one place: risk, setups, leading stocks, market conditions and the mindset behind them. Search them, browse by topic, or filter by stock.

Showing 621–640 of 1226 notes

View on Substack ↗

The Growth Stock Blueprint Traders Have Studied for More Than 60 Years

One of the most influential growth stock investing frameworks ever created came from William J. O’Neil’s How to Make Money in Stocks.

CAN SLIM helped shape how generations of momentum traders and growth investors think about earnings, leadership, relative strength, institutional demand, market timing, and risk management.

My new article breaks down the CAN SLIM playbook and why it still matters for finding true market leaders before they become obvious.

Read it here:

https://tradingmomentum.substack.com/p/the-canslim-growth-stock-playbook

ArticleThe CANSLIM Growth Stock Playbook Behind America’s Biggest Winners
View on Substack ↗

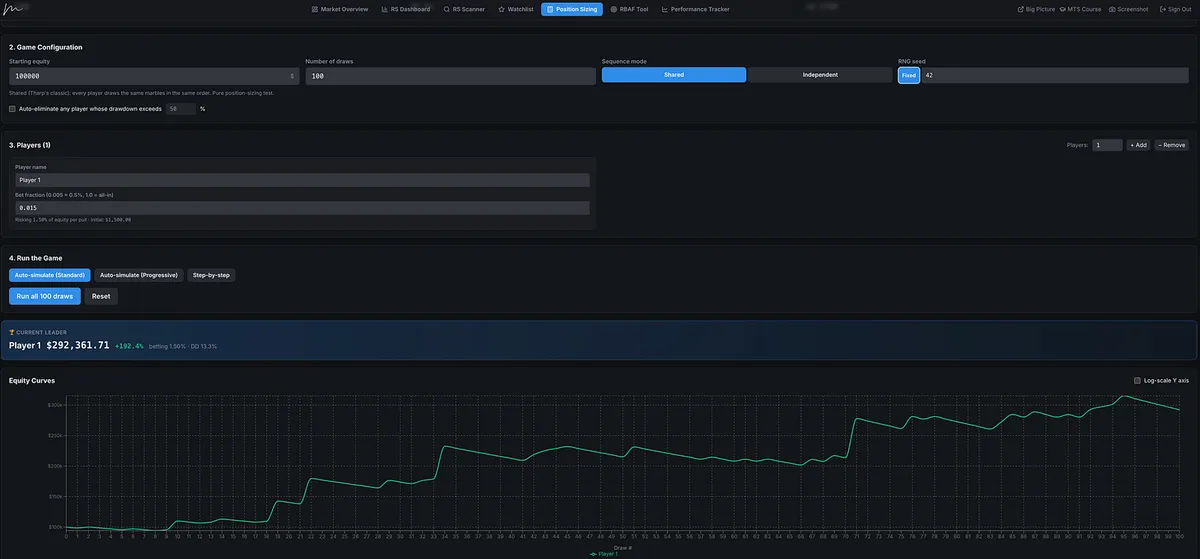
The Game That Shows Why Good Trading Strategies Still Fail

A good trading strategy can still fail if the position sizing is wrong.

That is the lesson behind Dr. Van Tharp’s Marble Game.

Same system. Same trades. Same winners and losers.

Different position sizes can create completely different outcomes.

One trader compounds steadily. One trader barely grows. One trader goes through a drawdown they would never survive in real life.

I just posted a short article and video walking through how to use the Marble Game inside the Momentum Trading Strategy app, including fixed sizing, progressive exposure, drawdown limits, and how to think about risk in a way that actually fits your trading style.

Hope this helps explain the tool and why position sizing is one of the most important parts of long-term performance.

https://tradingmomentum.substack.com/p/the-position-sizing-game-that-shows

ArticleThe Position Sizing Game That Shows Why Good Strategies Still Fail
View on Substack ↗

Not All Swing Traders Are on the Same Time Frame

Two traders can both call themselves swing traders and still be playing completely different games.

Two traders can both call themselves position traders and still be managing completely different time frames.

That is one concept I forget many beginner and even intermediate traders have not fully learned yet.

Most people understand the basic labels.

  • Day trading usually means you are in and out the same day.

  • Swing trading usually means holding for a few days to a few weeks.

  • Position trading usually means holding for weeks to months.

Simple enough.

But the real world is not that clean.

There is a huge gray area between swing trading and position trading.

Some swing traders use intraday charts for execution. Some do not. Some swing traders focus mostly on the daily chart, while others use the daily and weekly structure together.

Position traders can be just as different. Some use the daily and weekly charts. Some care mostly about the weekly chart. Others use the weekly and monthly charts to manage the bigger trend.

And some position traders still look at intraday charts, daily charts, and weekly charts at the same time. They may use the lower time frames for entry and the higher time frames to manage the trade.

This is why one trader can be short a stock and make money while another trader is long the same stock and also make money.

That sounds impossible until you understand time frame.

One trader might be shorting a short-term overextension.

Another trader might be long from a much lower base, holding through normal volatility.

One trader might be managing a 2-day trade.

Another might be managing a 6-month position.

Both can be right.

Both can be profitable.

And the reverse is also true.

Two traders can be on opposite sides of the same stock and both lose money if their timing, sizing, risk management, or execution is poor.

This is why blindly copying someone else’s trade is dangerous.

When you hear that a famous investor is short a stock, you usually do not know their entry, size, hedge, time horizon, partial exits, risk plan, or real objective.

You do not know if they are managing a trade, a hedge, a portfolio position, or a thesis that may take years to play out.

So when people jump online and say, “Aha, he was wrong,” just because the stock went up, they are often revealing more about their own lack of trading knowledge than the investor they are criticizing.

The market does not grade opinions.

It grades time frame, entry, exit, size, risk, and execution.

That is why multiple time frame analysis matters.

Yes, when multiple time frames are aligned, the probability of a trade working usually improves.

And yes, when traders review their losing trades, they often find the same mistake:

They executed on a lower-time-frame signal while the higher time frame was moving against them.

But this note is about something even more basic.

When you are reading Substack, scrolling Twitter, watching YouTube, or listening to someone discuss a stock, you need to understand that everyone may be speaking from a completely different time frame.

Even if they use the same label.

A stock can be bullish on the weekly chart, extended on the daily chart, and breaking down on the 15-minute chart, all at the same time.

That does not mean the chart is confused.

It means you need to know what game you are playing.

Before you ask, “Is this stock bullish or bearish?”

Ask a better question:

“On what time frame?”

View on Substack ↗

The Money Trap That Keeps Traders Broke

Dr. Van Tharp said top traders believe “money is not important.” I pushed back on that for years. Now I think I finally understand what he meant.

At first, it sounds ridiculous.

Of course money matters.

It is why most of us started studying charts, reading Market Wizards, staying up late, taking losses, coming back, failing again, and trying again.

So when Tharp said great traders act like money is not important, I resisted it.

Hard.

Because when you read the Market Wizards books, plenty of elite traders seem to agree with him.

But plenty do not.

Some are brutally competitive. Some are clearly driven by money and say it openly. Some even say they do not believe people are not motivated by money.

And honestly, that justified my resistance.

It made me think:

“See? Money does matter. Drive matters. Competition matters.”

And I still believe that is true.

But here is the nuance.

Some traders can use money motivation without letting it sabotage them.

  • They can want to win badly and still follow their rules.

  • They can be aggressive and still respect risk.

  • They can care about the scoreboard and still play the game correctly.

Most traders cannot do that right away.

Most traders turn money pressure into emotional pressure.

And emotional pressure turns into bad decisions.

The way I look at it now is this:

The need to make money cannot be in control of the trade.

Big difference.

When money pressure is driving the decision, the trader starts needing the market to do something.

And the second you need the market to do something, you stop seeing clearly.

  • You hold losers because you need to be right.

  • You sell winners because you need relief.

  • You overtrade because you need action.

  • You size too big because you need to catch up.

  • You settle for poor setups because you are forcing action.

  • You miss that the trade is not aligned across multiple timeframes.

  • You miss low-risk setups that are staring you in the face because you are too emotionally attached to something else.

Sound familiar?

The best traders may be competitive.

Some are absolutely driven by money.

But the difference is they can perform under that drive without letting it hijack their execution.

Most traders cannot.

And that is not weakness.

It is feedback.

It is awareness.

Know thyself.

Start learning to treat trading like a lifelong game.

A game of process, risk, repetition, and emotional control.

When I stopped obsessing over the money, I started seeing the market cleaner.

  • A loss became data.

  • A bear market became opportunity.

  • A missed trade became nothing.

  • A correction became a reset.

  • My execution got better because my mind got quieter.

I do not panic when the market corrects anymore.

I actually get excited for the next clean reset.

No drama.

That is when my performance greatly improved.

The paradox is this:

The trader who needs the money the least often trades in the way that makes the most money.

Money is just the scorecard.

A hitter in baseball who constantly checks his batting average usually struggles.

The hitter who focuses on seeing the right process gives himself the best chance to produce the average he wants.

Trading is the same.

The money matters, but it cannot be the thing making the decisions.

View on Substack ↗

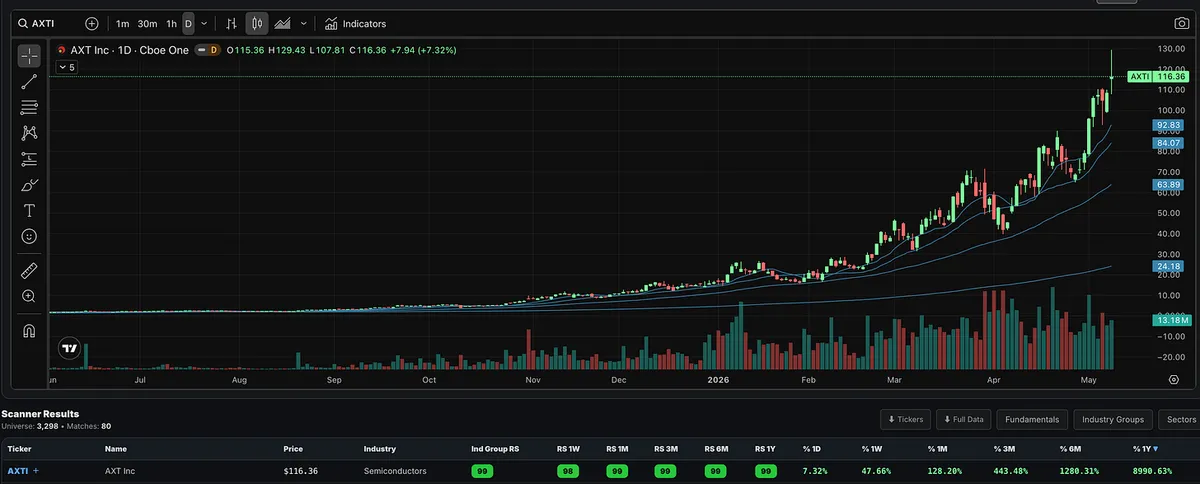
AXTI still refuses to quit.

Still making new highs and once again sitting near the top of my relative strength screen.

Current RS profile:

Industry Group RS: 99

Stock RS: 99

  • AI bull market theme.

  • Semiconductors are one of the leading industry groups.

  • AXTI is one of the leading stocks in that group.

That is exactly the type of alignment I want to see in a growth-led market: strong theme, strong group, strong stock.

View on Substack ↗

Is My Indicator Broken?

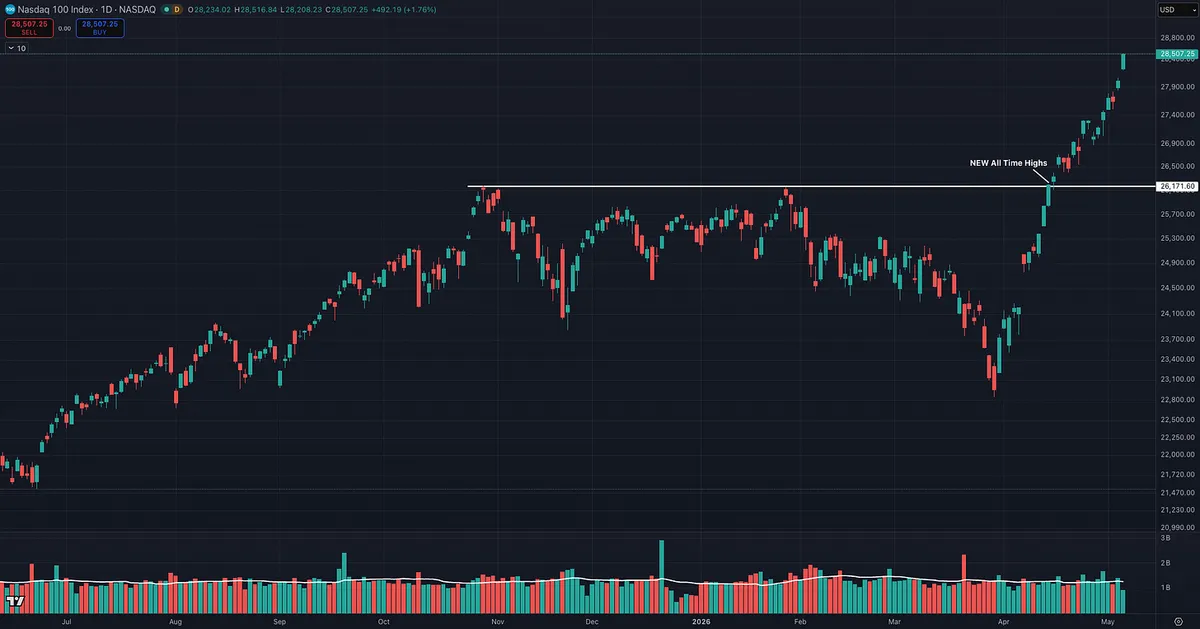
The Nasdaq-100 Index just triggered an ATR% Extension Signal that has not appeared since January 3, 2000.

With the current settings, the signal appears when price is at least 10 times the 14-period ATR above the 50-day moving average. The index is extremely extended above its intermediate-term trend.

That deserves respect.

This is not a sell signal by itself. Strong markets can stay extended longer than most traders expect, and momentum can continue even after rare extension signals appear.

This is a clear reminder that after a powerful six-week advance, chasing extended strength is not the same as buying a low-risk setup from a month ago.

The trend is still up. Growth leadership remains intact, but risk/reward has changed.

At this stage, discipline matters more than excitement.

Pullbacks, shakeouts, and consolidation would be completely normal from here. The better opportunities will likely come from leading stocks that reset, tighten, and offer cleaner entries, not names already stretched far above their moving averages.

The market is still saying yes, but let’s not confuse strength with a free pass to chase or abandon discipline.

Read this week’s Big Picture Market Pulse:

https://tradingmomentum.substack.com/p/big-picture-market-pulse-may-9-2026

On SubstackBig Picture Market Pulse | May 9, 2026: All-Time Highs Again
View on Substack ↗

ALL-TIME HIGHS AGAIN

“The trend is your friend except at the end where it bends.”

-Ed Seykota

Growth stocks continue to press higher, with the Nasdaq-100, Nasdaq Composite, and S&P 500 pushing into record territory again.

The market is still giving growth investors the green light, but after a sharp six-week move off the lows, risk/reward has changed. Step back this weekend and understand the big picture before diving back into individual stock selection.

Read this week’s Big Picture Market Pulse:

https://tradingmomentum.substack.com/p/big-picture-market-pulse-may-9-2026

On SubstackBig Picture Market Pulse | May 9, 2026: All-Time Highs Again
View on Substack ↗

The Market Does Not Pay You for Being Right

Have you ever noticed how badly people want a high win rate trading strategy?

They want to be right.

They want to call the market correctly.

They want to post the perfect chart, nail the exact bottom, predict the breakout, and prove they saw it coming.

The easy answer is ego.

But I think it goes much deeper than that.

Most of us were trained from childhood to believe that being right is the goal.

In school, the kid who gets the most answers right gets the A.

The kid who gets the A gets praised.

The kid who gets the lower grade feels behind, embarrassed, or less capable.

So during some of the most formative years of our lives, we are conditioned to believe this:

More right answers equals more success.

But business, investing, and trading do not work that way.

In the real world, success often comes from being wrong over and over again, while making sure the few times you are right more than pay for the times you were wrong.

Look at Amazon.

The ideas everyone sees today are the winners.

But behind those winners were hundreds, maybe thousands, of tests, experiments, failed ideas, and things that never worked.

The public sees the outcome.

They do not see the graveyard of failed attempts that made the outcome possible.

The same thing happens in venture capital.

Some of the best investors in the world can be wrong on most of their investments.

They know many startups will fail.

They know some will go nowhere.

They also know they do not need to be right on all of them.

They just need the few big winners to pay for everything else.

That is the part most traders never fully absorb.

You do not need to be right all the time.

You need a positive expectancy.

You need risk management.

You need asymmetry.

You need the emotional ability to take a loss without turning it into an identity crisis.

And that is where most people struggle.

Because they are not just fighting the market.

They are fighting years of subconscious programming that says being wrong equals failure.

But in trading, being wrong is not failure.

Being wrong is data.

Being wrong is feedback.

Being wrong is part of the cost of finding the few trades that actually matter.

A baseball player can strike out most of the time and still be one of the best hitters in the world.

A venture investor can miss on most companies and still build a legendary track record.

A trader can have a 35% or 40% win rate and still compound capital if the winners are meaningfully larger than the losers.

But to accept that, you have to think differently.

You have to stop needing every trade idea to validate your intelligence.

You have to stop needing the market to prove you were right.

You have to stop treating every stopped-out trade like a personal insult.

This is why trading psychology matters.

This is why risk management matters.

This is why expectancy matters.

Because the market does not reward the person who needs to be right.

It rewards the person who can be wrong small, stay emotionally neutral, and keep showing up for the few big opportunities that pay for everything.

Most people are not missing the “secret” trading strategy.

They are missing the mindset required to actually follow one.

The hardest part is not finding a setup.

The hardest part is becoming the kind of person who can take losses without falling apart, stay patient without forcing trades, and let the math work without needing constant emotional validation.

That is why low win rate trading strategies are so hard for most people.

Not because they do not work.

But because they require you to unlearn the belief that being right is the same thing as being successful.

In trading, the goal is not to be right.

The goal is to make money when you are right and survive when you are wrong.
View on Substack ↗

One Timeframe Lies. Multiple Timeframes Tell the Truth.

Trends exist on all timeframes, but it is your job to decide which timeframe suits your personality, strategy, and objective best.

That is where many traders get into trouble.

They see something bullish on a 15-minute chart and forget the daily chart is still in decline.

They see a pullback on the daily chart and forget the weekly chart may still be in a healthy uptrend.

They see one candle, one breakout, one moving average, or one support level and act like they have the whole story.

But they don’t.

The market is fractal. The market stages, Stage 1 accumulation, Stage 2 advancing, Stage 3 distribution, and Stage 4 decline, can appear across different timeframes.

A stock can be in a short-term rally while still trapped inside a longer-term downtrend.

It can be pulling back short term while the larger trend remains intact.

It can look “extended” on one timeframe and still be early on another.

That is why multiple timeframe analysis matters.

It gives context.

It helps you separate noise from structure.

It helps you avoid buying short-term strength directly into longer-term resistance.

It helps you avoid selling a normal pullback inside a larger Stage 2 uptrend.

And most importantly, it helps you align your trade with the dominant force.

The point is not that you need to stare at every possible chart. The point is that price must be understood in context.

  • The longer-term trend gives you the battlefield environment.

  • The shorter-term chart helps you find the tactical entry, manage risk, and execute with precision.

A single timeframe can make you emotional.

Multiple timeframes help you stay objective.

The best trades usually come when the bigger picture, the intermediate trend, and the execution timeframe are all telling the same story.

That is trend alignment.

And when trends align, you stop forcing trades and start listening to what the market is actually saying.

This is why patience is so important.

When I review traders’ losing trades, many of them looked good on the shorter timeframe, but when you zoomed out and looked at the higher timeframe, it was contradicting what they were trying to do.

For example, the higher timeframe may still be in a downtrend, while the shorter timeframe is showing what looks like a bullish rally.

That is where traders get trapped.

They act on the short-term signal without respecting the bigger trend.

If they would pull back, look at the higher timeframe, and be more patient, the setup often becomes much clearer. Trades tend to work much better when multiple timeframes are aligned.

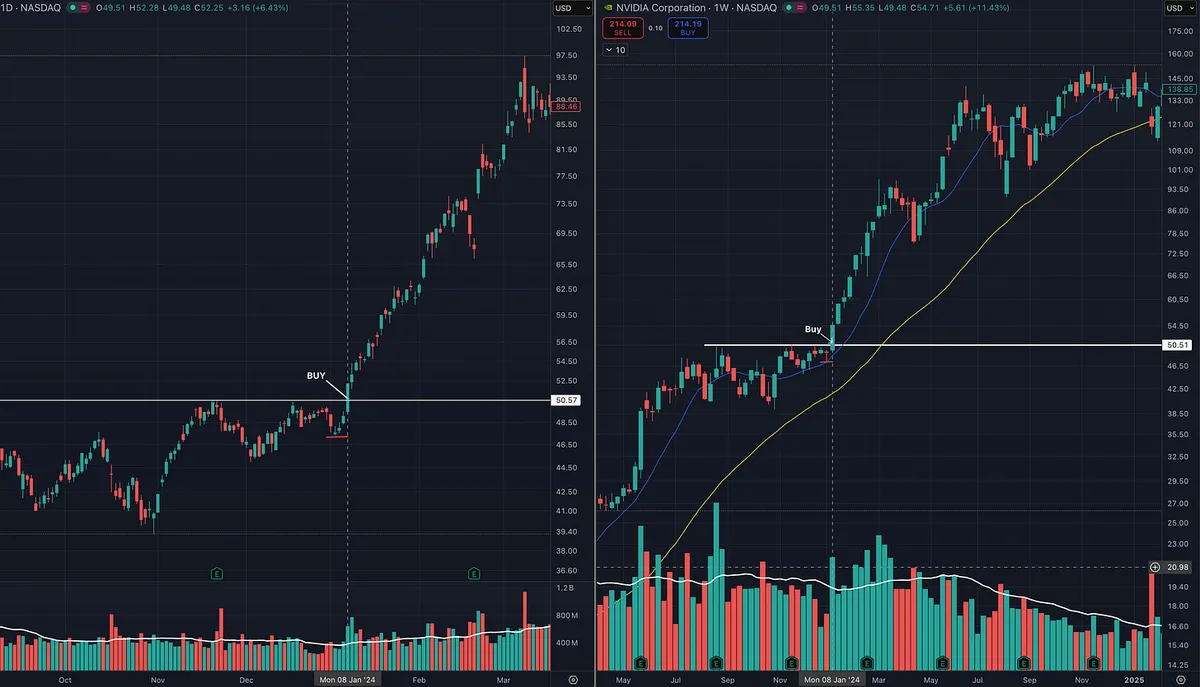
Here is a good example.

The stock was consolidating and tightening up the right side on both the daily and weekly charts. When price broke out, it was also breaking out on the weekly chart.

That was multiple timeframe alignment.

The daily chart and weekly chart were confirming each other.

If the weekly chart had still been in a Stage 4 decline and the daily chart only showed a short-term bullish pop, the odds of that setup working would have been much lower.

That is the difference between trading with structure and trading off one isolated signal.

One timeframe can give you a setup.

Multiple timeframes tell you whether that setup has real power behind it.

View on Substack ↗

The Tape Tells All

Stan Weinstein’s quote, “The Tape Tells All,” is not just a clever market phrase.

It is his entire philosophy.

What he means is that price and volume often reveal the truth before the news does.

By the time the average investor reads the headline, hears the earnings story, or reacts to the exciting fundamental news, the market has usually already begun discounting it.

The tape is where supply and demand show up first.

A stock breaking out of a long base on heavy volume is not random.

A stock falling below support while the news still looks good is not random.

A stock outperforming the market while the fundamentals still look unimpressive is not random.

That is the market leaving clues.

Weinstein’s point is that the chart reflects what investors are actually doing, not what they are saying. Price, volume, relative strength, support, resistance, and a key moving average (200 daily MA) help reveal whether institutions are accumulating, distributing, or ignoring a stock.

The tape does not care about opinions.

It does not care about what sounds cheap.

It does not care about what the crowd thinks should happen.

It shows what is happening.

That is why Weinstein says the job is to learn how to listen properly.

Not to predict.

Not to argue.

Not to chase headlines.

Read the tape. Respect the trend. Follow the evidence.

View on Substack ↗

The Most Dangerous Trader Is the One Who Can’t Change His Mind

The most dangerous trader is not the skeptic.

It is the person who refuses to test anything new.

But the second most dangerous trader is the person who tests everything new.

Both get stuck.

One is so resistant to change that they never discover a better way.

The other is so easily convinced that they jump from system to system, strategy to strategy, indicator to indicator, always looking for the next thing.

The answer is somewhere in the middle.

Be skeptical.

Question everything.

Scrutinize the process.

But then actually test it.

That is exactly what happened to me.

When I first started studying the type of momentum trading strategy I now teach, I was skeptical. I did not immediately believe it. In fact, part of me wanted to prove it wrong.

So I studied it.

I tested it.

I looked at the biggest winning stocks in history.

I looked at relative strength.

I looked at earnings and sales growth.

I looked at volume, leadership, breakouts, risk management, position sizing, and repeatable patterns.

And somewhere along the way, while trying to prove the system wrong, I realized the evidence was proving me wrong.

That is when everything changed.

I have done the same thing with diet, training, and other parts of life. Instead of endlessly debating, I tested it for 30, 60, or 90 days. Sometimes I expected it not to work.

Then I felt better.

Looked better.

Performed better.

And it became part of my life.

Trading is no different.

Sometimes the best way to find out whether a strategy is for you is not to argue with it.

It is to test it.

And if you are stubborn like me, use that stubbornness correctly.

Tell yourself:

“I’m going to follow this exactly, just to prove them wrong.”

But here is the key.

If you are going to test a system, actually test the system.

  • Do not say the strategy does not work if you did not cut your losses.

  • Do not say the strategy does not work if you sold every winner too early.

  • Do not say the strategy does not work if you ignored the stock screening criteria.

  • Do not say the strategy does not work if you bought weak stocks, in weak groups, during a weak market.

That is not testing the system.

That is testing your ability to break rules.

You do not need a lot of capital to test a strategy.

You need discipline.

You need rules.

You need enough open-mindedness to try it, and enough skepticism to make sure it actually works.

That balance is where real growth happens.

View on Substack ↗

New Highs Aren’t the Problem. Trapped Sellers Are.

Most people think a stock making new highs is “too expensive.”

William O’Neil taught almost the opposite.

In How to Make Money in Stocks, O’Neil explains the concept of overhead supply.

Overhead supply is created when a stock has previously traded at higher prices, then falls.

Think about what happens psychologically.

A stock runs from $25 to $40.

A bunch of people buy near $38, $39, or $40.

Then it drops to $30.

Now those buyers are trapped.

They are sitting on losses.

And many of them are thinking the same thing:

“If this thing just gets back to my price, I’m selling.”

So when the stock climbs back toward that old price area, selling pressure shows up.

Not because the company necessarily got worse.

Not because the chart is broken.

But because all those trapped buyers finally have a chance to get out even.

That is overhead supply.

It acts like a ceiling.

Every time the stock tries to move higher, old buyers become sellers.

This is why beaten-down stocks can look “cheap” but still struggle to make real progress.

They have to fight through layers of prior buyers who want out.

Now flip that around.

A stock breaking into new high ground has a major advantage.

There are fewer trapped sellers above it.

At all-time highs, there are no prior buyers sitting above the current price waiting to “get back to even.”

That does not mean every new high is a buy.

The stock still needs proper price action, volume, fundamentals, market alignment, and risk control.

But structurally, new highs have one huge edge:

There is little or no overhead supply.

That is why the strongest stocks often look “too high” before they go much higher.

The crowd sees new highs and thinks danger.

O’Neil saw new highs and asked a better question:

Is demand strong enough to absorb supply and push the stock into open air?

That is where many of the biggest winners begin.

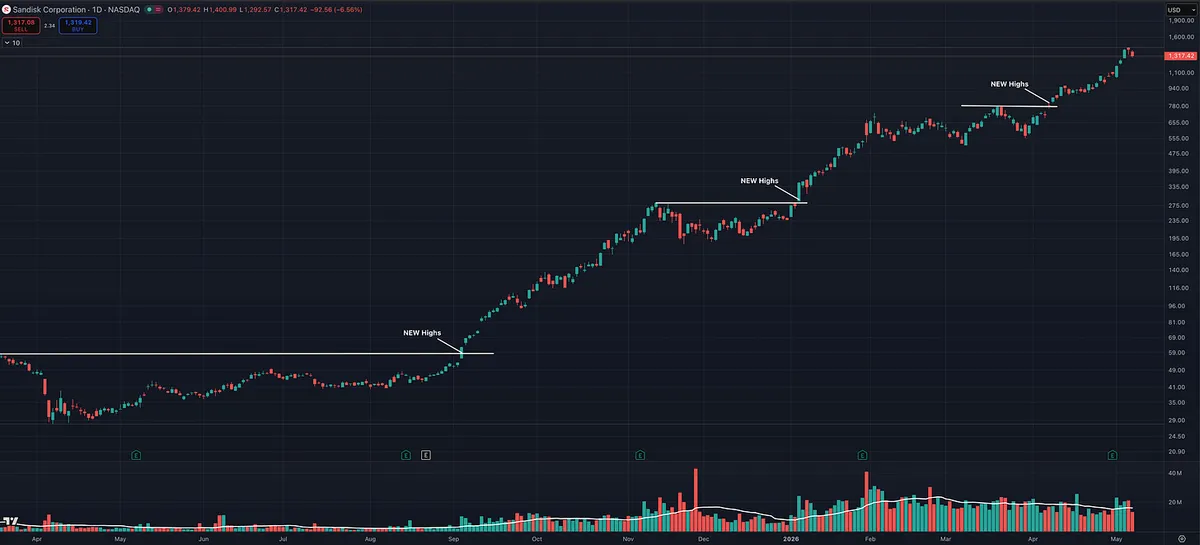
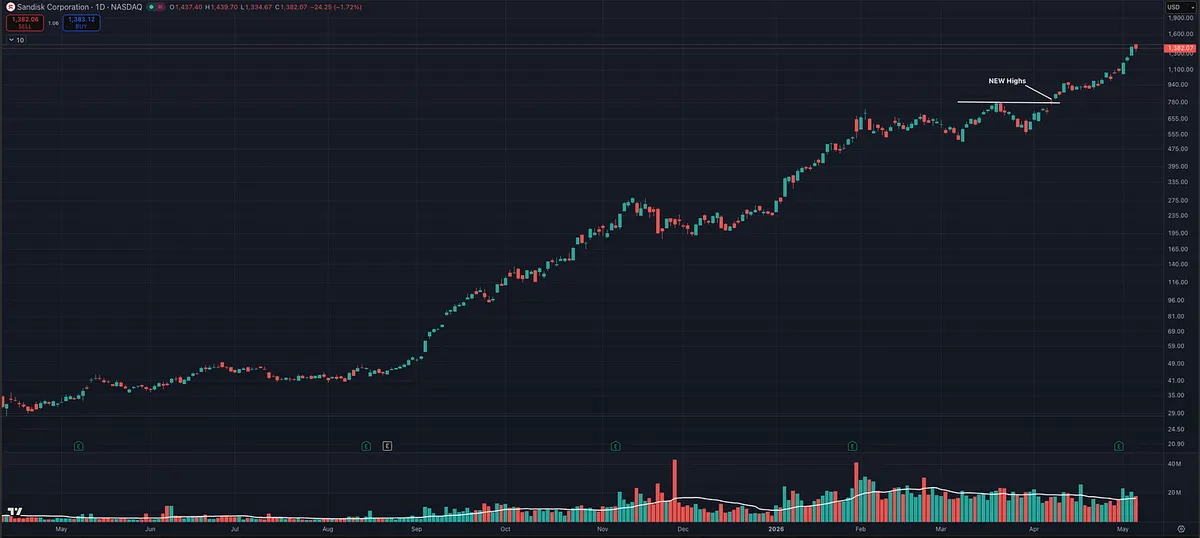
SNDK breaking into new highs before the market. That is leadership. Little overhead supply, strong demand, and price moving into open air.

View on Substack ↗

Same Strategy. Different Bet Size. Wildly Different Results.

Dr. Van Tharp taught a game called the marble game.

The idea is simple, but the lesson is massive.

You have a trading strategy, represented by 100 marbles.

In this example, the system has a 35% win rate.

Out of 100 trades:

65 are losers at -1R

15 are winners at +1R

7 are winners at +2R

6 are winners at +3R

3 are winners at +5R

2 are winners at +10R

2 are winners at +20R

For anyone new to R multiples, +2R simply means you made two times what you risked.

This is very similar to how many trend-following and momentum strategies actually behave.

Lots of small losers.

Some average winners.

A few massive outlier winners that drive most of the returns.

But here is the catch.

Before you randomly draw the marbles, you have to choose your position size.

You do not know what order the trades are coming in.

Just like real trading.

Everyone can have the exact same strategy, but the only thing they control is how much they risk per trade.

And that one decision can completely change the outcome.

One trader may make very little because they are too conservative.

Another trader may go bust because they are betting too big.

And for every strategy, there is usually a sweet spot where the position sizing works best for the expectancy of the system.

That is why I built this into the Momentum Trading Strategy App.

I wanted to take Van Tharp’s marble game and make it something traders could actually simulate, study, and learn from.

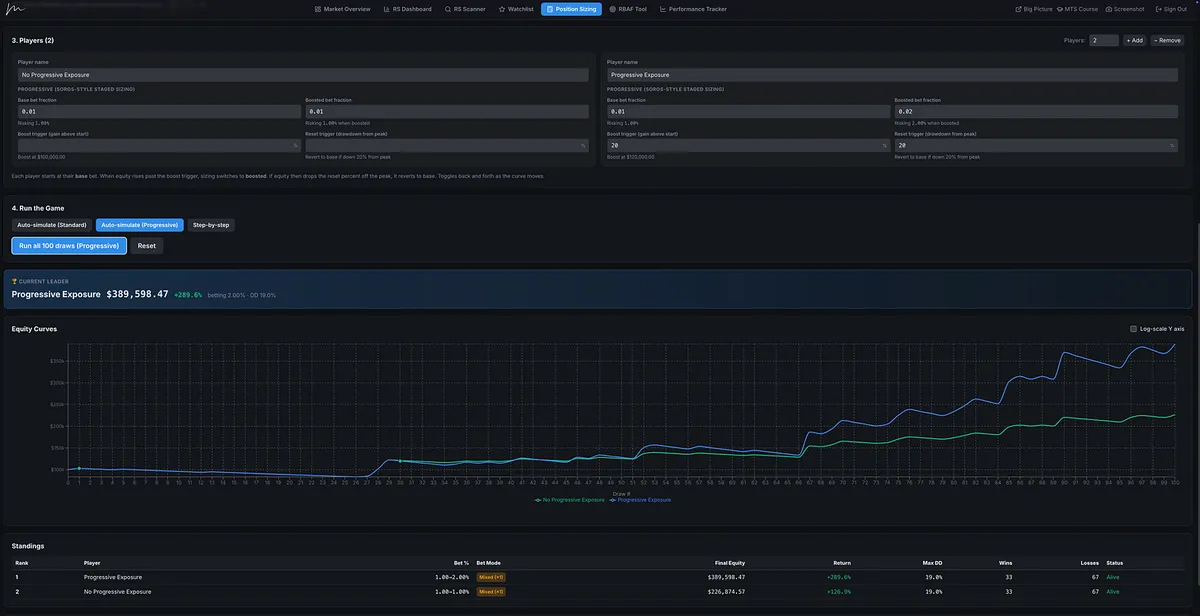
In this example, both traders started by risking 1% of equity per trade.

The first trader kept risking 1% the entire time.

They still did extremely well.

After 100 simulated trades, they were up 126%, with a max drawdown of 19%.

But the second trader used progressive exposure.

They also started at 1%.

But once they were up 20% from the starting equity, they increased risk to 2%.

If they later drew down 20% from their peak, they dropped back to 1%.

Same strategy.

Same trades.

Same draw sequence.

Different exposure rules.

The result?

The progressive exposure trader finished up 289%, with the same max drawdown of 19%.

That is the power of progressive exposure.

You press when the system is working.

You reduce when the equity curve starts moving against you.

This is why position sizing is not some boring side topic.

It can be the difference between underperforming, blowing up, or compounding intelligently.

The strategy matters.

But how you size the strategy matters just as much.

If you want to learn more about these tactics, I go much deeper inside Module 6 of the Momentum Trading Strategy Course: Risk Management & Position Sizing.

https://tradingmomentum.substack.com/p/momentum-trading-strategy-risk-management

On SubstackMomentum Trading Strategy: The 100-Year Playbook Behind the Biggest Winning Stocks — Module 6 Risk Management & Position Sizing
View on Substack ↗

The Market Told You Before the News Did

Remember when everyone was scared to buy?

  • “The ceasefire didn’t hold.”

  • “AI is going to take everyone’s jobs.”

  • “Inflation is back.”

  • “The market is in a bubble.”

There is always a reason to be scared.

But the job of a trader is not to sit around reacting to every headline.

The job is to follow the price action.

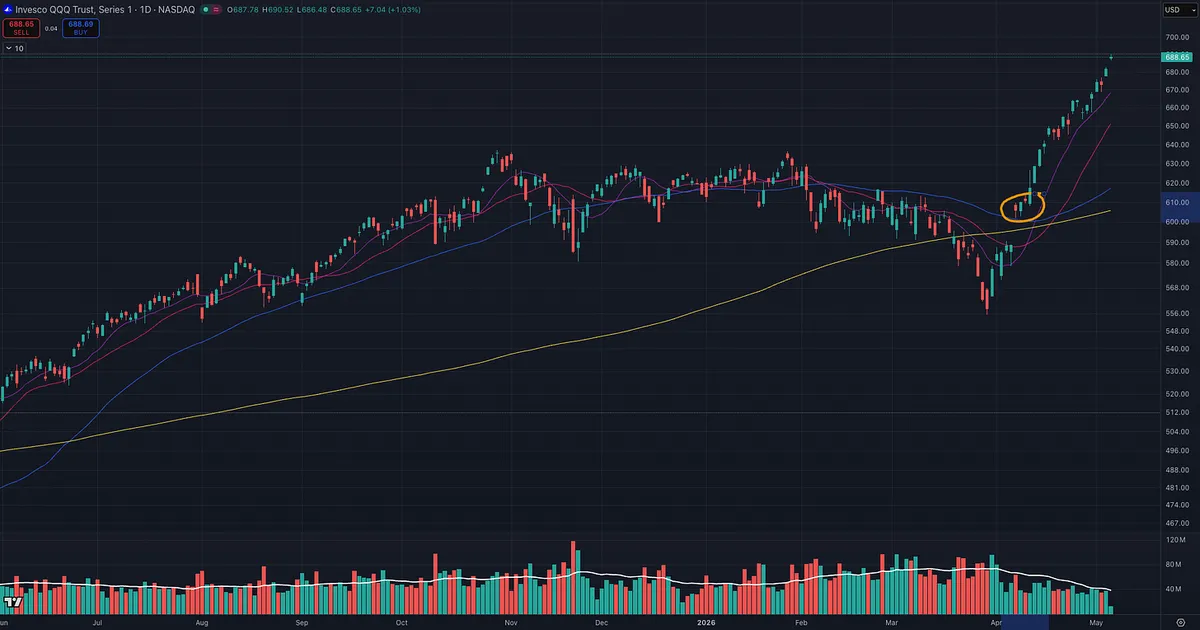
On April 8, the market gave us a signal.

QQQ reclaimed key moving averages, the follow-through day confirmed, and the strongest groups and strongest stocks led the way.

That was the message.

Not the news.

Not the fear.

Not the social media panic.

The market will usually tell you more than any news feed ever will.

Instead of spending hours a day listening to people explain why you should be afraid, imagine spending that time learning how to actually read the market like the great traders did.

The Market Wizards were not great because they predicted every headline.

They were great because they knew how to read price, manage risk, and follow strength.

Stop letting the news think for you.

Learn to read the market.

View on Substack ↗

This Is Why You Track Leadership Before Everyone Else Sees It

On April 8, the market gave us the signal.

We had a follow-through day, the NASDAQ-100 reclaimed key moving averages, including the 50-day and 200-day, and the conversation shifted from defense back toward offense.

But the real edge was not just knowing the market was improving.

The edge was knowing where to look.

When the market gets stronger, I want to be focused on the strongest industry groups and the strongest stocks inside those groups.

That is exactly what we had been tracking for months.

  • Telecom.

  • Computer Data Storage.

  • Semiconductors.

Many of these names were not random new ideas. They had already been showing up in our work, some for months, and some even last year.

So when the market confirmed on April 8, there was no need to bounce around looking for the next hot ticker.

The leadership was already there.

From the April 8 signal to yesterday’s close:

AAOI up 40%

LITE up 12%

CIEN up 12%

VIAV up 30%

SNDK up 81%

WDC up 38%

STX up 53%

TER flat

AEIS down 4%

AEHR up 50%

LRCX up 12%

FIX up 30%

GLW flat

Not every stock works.

That is normal.

But when the market confirms, and multiple stocks from the same leading groups start moving together, that is usually not a coincidence.

That is institutional money flowing into a theme.

Strong market.

Strong industry groups.

Strong stocks.

That is the process.

The goal is not to chase every move.

The goal is to already know where the strength is clustering before the move becomes obvious.

View on Substack ↗

The Buy Is Only the Beginning

Knowing when to sell is just as important.

Most traders spend all their time asking:

“What should I buy?”

But the better question is:

“What do I do after I buy it?”

Finding a strong stock is only the beginning.

The real money is made, or lost, in the management.

  • Do you cut the loss when the trade is wrong?

  • Do you protect break-even once the trade has worked?

  • Do you sell some into strength?

  • Do you trail the rest?

  • Do you use moving averages, ATR trailing stops, Donchian channels, or higher lows?

That is what my new article is about:

When Should You Sell a Winning Stock? The Trade Management Playbook

A trade management playbook for protecting profits without cutting your biggest winners short.

Read it here:

https://tradingmomentum.substack.com/p/when-should-you-sell-a-winning-stock

ArticleWhen Should You Sell a Winning Stock? The Trade Management Playbook
View on Substack ↗

How do you find stocks that can go up 100%, 200%, or 300%?

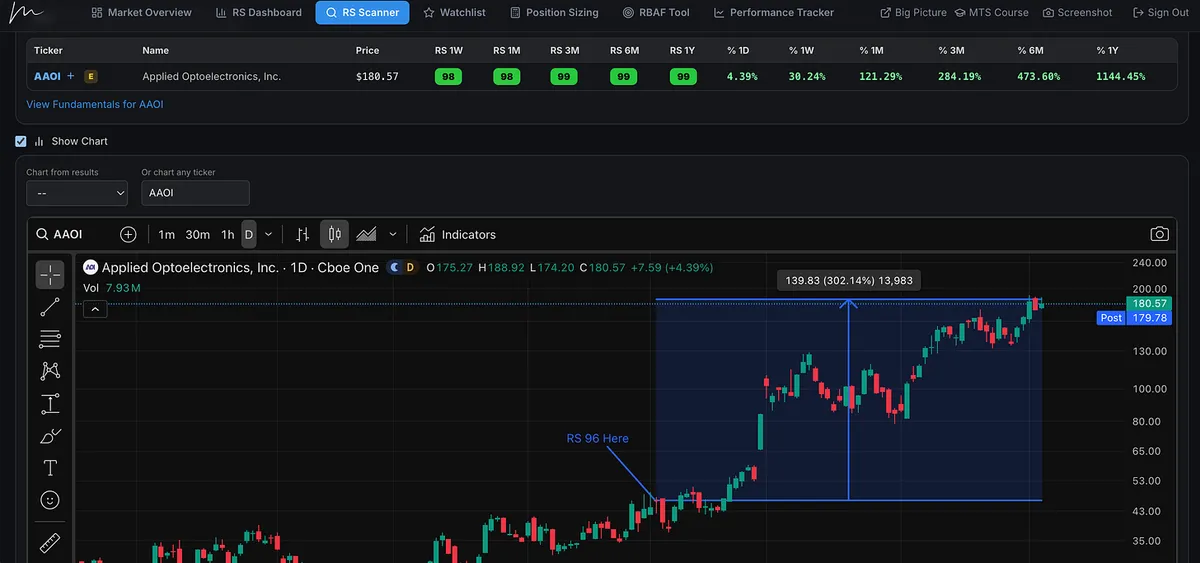
Relative strength.

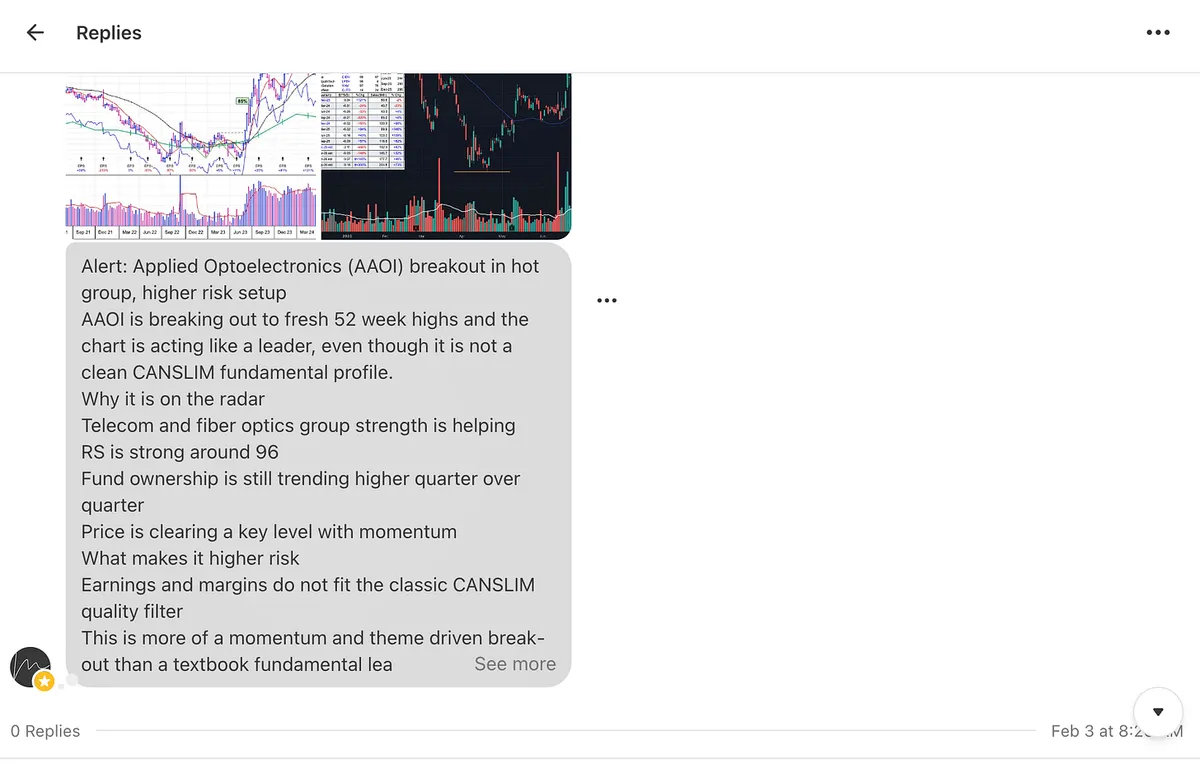
On February 3, I posted AAOI as a breakout in a hot group.

At the time, AAOI had a 96 RS rating.

It was not “cheap.”

And I’m sure plenty of people would have said the same thing they always say about strong stocks:

“But it’s extended.”

Since then, AAOI is up more than 300%.

Let that sink in.

The stock was already strong.

The group was already strong.

The relative strength was already obvious.

And that was the point.

This is exactly why I built the Momentum Trading Strategy Web App and why I literally give this tool to my paid subscribers to use.

The process is simple, but most people skip it:

Follow strength.

Find the strongest industry groups.

Then find the strongest stocks inside those groups.

That is how AAOI ended up on the radar.

AAOI was not random.

It was a strong stock in a strong group, telecom and fiber optics, breaking out with powerful relative strength.

The biggest winners rarely look comfortable early. They usually look “too high,” “too extended,” or “too late” to people who are trained to look for bargains instead of leadership.

Relative strength does not guarantee a stock will become a huge winner.

But it does one very important thing:

It puts you in the right hunting ground.

Strong stocks in strong groups, breaking out to new highs, with institutional demand behind them, are where many of the biggest moves begin.

This is why I don’t spend my time randomly bouncing around looking for the next hot ticker.

I start with relative strength.

I look for leadership.

I track the strongest industry groups.

Then I wait for the market, the setup, and the risk/reward to align.

AAOI was not a surprise.

It was on the radar because the process put it there.

The screenshots show the “then” and the “now.”

February 3: AAOI with a 96 RS rating.

Today: AAOI up more than 300%.

This is why relative strength matters.

Not because every strong stock works.

But because the biggest winners are almost always strong before most people believe they can go much higher.

View on Substack ↗

The Math That Destroys Traders

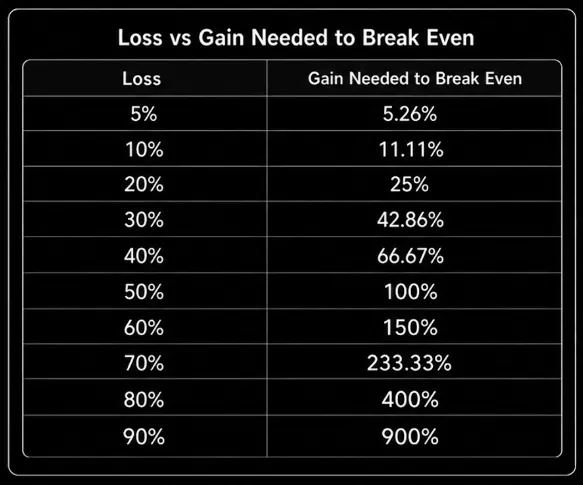
Most of you have probably seen this table before.

But the lesson is worth repeating:

Losses work geometrically against you.

  • A 10% loss requires an 11.11% gain to get back to break even.

  • A 20% loss requires a 25% gain.

  • A 40% loss requires a 66.67% gain.

  • A 50% loss requires a 100% gain.

And once drawdowns get large, the math starts working brutally against you.

If you have never seen this before and you are actively trading the markets, this is something you should probably prioritize understanding ASAP.

But for those of you who already know this, the real question is:

What are you actually doing about it?

  • Do your position sizing rules help keep your drawdowns from getting too large?

  • Does your strategy account for losing streaks?

  • Are you managing risk in a way that keeps you from needing a massive gain just to get back to break even?

Because knowing this table is not enough.

A lot of traders understand the concept, but their actual execution does nothing to prevent the big losses this table warns about.

And I am not just talking about individual trades.

I am talking about your overall account.

If your account is down 40%, you now need 66.67% just to get back to break even.

That is a completely different problem than being down 10% or 15%.

This is why position sizing matters so much.

In many cases, you do not even have to change the strategy itself.

  • Same entries.

  • Same exits.

  • Same win rate.

  • Same average gain.

  • Same average loss.

But change the position size, and the drawdown profile can look completely different.

One version of the same strategy might experience a 10% to 20% drawdown over hundreds of trades.

Another version, with the position size too aggressive, might experience 40%, 50%, or 60% drawdowns.

Same strategy.

Different sizing.

Completely different experience.

Let that sink in.

If you do not understand this, you probably need to spend less time looking for the next hot stock and more time learning how position sizing, drawdowns, and risk management actually work.

This is exactly why I paused doing what I honestly enjoy most to create the Momentum Trading Strategy Course.

I’ll be honest, I do not enjoy making this thing as much as I enjoy tradings, writing about trading, screening for and sharing stocks, and sharing ideas.

It has been a lot harder and more time-consuming than I expected.

But I realized something:

No matter how many strong stock ideas I share, many people will still lose money if they do not have the foundation.

  • They need to understand position sizing.

  • They need to understand drawdowns.

  • They need to understand risk management.

  • They need to understand trade planning.

  • They need to understand how to survive the losing streaks that every trader eventually goes through.

So I built the course to teach that foundation.

Then I realized something else:

A lot of people also do not have the tools to actually apply it.

So I built the Momentum Trading Strategy Web App to bring everything together in one place.

  • Big picture market analysis.

  • Stock screening.

  • Finding relative strength and leadership.

  • Position sizing tools.

  • Trade planning templates.

  • Trading journal.

  • Performance analytics.

  • Trade review.

The goal is to connect what you learn in the course with the tools needed to actually apply it.

Because finding winners is only one part of trading.

Surviving long enough to benefit from them is the part most traders underestimate.

View on Substack ↗

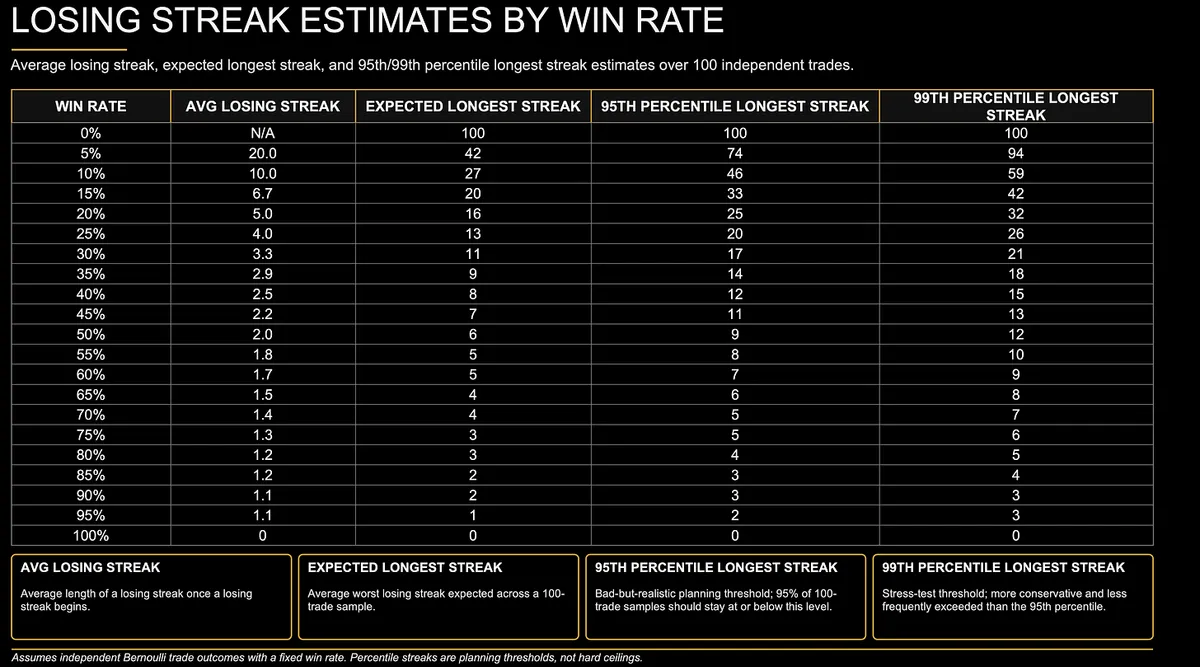
A 50% Win Rate Does Not Mean Win, Loss, Win, Loss

This is one of the biggest misconceptions in trading.

A lot of traders hear “50% win rate” and subconsciously assume the results will show up like this:

  • Win.

  • Loss.

  • Win.

  • Loss.

  • Win.

  • Loss.

But that is not how probability works.

Even with a 50% win rate, you can still run into six, seven, eight, or even nine losses in a row over a large enough sample.

That does not automatically mean the strategy is broken.

It means losing streaks are normal.

The problem is most traders do not plan for them.

They build their risk around the trade they want to win, not the losing streak they are almost guaranteed to experience.

That is where proper position sizing matters.

Position sizing is not just about maximizing returns.

It is about staying alive long enough for your edge to play out.

Because if your system cannot survive a normal losing streak, it does not matter how good your setups are.

It is only a matter of time before one bad sequence takes you out.

This is why I spend so much time on risk management and position sizing in Module 6 of the Momentum Trading Strategy course.

You do not manage risk because you are scared.

You manage risk because losing streaks are part of the game.

Plan for them before they happen.

View on Substack ↗

How to Get Bigger Size Without Taking Bigger Risk

Bruce Kovner said:

“Whenever I enter a position, I have a predetermined stop. That is the only way I can sleep. I know where I’m getting out before I get in. The position size on a trade is determined by the stop, and the stop is determined on a technical basis. For example, if the market is in the midst of a trading range, it makes no sense to put your stop within that range, since you are likely to be taken out. I always place my stop beyond some technical barrier.”

That is one of the most important ideas in trading.

Your stop should not be some random percentage that makes the math look clean.

Your stop should come from the chart.

  • Where does the trade stop making sense?

  • Where would the market prove you wrong?

  • Where is the technical barrier?

That is where the stop belongs.

Then your position size is built around that risk.

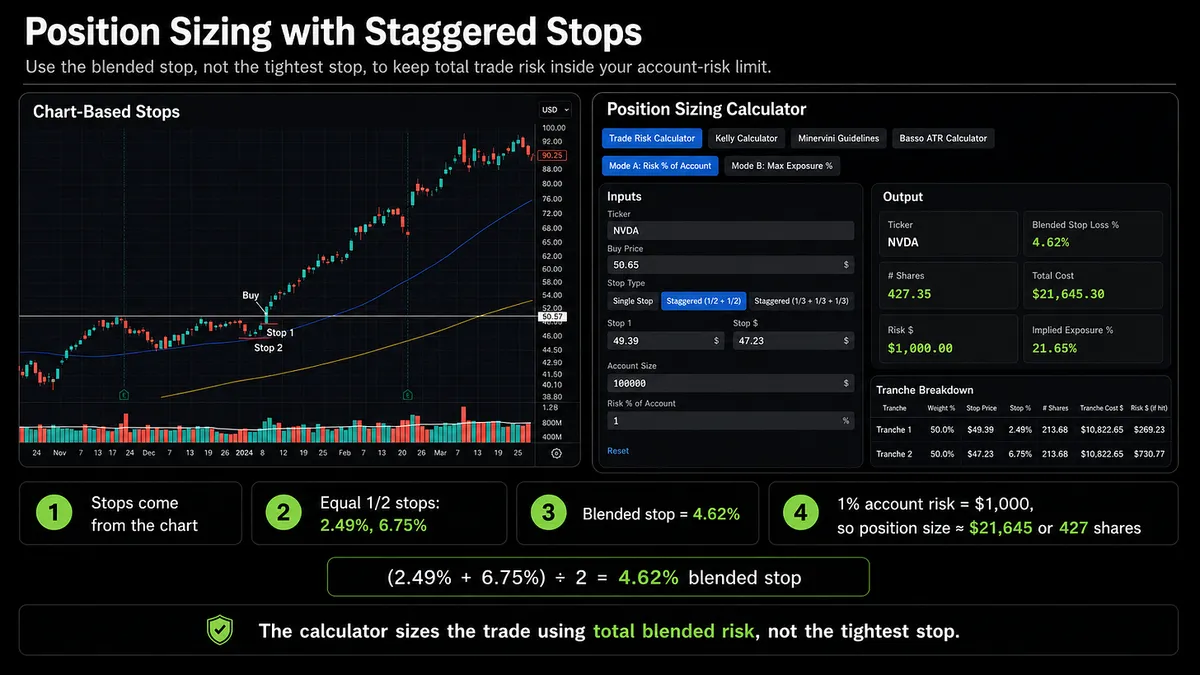
In this example, the standard daily/weekly chart stop is under the prior higher low.

That is Stop 2, about 6.75% below the entry.

If you risk 1% of a $100,000 account using that single stop, your position size would be around 292 shares.

The setup is lining up on multiple timeframes, and it has many of the characteristics you want to see in an A+ setup:

  • Strong daily and weekly breakout.

  • Tightening price action.

  • VCP-style contraction.

  • Big earnings and sales.

  • A hot industry group aligned with the bull market theme.

  • High relative strength.

Then you see an opportunity to use the intraday chart to enter with more precision, similar to how traders like Kristjan Kullamägi and Dan Zanger have done with Opening Range Breakouts (ORB).

In that case, you can use a staggered stop.

Your first stop could be the opening range low.

Your second stop could still be the deeper daily/weekly chart stop.

Half the position uses the tighter intraday stop.

Half the position uses the wider daily/weekly stop.

Same 1% account risk.

More efficient position sizing.

In this example, instead of risking 6.75% on the full position, the blended stop is 4.62%.

So with the same 1% account risk, the position size goes from roughly 292 shares to 427 shares.

That is the power of combining multiple timeframes with proper position sizing.

You are not taking more portfolio risk.

You are using a tighter, more precise entry to increase size while still respecting the deeper chart structure.

This is not something you do randomly.

It is for higher-conviction setups where the stock has the right ingredients.

This is one of the position sizing strategies I cover in Module 6: Risk Management & Position Sizing inside the Momentum Trading Strategy course.

Because managing risk is not just about knowing where your stop is.

It is knowing how your entry, stop, position size, timeframe, and tools all work together.