Momentum Trading Strategy

Notes

Short lessons on momentum trading, every day.

Every note from Substack, in one place: risk, setups, leading stocks, market conditions and the mindset behind them. Search them, browse by topic, or filter by stock.

Showing 641–660 of 1226 notes

View on Substack ↗

The Most Boring Part of Trading Is Usually What Separates the Survivors From Everyone Else

Most traders want more charts, more stock picks, more setups, and more names to watch.

But when you study the Market Wizards, one principle keeps showing up across different styles, markets, and time frames:

Risk management.

Bruce Kovner was asked what advice he would give the novice trader.

His answer:

“Risk management is the most important thing to be well understood.”

Then he added the part most traders need to hear:

Most novice traders trade too big.

Whatever position size they think they should trade, they should probably cut it dramatically.

That is the part people skip.

Position sizing is not exciting.

Drawdowns are not exciting.

Losing streaks are not exciting.

Expectancy is not exciting.

But this is often the difference between a trader who survives long enough to compound and a trader who keeps starting over after every account-damaging drawdown.

There are endless charts online.

Endless opinions.

Endless stock ideas.

But very little practical education on how to manage risk, size positions, control exposure, handle losing streaks, and understand whether a strategy actually has positive expectancy.

That is exactly what Module 6 is about.

Risk management.

Position sizing.

Expectancy.

Drawdowns.

Losing streaks.

Portfolio exposure.

When to press.

When to get smaller.

When to move to cash.

I also added Dr. Van Tharp’s Marble Game and Optimal Sizing Calculator inside the Momentum Trading Strategy Web App, so traders can test different systems across win rates, gain/loss ratios, drawdowns, losing streaks, and position sizes.

Because knowing a strategy has an edge is not enough.

Position size can determine whether that edge compounds or eventually destroys the account.

Module 6 is now live for paid subscribers:

https://tradingmomentum.substack.com/p/momentum-trading-strategy-risk-management
On SubstackMomentum Trading Strategy: The 100-Year Playbook Behind the Biggest Winning Stocks — Module 6 Risk Management & Position Sizing
View on Substack ↗

“Relative Strength Doesn’t Work.” Okay.

“It only finds extended names.”

“I don’t want to buy strong stocks because they’ve already moved too much.”

I hear this all the time.

Most of that fear does not come from relative strength being flawed.

It comes from people not knowing how to manage risk, or frankly, not studying big winning stocks cycle after cycle.

If you understand position sizing, proper entries, logical stops, and low-risk, high-reward setups, high relative strength is not something to fear.

It is something that should grab your attention.

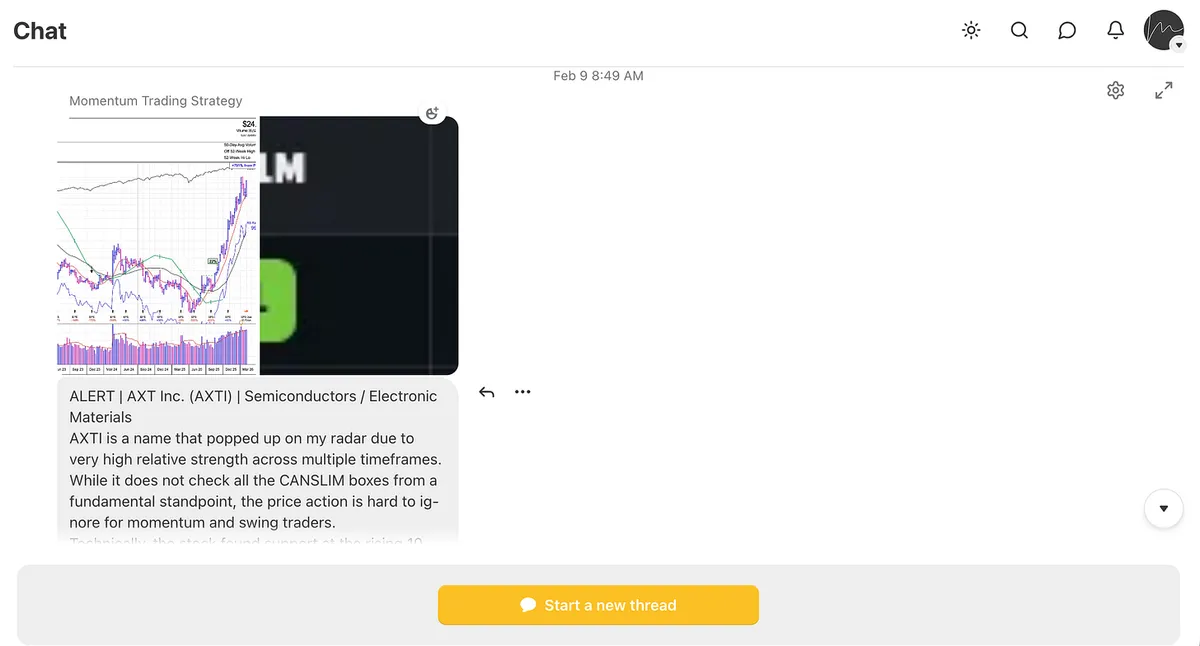
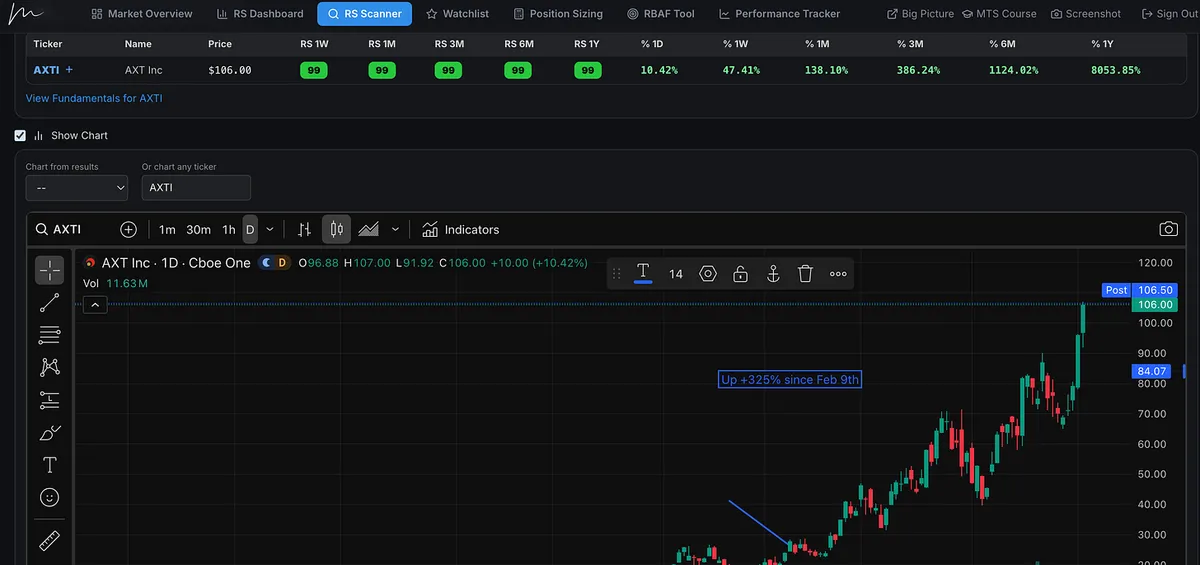
AXTI is a great example.

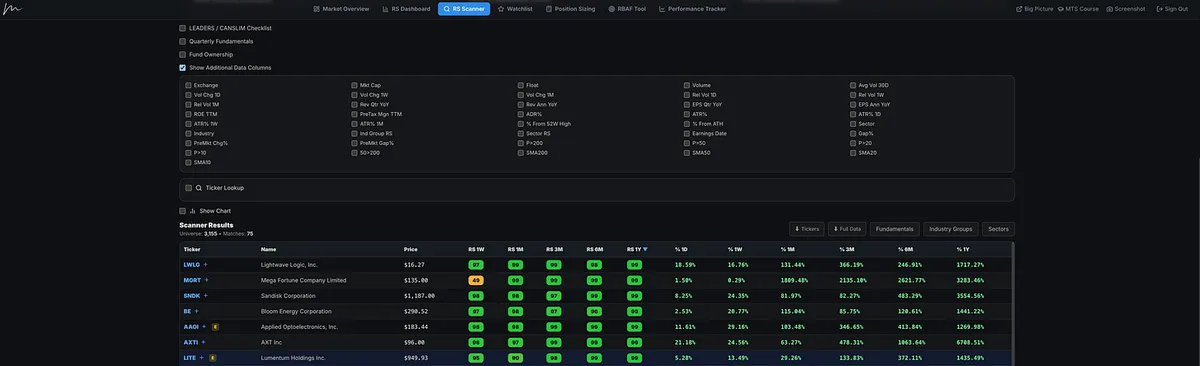
Back in February, it had a 99 RS and was sitting near the top of my Relative Strength Stock Screener.

It kept showing up week after week.

Month after month.

And since then, it has gone up more than 325%.

That is what strong stocks often do.

They go much higher than most people expect.

And weak stocks often go much lower than most people expect.

AXTI also had something else going for it:

A strong stock, in a strong group, aligned with a major bull market theme.

That is a principle that has shown up in market leaders for decades.

Follow relative strength.

Do not fear strength just because other people do not know how to manage risk.

If the trade does not work, you get out with a small loss.

If it works, you have the potential for a huge gain.

View on Substack ↗

Only Traders Understand This Kind of Pain

This story Mark Weinstein told in Market Wizards always makes me laugh.

Only another trader would really understand this.

But underneath the humor, there is a serious lesson. Even some of the best traders went through the same growing pains and made the same mistakes most of us make early on.

And when you read a story like this, you can see the pain usually comes from exactly what Module 6 of the Momentum Trading Strategy Course is going to cover:

Risk management and position sizing.

Almost all the mental stress and pain we experience in trading comes from violating risk management and position sizing principles.

Mark Weinstein, as great as he became, experienced those mistakes early in his career as well:

“Before that trade, I had nearly $1.5 million in my trading account. So I was losing nearly 10 percent of my equity level prior to the trade each day. I was devastated. I felt like I was wounded in a trench and watching myself bleed to death. The market went limit-down five days in a row, and I lost over $600,000. On the fifth day, I remember sitting in a park holding hands with a girl I had picked up, literally crying on her lap. I was practically in a psychotic state. I thought about getting out of the business altogether. I started to think that what everybody was telling me was true, maybe it was just luck that I had made money all those years. I worried that if I continued trading, I could wind up losing it all, and being forced to go back to some job I didn’t like.”

The lesson is simple:

Cut losses fast.

Do not size too big.

Know where you will get out before you get in, and follow the plan.

Prepare for contingencies because things will go wrong.

Risk management and proper position sizing are not optional.

They are the foundation.

View on Substack ↗

The Best Stocks Usually Look Strong Before They Look Obvious

William O’Neil said this in Market Wizards, and it still applies today:

“The 500 best-performing stocks during the 1953–1985 period had an average relative strength of 87 before their major price increase actually began.”

That is the point most investors miss.

The best stocks usually do not start their big moves from weakness.

They start from strength.

They are already outperforming the market, already showing demand, and already separating themselves from the average stock before the crowd fully recognizes what is happening.

This is why relative strength matters so much.

It helps us focus on where institutional money is already flowing instead of wasting time digging through laggards because they look “cheap.”

Strong stocks can always get stronger.

LITE is a recent example. Back in January, it already had a 99 Relative Strength Rating, and it still went on to gain more than 100%.

Strength should not scare you away.

It should get your attention.

Weak stocks can stay weak much longer than people expect.

The goal is not to find the lowest-priced stock.

The goal is to find the leaders before the move becomes obvious.

View on Substack ↗

Stop Looking for a Revolutionary Trading System

“Right now, I consider myself to be an expert modeler. By that, I mean that if someone can do something well, then I can figure out how they do it and teach those skills to anyone else.” — Dr. Van K. Tharp

This is exactly how I found success in trading.

I did not invent the concepts I teach. I do not take credit for them. I studied what worked, modeled the best traders I could find, and built a process around those principles.

That is also the foundation of the Momentum Trading Strategy Course.

Too many people in trading try to sell ideas as if they invented some revolutionary new strategy. In most cases, they are either full of ego or selling something that will not last.

As David Ryan has said, “there is nothing new under the sun.”

Markets change on the surface, but human behavior does not. Fear, greed, supply, demand, leadership, relative strength, accumulation, distribution, risk management, and position sizing still matter.

It is the same in business.

The tools change. The platforms change. The principles do not.

So instead of wasting years searching for a revolutionary system, find something proven, study it deeply, and work to execute it better than most people are willing to.

That is where the edge is.

And do not feel bad if you spent time looking for something “revolutionary.”

I did too.

View on Substack ↗

This Is What an Episodic Pivot Looks Like

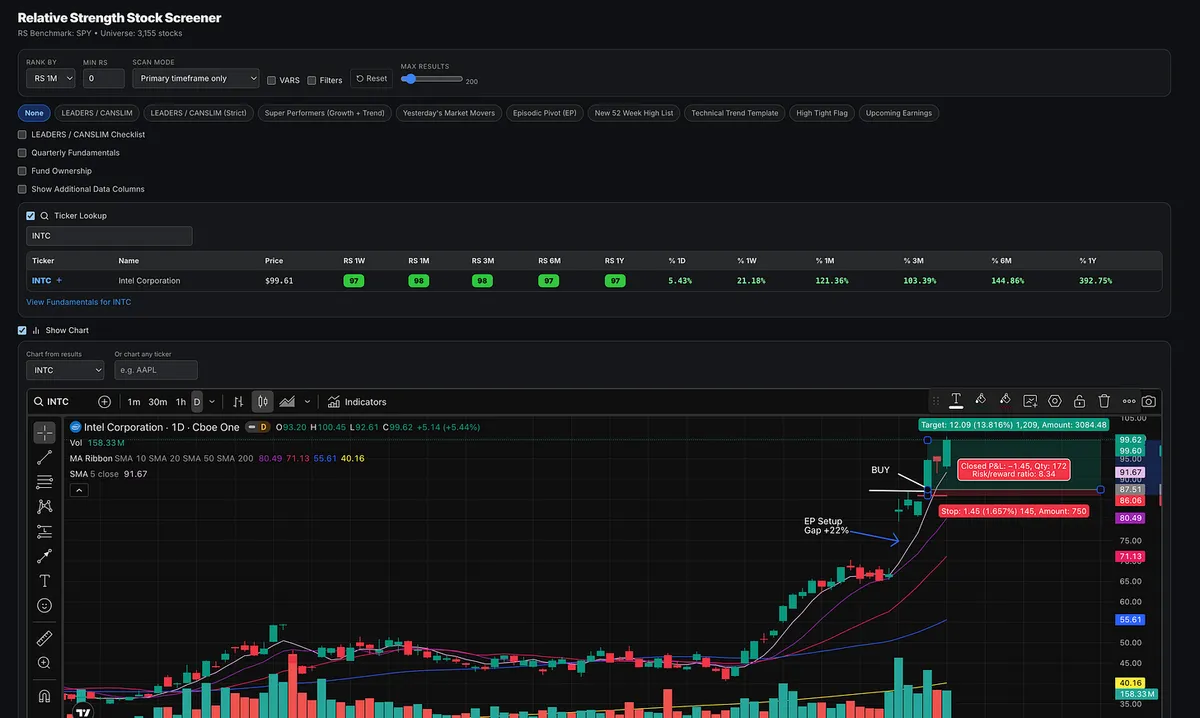
INTC showed up as a clean EP setup.

The stock gapped up +22%, held the gap, then broke out on big volume using an opening range breakout entry.

That is the key.

The gap alone was not the play. After the initial move, price paused, held up, and then pushed to new highs as volume came back in. That gave traders a more precise way to get involved instead of blindly gambling on the gap.

This is why I like combining:

EP catalyst + relative strength + volume expansion + opening range breakout entry

That combination can create a low risk, high reward play.

In this case, the stop was placed at the low of day, giving a clear line in the sand that was much tighter than using the gap-day higher low or previous day low.

This is the type of setup worth studying.

View on Substack ↗

Before You Look for Stocks, Read the Market First

Before the market opens, step back and read the big picture.

This is not the glamorous part of trading.

It is not a hot stock pick. It is not a prediction. It is not some exciting new indicator.

It is repetition.

Every week, we check the same things: trend, breadth, leadership, volatility, distribution, rates, credit, liquidity, relative strength and more.

That is the point.

William O’Neil made Market Direction the “M” in CAN SLIM for a reason. Mike Bellafiore teaches day traders to understand the big picture for a reason. Many of the Market Wizards, including Michael Marcus, Bruce Kovner, Richard Dennis, and Paul Tudor Jones, studied Marty Zweig’s work for a reason.

Great traders do not operate in a vacuum.

They understand the environment first.

This week’s Big Picture Market Pulse breaks down where the market stands, what continues to lead, and where relative strength is showing up beneath the surface.

Read it before the open. Then go stock hunting.

https://tradingmomentum.substack.com/p/big-picture-market-pulse-may-3-2026

On SubstackBig Picture Market Pulse | May 3, 2026: Growth Leads as New Highs Confirm the Trend
View on Substack ↗

The $1,000 Car Payment Is Keeping People Poor

A lot of people complain about money while living paycheck to paycheck.

And I’m not talking about people in poverty.

I’m talking about middle-class and upper-middle-class Americans making good incomes while driving $100,000 vehicles, fully loaded Suburbans, Escalades, Mercedes, BMWs, Audis, and other status symbols they can barely justify.

They make money.

Just not enough money to support the lifestyle they are trying to maintain.

That is the trap.

So many people are stuck in the materialistic rat race of keeping up with the Joneses and because so much of society does it, it feels normal.

But normal does not mean sustainable.

How many of those same people have millions saved by their 40s or 50s?

Not many.

The problem is not always income.

The problem is that every time income goes up, liabilities go up with it.

Bigger house.

Bigger car.

Bigger payment.

Bigger lifestyle.

Same financial stress.

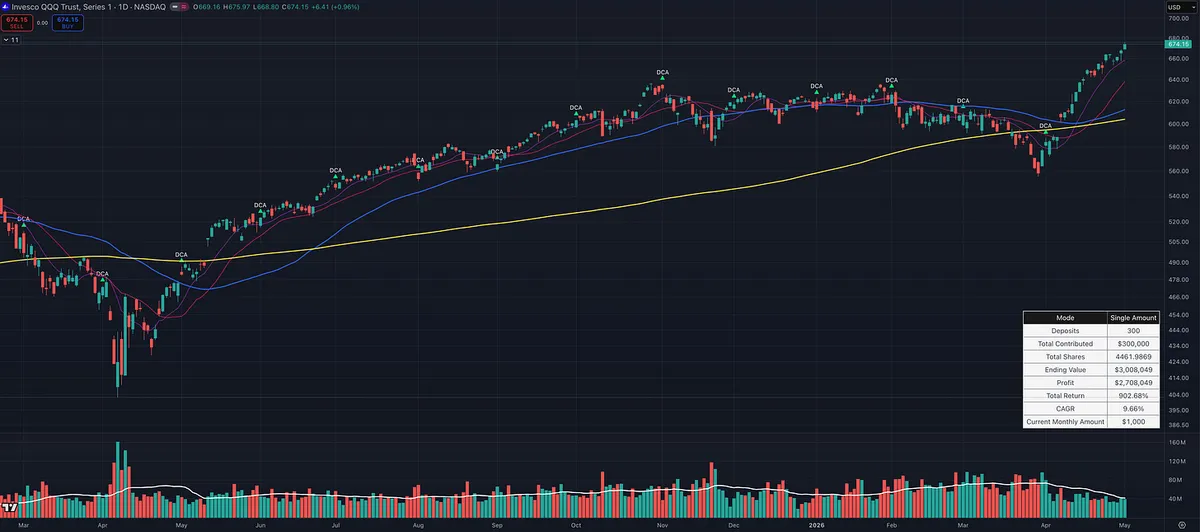
Now look at the chart.

$1,000 invested every month into QQQ over this 25-year period would have required $300,000 in total contributions.

That is not some impossible number.

That is the equivalent of a luxury car payment redirected into ownership instead of consumption.

The result?

Roughly $3 million.

The person who chose the car has a depreciating asset.

The person who chose discipline has a life-changing portfolio.

Past returns do not guarantee future results, and QQQ may not repeat this exact return.

BUT that is not the main point.

The point is that consistently buying productive assets beats consistently financing depreciating assets.

I’m a momentum growth trader. I own businesses that generate income. I do not rely only on passive index investing.

But even I deeply respect the power of compounding like this over time.

Even William O’Neil, long before ETFs became mainstream, understood that mutual funds could be a powerful vehicle for long-term growth when held over years.

Most people do not need a complicated strategy to change their financial future.

They need discipline.

Live on 80% of what you make.

Save and invest 20%. (yes, the 80/20 rule)

At a minimum, pay yourself first with 10% every month.

As you make more, save more.

But most people do the opposite.

They make more and add more liabilities.

That is the never-ending rat race.

View on Substack ↗

Stop Trying to Outsmart Strength

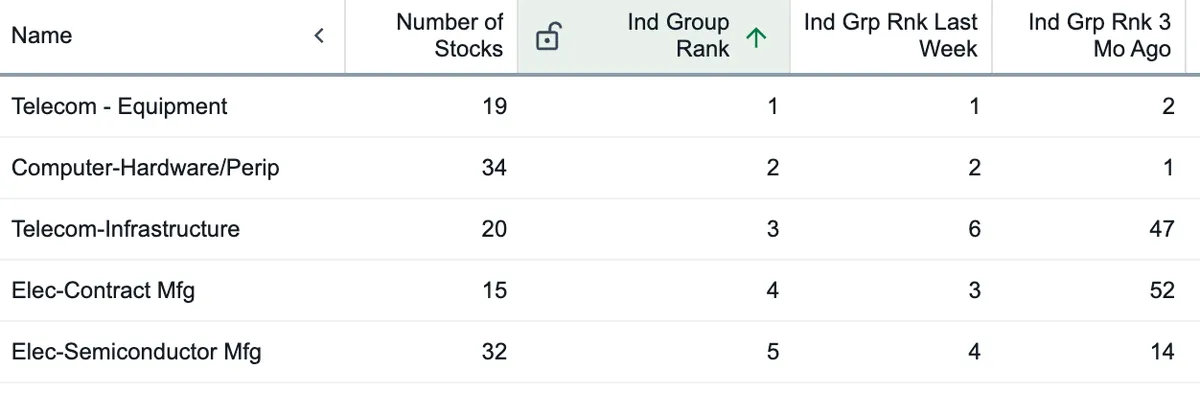
Same industry groups. Week after week.

  • Telecom equipment and infrastructure.

  • Computer hardware/peripherals (data storage).

  • Semiconductors.

There is no secret here.

Computer data storage and telecom have been strong for over a year. Semis have been hot on and off this entire bull market.

Yet traders still want to work harder than smarter.

They keep digging through weak groups, trying to find the “next” thing, while the current leaders keep leading.

At some point you have to ask:

Do you want to be clever?

Or do you want to make money?

Leadership usually leaves clues.

View on Substack ↗

Your Trading System Might Not Be the Problem. Your Position Size Might Be.

Most traders think the problem is their entries.

Sometimes it is.

But sometimes the real problem is position size.

You can have the right stock, the right setup, and the right general idea, but if the position is too large, a normal pullback feels like a crisis.

And if the position is too small, even a good edge barely moves the account.

That is why position sizing matters so much.

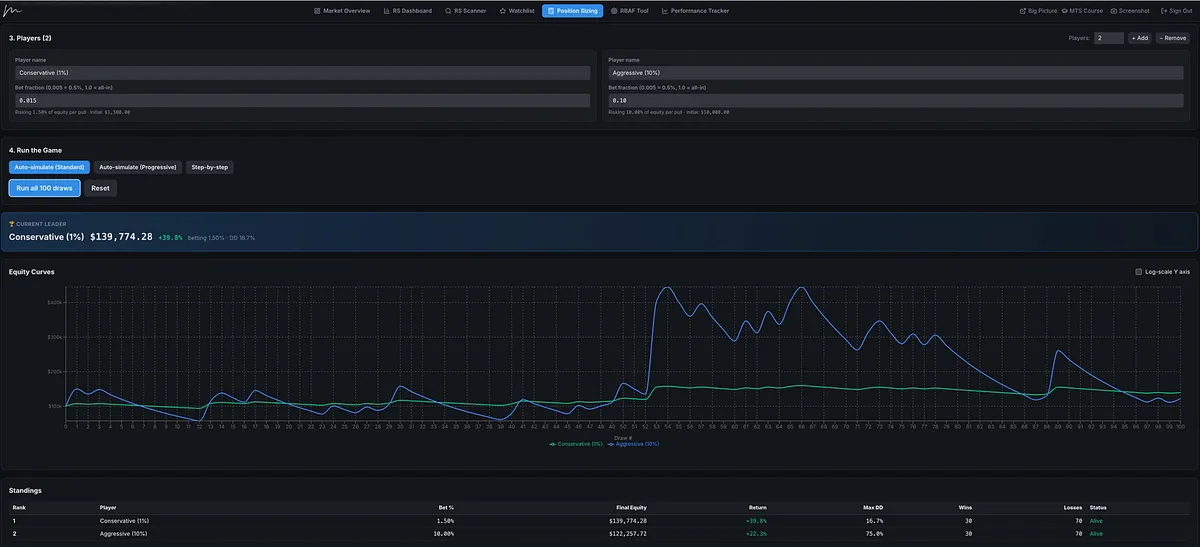
Years ago, I remember reading about Dr. Van Tharp’s Marble Game.

It was one of the simplest but most impactful exercises I ever did for understanding position sizing.

The lesson was obvious once you saw it play out:

The same system.

The same edge.

The same win rate.

The same distribution of outcomes.

But completely different results depending on how much each player risked per draw.

That is when position sizing really started to click for me.

I’m wrapping up Module 6 of the Momentum Trading Strategy Course, which is focused on risk management and position sizing, and it should be released in the next few days.

While building this module, I realized something:

Most people are probably not going to go buy a bag of 100 marbles and physically play the game.

And most people are probably not going to build an Excel or Google Sheets version either.

So I built the marble game directly into the Momentum Trading Strategy Web App.

Inside the app, you can run the marble game digitally, test different win rates, different R-multiple distributions, different bet sizes, and compare players side by side.

I also added features that were not part of the original version.

One of the biggest is progressive exposure.

Instead of risking the same percentage on every draw, you can simulate a more realistic approach where bet size increases slightly after the account builds a profit cushion, and then scales back down if drawdown starts to grow.

This is similar to the idea George Soros talked about:

Risking profits is very different from risking principal.

When you are starting with only your original capital, you may want to be more conservative and keep drawdowns smaller.

But after you have built a cushion, especially in a strong market environment, you may be willing to press a little more in order to maximize the opportunity.

Then, while building the marble game, I realized another issue:

A lot of newer traders may not even know what position size makes sense for their strategy.

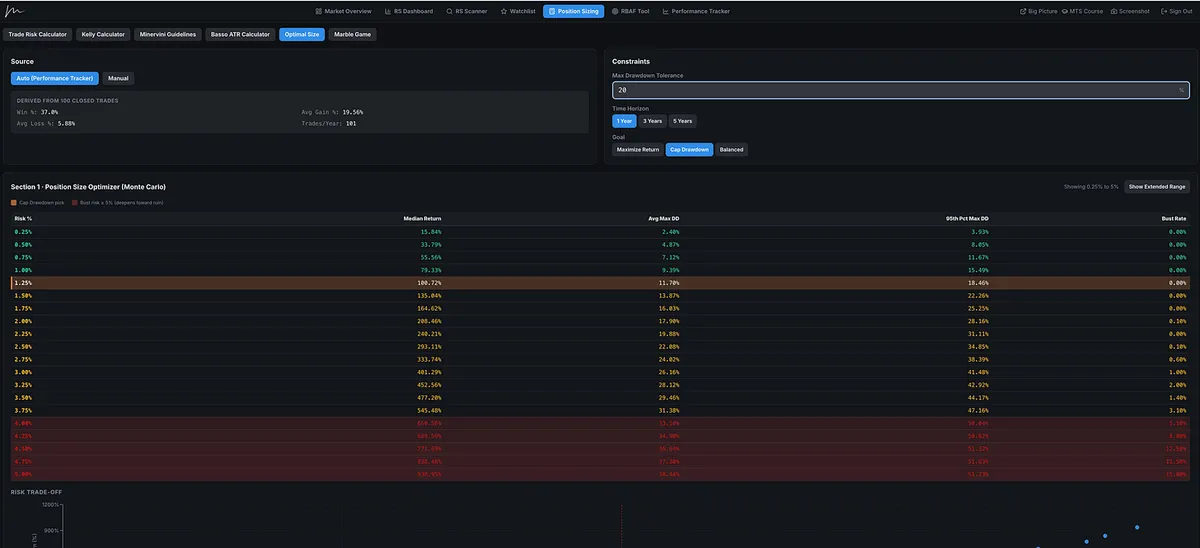
So I also built an Optimal Size tool.

It can pull your actual trading statistics from the performance tracker inside the app, or you can enter your numbers manually.

You input things like win rate, average gain, average loss, and trades per year.

Then it runs Monte Carlo simulations to estimate different position sizes, projected returns, average max drawdowns, 95th percentile max drawdowns, and bust risk.

The goal is not to predict the future.

The goal is to understand the range of possible outcomes based on your trading statistics.

A good system still needs the right size.

Risk too little, and the edge may not move the needle.

Risk too much, and even a positive expectancy system can become untradable.

Position sizing is not just about survival.

It is also about maximizing your system’s profitability while keeping drawdowns within a range you can actually follow.

View on Substack ↗

Do You Know Which Game You’re Playing?

Both traders in this example have an edge, but the source of the edge is different.

Trader A:

Wins 40 percent of the time.

Average gain is 3 times larger than the average loss.

Trader B:

Wins 80 percent of the time.

Average loss is 2 times larger than the average winner.

In this simple example, both can produce the same outcome.

The key lesson is that edge comes from the relationship between win rate, average gain, and average loss.

You do not have to trade like everyone else.

But you do have to know which game you are playing.

If you have a low win rate, your winners must be meaningfully larger than your losers.

But I do not think it is a coincidence that many of the traders in the Market Wizards books who discussed win rate were often below 50% percent, while many rookie and struggling traders are obsessed with having a high win rate.

Beginners want to be right.

Professionals focus on positive expectancy.

View on Substack ↗

Stop Studying the Outliers

You will always find outliers who are successful doing things differently.

That does not just apply to trading.

It applies to almost everything in life.

But the key is to study what the majority of successful winners have in common.

That is what I have focused on.

That is what I am teaching you.

Once you have years of experience and consistent profitability, you can venture into the world of outliers if you want.

But until then, learn the principles followed by the majority of successful traders.

Focus on the things most of them actually do.

And the funny thing is, many of the people who ventured away from the tried and true eventually came right back to it.

When you read Market Wizards, listen for the common principles they share, not just the differences.

People spend too much time arguing about what is better, or why their way is better.

And they miss the golden nuggets.

They focus on the differences instead of the commonalities.

They obsess over strategies, tactics, stock screens, setups, indicators, and all the other noise.

But they miss the part almost every great trader agrees on:

Risk management and position sizing are what matter most.

View on Substack ↗

Would You Take the Risk?

Mark Minervini uses a simple question to explain risk:

Would you run across the street with your eyes closed for one million dollars?

Maybe once.

But would you do it ten times?

A hundred times?

Of course not, and that is the point.

Trading is not one decision.

You are going to make many trades over time.

A reckless risk might work once, but repeated over many trades, the odds catch up with you.

Do not be a gambler trying to get lucky once.

Many retail traders are trying to find the one trade that changes everything.

Professionals are executing a repeatable process that will compound through trade frequency and time.

They are not trying to survive one lucky event.

They are trying to survive hundreds and thousands of decisions.

View on Substack ↗

Most Traders Wait Until It Feels Safe. That’s Why They Miss the Move.

The best market opportunities rarely feel comfortable.

They usually show up when the headlines are scary, social media is bearish, your gut feels uncertain, and every “smart” person has a reason why the market should go lower.

That is exactly what happened back around April 8.

The market had broken down after a multi-month Stage 3. The Nasdaq 100 was below key moving averages. Breadth was horrible. Net new lows were greatly outpacing net new highs. Most traders were scared, and bearish.

Then the market established a low and started moving higher.

For shorter-term swing traders, the early signal may have been price reclaiming the 10-day and 20-day moving averages.

For longer-term traders, the more important signal may have been price reclaiming the 50-day and 200-day moving averages.

The timeframe can be different.

The signal can be different.

But the principle is the same:

When the market starts improving after fear has already been priced in, those are often some of the best low-risk, high-reward areas to begin making pilot buys.

Not full exposure.

Not reckless buying.

Not blindly calling a bottom.

Just controlled, risk-defined entries when the evidence starts to shift.

Even if you waited until the big gap-up day on April 8, there were still a few days, April 8, April 9, and April 10, where traders had a chance to start getting back involved before the market stormed higher again.

But most people did nothing.

They were paralyzed by fear.

They had reasons.

Geopolitics.

Headlines.

Failed ceasefires.

Recession talk and AI driven job losses.

Inflation and supply chain disruptions.

Social media panic.

Very intelligent analysis explaining why they should stay out.

But the market does not pay you for having intelligent reasons to be scared.

It pays you for understanding risk and reward.

In that area, a trader could have entered with a defined stop around the 50-day or 200-day moving average, risking roughly 2% or less depending on the entry.

From there, the market has already moved roughly 11%.

That is more than five times the risk.

That is the entire point.

You do not need to know the future.

You need a repeatable strategy where the upside is meaningfully larger than the downside.

Even if you are wrong several times, one good trade can pay for the small losses and still leave you profitable.

That is why beginners struggle.

At the exact moment they should be testing the market again, they are frozen.

By the time they finally feel safe, the low-risk entry is gone.

Learn a strategy that has worked for decades.

Study price.

Study how markets move.

Study risk/reward.

Study the greats.

Then follow the process when it matters most.

One final point:

Yes, instinct matters.

Some of the best traders in history developed a real feel for the market and the tape.

But if you are new, your instincts are probably not market intuition yet.

They are fear, recency bias, and emotional self-protection.

Real instinct is earned through thousands of hours, repetition, losses, corrections, and experience.

Until then, trust the process more than your feelings.

That is how you stop reacting like the crowd.

That is how you start thinking like a professional.

This is what we study inside Momentum Trading Strategy.

View on Substack ↗

If You Can’t Answer These Questions, You’re Not Trading, You’re Gambling.

Every serious trader and investor eventually learns the same lesson:

Risk management is not optional.

It does not matter if you are a macro trader, growth stock investor, momentum trader, trend follower, or systematic trader.

It does not matter what your timeframe is, whether you are a day trader, swing trader, position trader, or multi-year long-term investor.

The strategies may look different.

The timeframes may be different.

The entries may be different.

The exits may be different.

The data that shows positive expectancy may be different.

But the people who survive long enough to compound capital over months, years, and decades all have one thing in common:

They know how they are managing risk.

The tactics are different.

The principle is the same.

Every legitimate strategy has some way of answering the same questions:

  • How much can I lose?

  • Where am I wrong?

  • How will I know I am wrong?

  • How much of my total equity is at risk?

  • What happens if this trade or investment goes completely against me?

  • If the trade goes in my favor, where am I a seller?

  • Am I managing risk based on emotion, or based on a defined process?

Because profitable trading is not just about finding good ideas.

It is about having a positive expectancy system and managing risk so you can stay in the game long enough for that edge to play out.

That means you should know your numbers:

  • What is my average gain?

  • What is my average loss?

  • What is my win rate?

  • What is my gain/loss ratio?

  • What is my adjusted gain/loss ratio?

  • What is my profit factor?

  • What is my expectancy?

  • What is my max drawdown?

  • What is my average MAE, or maximum adverse excursion?

  • What is my average MFE, or maximum favorable excursion?

There are more, but these are a few key metrics.

These are not just trading analytics.

They are survival metrics.

Your average gain, average loss, and win rate tell you whether your system has positive expectancy.

Your profit factor tells you how much you are making for every dollar lost.

Your max drawdown tells you whether you can financially and psychologically survive the difficult periods.

Your MAE tells you how much pain you are allowing trades to go through before they work or fail.

Your MFE tells you how much opportunity you are capturing versus how much you are giving back.

A trader can look profitable on paper but still be carrying hidden risk.

If someone is constantly sitting through massive unrealized losses before a trade finally works, that may show up as a winning trade in the final results.

But the process underneath may be dangerous or may not be sustainable over time.

A system can have positive expectancy and still be nearly impossible to execute if the drawdowns are too large, the volatility is too extreme, the position sizing is too aggressive, or the trader is regularly allowing small mistakes to become big account-threatening losses.

That is why risk management is not just about stop losses.

It is about position sizing.

It is about exposure.

It is about knowing your numbers.

It is about understanding whether your strategy is actually repeatable, or whether you simply got lucky during a favorable stretch.

Different types of investors and traders may manage risk differently, but the successful ones all do it.

And if someone claims they want to be a serious trader or investor but cannot answer these questions, they are probably not operating with a process.

They are gambling.

The market will forgive bad trades.

It will not forgive bad risk management forever.

View on Substack ↗

You Don’t Need One Monster Winner to Have a Monster Year

Everyone wants the 100% winner.

And yes, we study the greatest winning stocks in history because that is where some of the best opportunities are found, both for swing trading and position trading.

But here’s what a lot of traders miss:

You can also compound your way to an exceptional year through a series of smaller winners.

Not every triple-digit year comes from catching one massive stock.

Sometimes it comes from stacking 10%, 15%, or 20% winners while keeping losses contained at 5%, 6%, or 7%.

That is the power of compounding through trade turnover, not just time.

And that is the power of a positive expectancy system.

If your average winner is meaningfully larger than your average loser, you do not need to be right all the time.

And you do not need every trade to be a home run.

A few big winners are great.

But a repeatable process that produces steady winners, controls losses, and turns capital over efficiently can be just as powerful.

The goal is not to predict the one perfect trade.

The goal is to have a strategy where the math can work over and over again.

View on Substack ↗

You Can Sit Out Half the Year, Be Wrong 65% of the Time, and Still Finish Up Triple Digits

Most traders think a big year comes from constantly trading.

It doesn’t.

A big year usually comes from knowing when to press the gas and knowing when to do absolutely nothing.

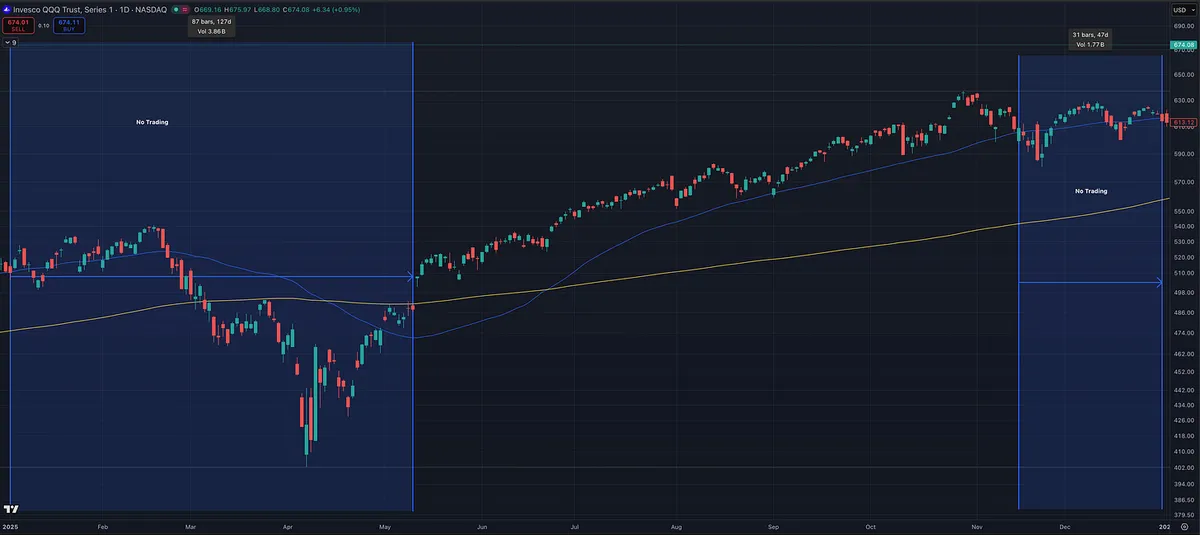
Look at the chart.

The blue areas were no-trade zones.

That is not weakness.

That is discipline.

In this example, the real opportunity window was the Stage 2 uptrend from around May 12, 2025 to November 14, 2025.

That is where the system gets to work.

Here’s the point:

A trader could spend 82 trading days doing nothing, have 104 losing trades, win only 35% of the time, and still have a triple-digit year.

How?

Because the winners are much larger than the losers.

Example:

35% win rate

25% exposure per trade

17% average gain

5% average loss

That means:

A winner adds about +4.25% to the account.

A loser subtracts about -1.25% from the account.

Over the year:

56 wins × 4.25% = +238%

104 losses × 1.25% = -130%

Simple net return: +108%

Estimated compounded return: +178.05%

That is with only a 35% win rate.

Now compare that with a trader who wins more often, but has a smaller gain-to-loss spread.

Example:

50% win rate

25% exposure per trade

14% average gain

7% average loss

A winner adds about +3.5% to the account.

A loser subtracts about -1.75% from the account.

Over the year:

58 wins × 3.5% = +203%

58 losses × 1.75% = -101.5%

Simple net return: +101.5%

Estimated compounded return: +164.14%

That trader could also spend around 120 days not trading at all and still finish with a triple-digit year.

This is why win rate alone is not the game.

The real game is:

Knowing when conditions are right.

Avoiding the chop.

Keeping losses controlled.

Pressing when the market is rewarding your system.

Letting the math work over a large enough sample.

You do not need to trade every day.

You do not need to be right all the time.

You need a system with positive expectancy, enough discipline to sit in cash when conditions are poor, and enough conviction to press when the window opens.

View on Substack ↗

Staggered Stops Can Help You Stay With a Trade Without Losing Control of Risk

Not every trade needs to be all-or-nothing.

Sometimes, instead of putting the entire position at one stop level, you can split the position into pieces and give each piece its own stop.

That is the idea behind staggered stops.

The benefit is flexibility.

A tight first stop can reduce exposure quickly if the trade starts acting wrong.

A wider second or third stop can give the remaining position more room to survive normal volatility, shakeouts, or a quick test of support.

This can be especially useful when the chart has multiple logical stop areas.

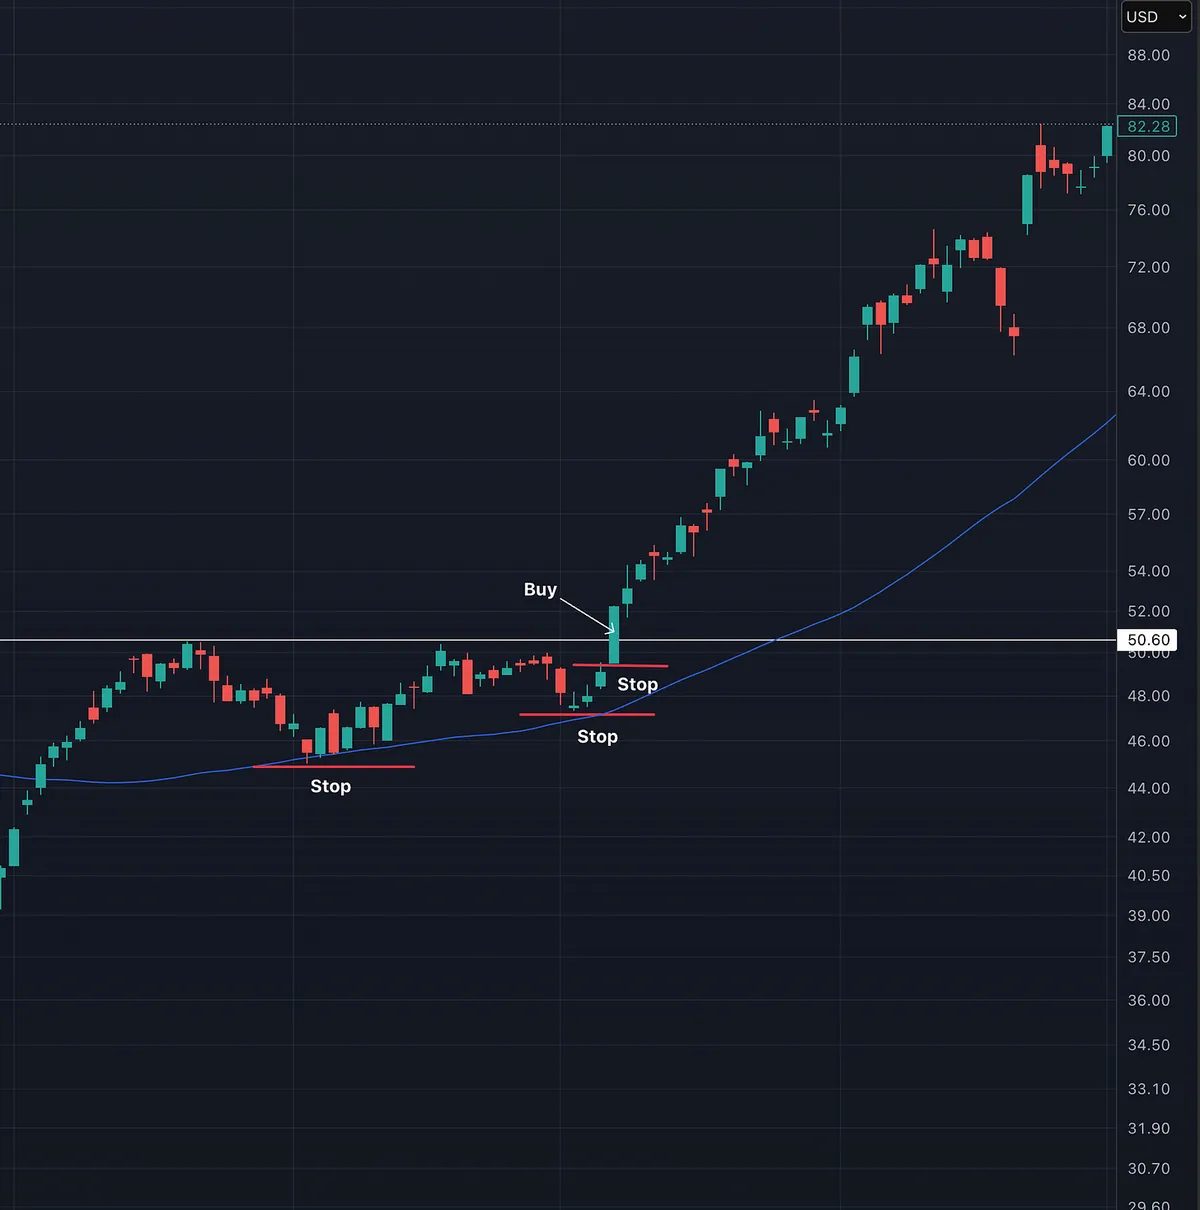
For example, on this chart:

First stop: under the low of the entry day, about 2.5% below entry.

Second stop: below the most recent higher low, about 6.75% below entry.

Third stop: below the prior higher low, about 11% below entry.

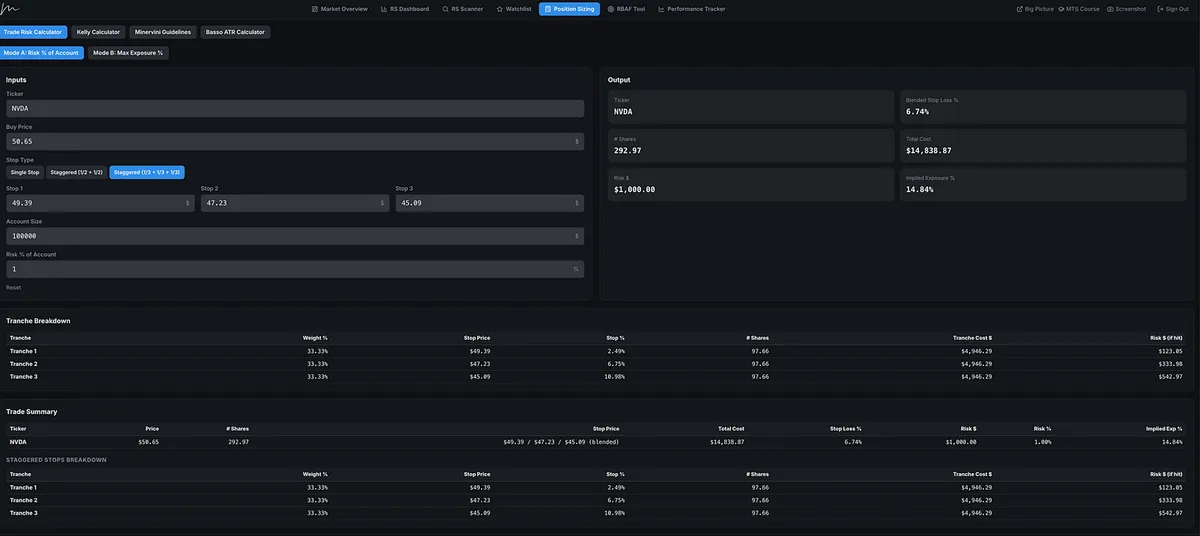
If the position is split into equal thirds, the blended stop is:

(2.5% + 6.75% + 11%) ÷ 3 = 6.75%

So if all three stops are hit, the total loss is roughly 6.75% of the position value, before slippage.

Staggered stops can help you avoid getting completely shaken out on normal noise, but they do not eliminate risk.

They only work if the total position size is based on the blended stop, not the tightest stop.

If you size the full position using the 2.5% stop, but two-thirds of the position are allowed to fall to 6.75% and 11%, your real risk is much larger than you think.

Used correctly, staggered stops let you do two things at once:

Protect part of the position quickly if the trade starts failing.

Give the rest of the trade enough room to prove itself.

Remember:

Stops come from the chart.

Account risk sets the limit.

Position size is based on total trade risk.

And staggered stops should be sized using the weighted average of the stop levels.

View on Substack ↗

The Market Doesn’t Care Where You Got In

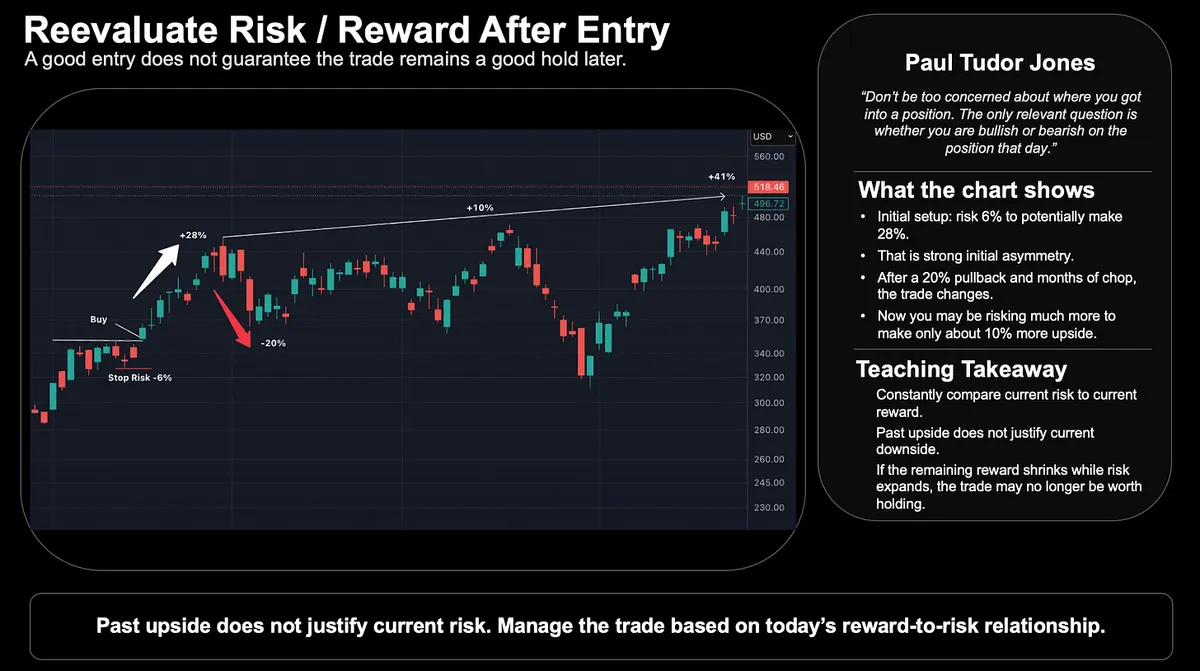
Paul Tudor Jones said:

“Don’t be too concerned about where you got into a position. The only relevant question is whether you are bullish or bearish on the position that day.”

This is one of the most important trade management lessons most rookie traders miss.

They judge the trade only from their original entry.

But risk-reward changes as the trade develops.

In this example, the initial setup was strong:

Risk: -6%

Potential reward: +28%

That is a good asymmetric opportunity.

But after the stock runs, pulls back 20%, chops sideways for months, and only offers around 10% more upside from that point, the trade has changed.

The initial trade may have been good.

The later hold may not be.

That does not mean holding is always wrong.

It means every hold needs to be judged by the current risk-reward, not the original entry.

Past upside does not justify current risk.

Your entry price is history.

The better question is:

Would I still buy this stock here today?

If not, why am I still holding the full position?

View on Substack ↗

Stop chasing stock tips. Start building a real trading process.

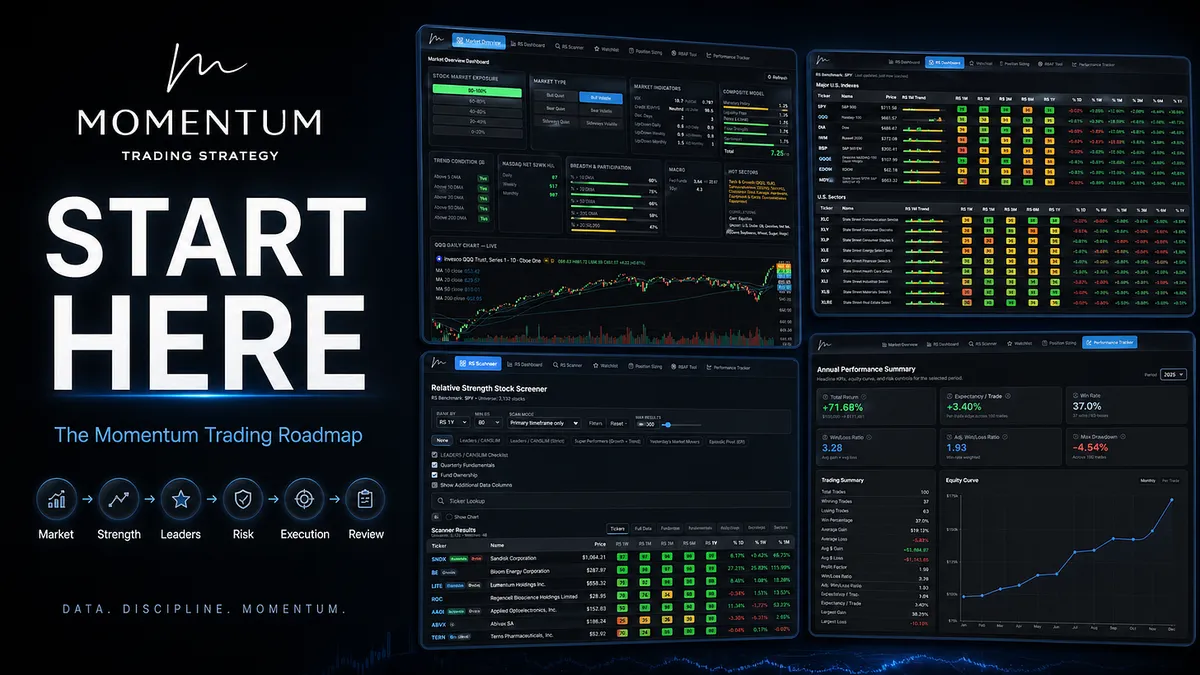
I just put together a full “Start Here” roadmap for Momentum Trading Strategy.

If you are a new paid subscriber, this is where I would begin.

If you are a free subscriber and have been wondering what is actually included, this gives you the full lay of the land.

Inside, I walk through the complete process:

  • MTS Course

  • Market Overview Dashboard

  • Big Picture

  • Relative Strength Dashboard & Stock Screener

  • Watchlists Tool

  • Risk Management & Position Sizing Tools

  • Trade Planning

  • Trade Journaling

  • Performance Review and Analytics

  • Paid Subscriber Chat (purpose)

The goal is not to memorize a few patterns or chase random tickers.

The goal is to build a repeatable process for finding leaders, managing risk, and improving over time.

https://tradingmomentum.substack.com/p/start-here-the-complete-roadmap-for

ArticleStart Here: The Complete Roadmap for Learning Momentum Trading the Right Way