
Trading articles/Start Here: The Complete Roadmap for Learning Momentum Trading the Right Way
Apr 30, 2026 · Momentum Trading Strategy
Start Here: The Complete Roadmap for Learning Momentum Trading the Right Way
Learn how to read the market, find leadership, manage risk, and build a repeatable momentum trading process without chasing stock tips
Originally published on Substack.
Before you begin: I recommend reading the roadmap below first, then watching the video. The article gives you the structure, and the video walks you through how everything fits together inside the Substack and web app.
One of the most common questions I receive from newer traders is simple: where should I start?
That is a fair question because momentum trading can feel overwhelming in the beginning. Traders hear about CANSLIM, IBD-style growth investing, relative strength, earnings growth, sales growth, volume, market breadth, moving averages, bases, breakouts, pullbacks, position sizing, stop placement, and trade management. Each concept matters, but when those ideas are learned in random fragments, it can be difficult to understand how they all fit together.
That is the purpose of this post and the video attached to it. I want to give you a clear roadmap for how Momentum Trading Strategy is organized, where I would begin if I were new, and how the course, weekly market research, web app, stock screener, watchlists, risk tools, and trade journal are all designed to work together.
This is not meant to be another place where traders simply chase stock ideas. There is already plenty of that on social media, in newsletters, and across trading platforms. The problem is that a stock idea by itself does not teach you how to trade. It does not tell you whether the market environment is favorable, whether the stock is truly a leader, where the trade is invalidated, how much capital to risk, when to take profits, or how to review the trade after it is closed.
A stock idea is not a trading process.
The goal of Momentum Trading Strategy is to help traders build the process behind the idea. That means learning how to evaluate the overall market, identify areas of relative strength, find leading stocks, study proper setups, manage risk, plan trades, execute with discipline, and review performance over time. The process starts with the big picture and slowly zooms in until we are looking at an individual stock, an individual setup, and an individual trade decision.
Want to Go Deeper?
The Momentum Trading Strategy Course is included with membership.
Inside the course, I walk through the complete framework behind growth stock and momentum trading, including market timing, stock selection, entries, exits, risk management, position sizing, trade review, and building a repeatable process.
The essays give you pieces of the puzzle. The course gives you the complete foundation for applying a full trading and investing process.
The First Place to Start Is the Course
If you are brand new to this style of trading, the best place to begin is the Momentum Trading Strategy Course. The course was created because I kept receiving many of the same questions from traders who were trying to learn growth stock trading, momentum trading, CANSLIM, relative strength, and swing trading. Individual articles can be helpful, but they do not always give a newer trader the full framework in the right order.
The course is designed to provide that foundation. It starts with where this style of trading comes from and why so many successful growth and momentum traders have used similar principles over the last century. The framework is influenced by traders such as Jesse Livermore, William O’Neil, Mark Minervini, David Ryan, Dan Zanger, Kristjan Kullamägi, and others who focused on leadership, price strength, earnings growth, institutional demand, market direction, proper entries, and disciplined risk management.
The point is not that every trader has to trade exactly the same way. The point is that many of the best growth stock traders have followed a similar sequence. They start with the market, then locate leadership, then identify the strongest stocks, then wait for proper setups, then manage risk carefully. The tactics may vary from trader to trader, but the basic logic is remarkably consistent.
The course walks through that logic in an organized way. It begins with the foundation of momentum trading, then moves into the market environment, top-down analysis, leadership, stock selection, entries, trade management, sell rules, and risk management. The goal is to help traders stop learning in disconnected pieces and start seeing the full structure.
The Process Starts With the Market
Before focusing on individual stocks, a trader needs to understand the market environment. This is one of the most important lessons from William O’Neil’s work. The “M” in CANSLIM stands for market direction, and it matters because many stocks follow the general market, especially during corrections, bear markets, and powerful uptrends.
This is why I write the Big Picture Market Pulse each weekend. The purpose of that report is to zoom out and evaluate the overall health of the market. I am looking at the major indexes, the trend, key moving averages, market breadth, leadership, risk appetite, relative strength, and other evidence that helps determine whether the environment is supportive or unfavorable for growth stocks.
For newer traders, the goal is not to master every market metric immediately. In the beginning, it may be enough to focus on whether the major indexes are above or below key moving averages, whether breadth is improving or deteriorating, whether leading stocks are acting well, and whether the market is rewarding breakout attempts. Over time, the process can become more advanced, but the starting point is simple.
You want to know what type of market you are trading in before you start looking for stocks to buy. A great-looking setup in a weak market may fail quickly. A constructive setup in a healthy market with improving breadth and expanding leadership has a much better chance of working. Market context does not guarantee success, but it helps keep you on the right side of the odds.
Then We Look for Relative Strength
Once we understand the general market environment, the next question is where strength is concentrated. This is where the Relative Strength Dashboard becomes useful. The dashboard is designed to help identify leadership across different parts of the market, including indexes, sectors, subsectors, industry groups, commodities, global markets, currencies, and other major areas.
This matters because momentum traders are not trying to randomly search through thousands of stocks. We are trying to find where money is flowing. If semiconductors are leading, that matters. If software is improving, that matters. If defensive sectors are outperforming while growth stocks are lagging, that also tells us something important about the market environment.
Relative strength helps narrow the search. Instead of guessing where to look, we can begin with the strongest areas of the market and then search for the strongest stocks within those areas. This is one of the most important parts of a top-down trading process.
The sequence is important. First, we study the market. Then we study where leadership is developing. Then we begin looking for individual stocks. study the market. Then we study where leadership is developing. Then we begin looking for individual stocks. That progression keeps the process organized and prevents us from randomly chasing whatever stock happens to be moving on a given day.
The Stock Screener Helps Identify Leadership
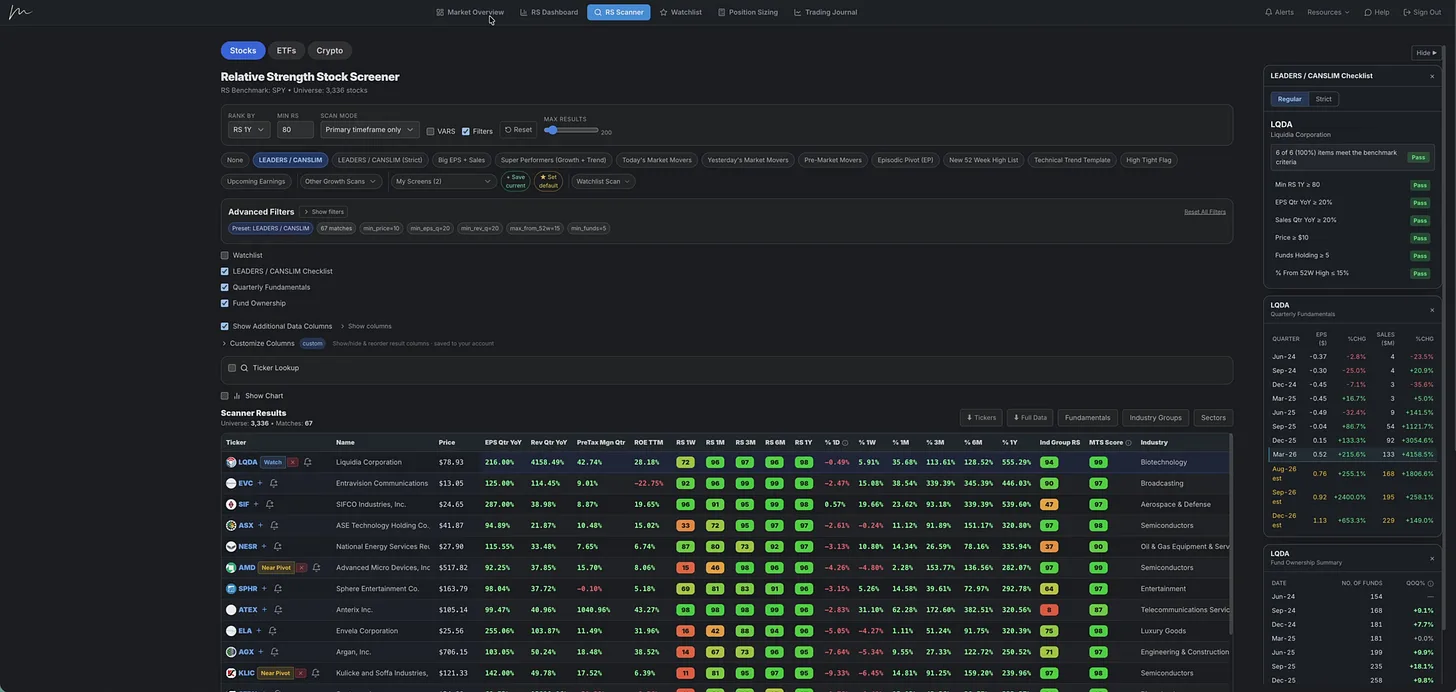
After we understand the market environment and where strength is located, the next step is individual stock selection. This is where the Relative Strength Stock Screener comes in. The screener is designed to help traders identify stocks showing leadership characteristics based on relative strength, price action, volume, liquidity, technical conditions, and fundamentals.
A traditional CANSLIM-style trader may want to focus on stocks with strong earnings growth, strong sales growth, high relative strength, institutional sponsorship, and constructive price action near proper pivot points. A more technical swing trader may care less about fundamentals and focus more heavily on price strength, volume, liquidity, distance from highs, volatility contraction, and whether the stock is setting up in a clean technical pattern.
The goal of the screener is not to replace chart work. The goal is to narrow the universe. Instead of manually searching through thousands of stocks with no structure, the trader can begin with a filtered list of names that already show some of the characteristics associated with leadership. From there, the work becomes more focused.
Once a stock appears on the screen, it still needs to be reviewed. The chart matters. The setup matters. The entry matters. The stop matters. The stock’s behavior compared to the market and its peers matters. The screener helps find candidates, but the trader still has to do the work.
Strong Stocks Still Need to Be Organized
Not every strong stock is actionable immediately. Some stocks are extended. Some are pulling back. Some are building bases. Some are approaching pivot points. Some are showing strength but need more time before they offer a proper entry.
This is why watchlist organization is important. Inside the platform, stocks can be categorized into groups such as Watch, Near Pivot, and Actionable. The purpose is to create a pipeline of ideas instead of forcing the trader to make emotional decisions in real time.
A stock in the Watch category may be strong, but not ready. A stock in the Near Pivot category may be approaching an important area. A stock in the Actionable category may be close to a proper entry or already triggering based on the trader’s plan.
This type of organization helps traders prepare in advance. The goal is not to wake up each morning and chase whatever is moving. The goal is to know what you are watching, why you are watching it, what would make it actionable, and where the trade would be invalidated if it fails.
Risk Management Comes Before Execution
Finding a strong stock is only part of the process. A strong stock can still become a poor trade if the risk is not managed properly. This is where many newer traders make one of their biggest mistakes. They find a stock they like, enter the trade, and only afterward start thinking seriously about where the stop should be and how much money they are actually risking.
A stop should not be random. It should not be placed at 5%, 7%, or 10% simply because that is the number a trader always uses. The stop should be based on the structure of the chart. If a stock is breaking out of a base, pulling back to a key moving average, forming a higher low, or tightening near a pivot, the stop should usually be placed where the trade idea would be invalidated.
That might be below a higher low. It might be below the low of a base. It might be below a key moving average. It might be below another clear support area. The important point is that the stop should be based on the chart first.
Once the stop is defined, position sizing becomes much clearer. The trader can decide how much of the account to risk on the trade, such as 0.5%, 1%, 2%, or another amount depending on experience, conviction, and market conditions. The position sizing tool then helps calculate the proper share size and total exposure.
This is a critical distinction. You do not force the chart to fit your preferred risk amount. You define the risk from the chart, then adjust the position size so the trade fits your account.
Planning the Trade Helps Reduce Emotional Decision Making
Before entering a trade, a trader should know exactly why the trade is being taken. The setup should be clear. The entry should be clear. The stop should be clear. The trigger should be clear. The trader should also have a general idea of how the trade will be managed if it works, and what will be done if it fails.
This is why the Performance Tracker includes a trade planning section. The purpose is to make the trade intentional before capital is at risk. A trader can write down the setup, the sector, the timeframe, the reason for the trade, the planned entry, the initial stop, the trigger, key support and resistance levels, volume characteristics, position size, and possible trade management tactics.
A good plan does not guarantee a winning trade. Nothing does. However, a plan reduces emotional decision making. It gives the trader something to measure against after the trade is closed. If the trade works, the trader can study what went right. If the trade fails, the trader can determine whether the loss was part of the process or the result of a mistake.
That distinction matters. Losses are part of trading. Repeated process mistakes are what need to be corrected.
The Journal and Analytics Close the Feedback Loop
After a trade is closed, the work is not finished. The trade should be reviewed. Did you follow your plan? Did you enter correctly? Did you chase? Did you size the position properly? Did you honor your stop? Did you sell too early? Did you hold too long? Did the stock act the way you expected? What can be learned from the trade?
This is where the journal and analytics become valuable. Traders should know their numbers. They should understand their win rate, average gain, average loss, expectancy, drawdown, profit factor, gain-to-pain ratio, average hold time, best setups, worst mistakes, and distribution of winners and losers.
A trader may think one setup is their best setup, but the data may tell a different story. Maybe pullbacks to the 50-day moving average perform best. Maybe flat base breakouts produce the cleanest trades. Maybe episodic pivots generate the largest winners. Maybe late entries or extended breakouts are responsible for most of the losses.
Without tracking the data, it is difficult to know what is actually happening. A business tracks key performance indicators because it needs to know what is working and what is not working. Trading should be treated the same way. The journal helps the trader move from opinion to evidence.
The Community Is Most Valuable After the Foundation Is Built
There is also value in the community side of trading, but only when it is used correctly. Sharing ideas can be helpful. Some of the best stocks a trader finds may come from another serious trader mentioning a name that was not already on their radar.
However, there is a major difference between hearing about an idea and blindly following a tip. An idea should go on your radar. Then you still need to do your own work. Does the stock fit your setup? Does it fit your timeframe? Is the market environment supportive? Is the stock in a leading area? Is the chart constructive? Is the risk manageable? Is there a clear entry and stop?
That is how shared ideas should be used. The goal is not to depend on someone else’s trades. The goal is to build enough knowledge and confidence that shared ideas become another source of research, not a replacement for your own process.
This is why I wanted to build the course, the tools, and the process first. Once traders have the foundation, the chat, shared ideas, scans, charts, and discussions become much more useful. Without that foundation, stock ideas can become dangerous because the trader may not know what to do after hearing the ticker.
The Complete Momentum Trading Strategy Roadmap
The full process is designed to move in a logical order.
- Start with the Momentum Trading Strategy Course to build the foundation.
- Study the Big Picture Market Pulse to understand the overall market environment.
- Use the Market Overview Dashboard to evaluate trend, breadth, risk appetite, and market health.
- Use the Relative Strength Dashboard to identify where leadership is concentrated.
- Use the Relative Strength Stock Screener to find individual stocks showing leadership characteristics.
- Organize the best ideas into a watchlist.
- Define the trade setup, entry, stop, and risk.
- Use the position sizing tools to make sure the trade fits your account.
- Plan the trade before entering.
- Journal the trade after it is closed and review the data to improve.
That is the roadmap. The process begins with the market and ends with self-review. It moves from broad market conditions to relative strength, from relative strength to stock selection, from stock selection to trade planning, and from trade planning to execution and review.
Final Thoughts
If you are new here, do not try to master everything at once. Start with the course. Learn the foundation. Understand why market direction matters. Study relative strength. Learn how to identify leadership. Build watchlists. Practice planning trades. Focus on risk management. Track your results.
Over time, the pieces begin to connect. The goal is not to memorize a few patterns or chase stock ideas. The goal is to build a complete trading process that can be repeated, measured, reviewed, and improved.
That is what Momentum Trading Strategy is designed to help traders do.
Start here, then keep building.
More in Software & Tools
All Software & Tools articles →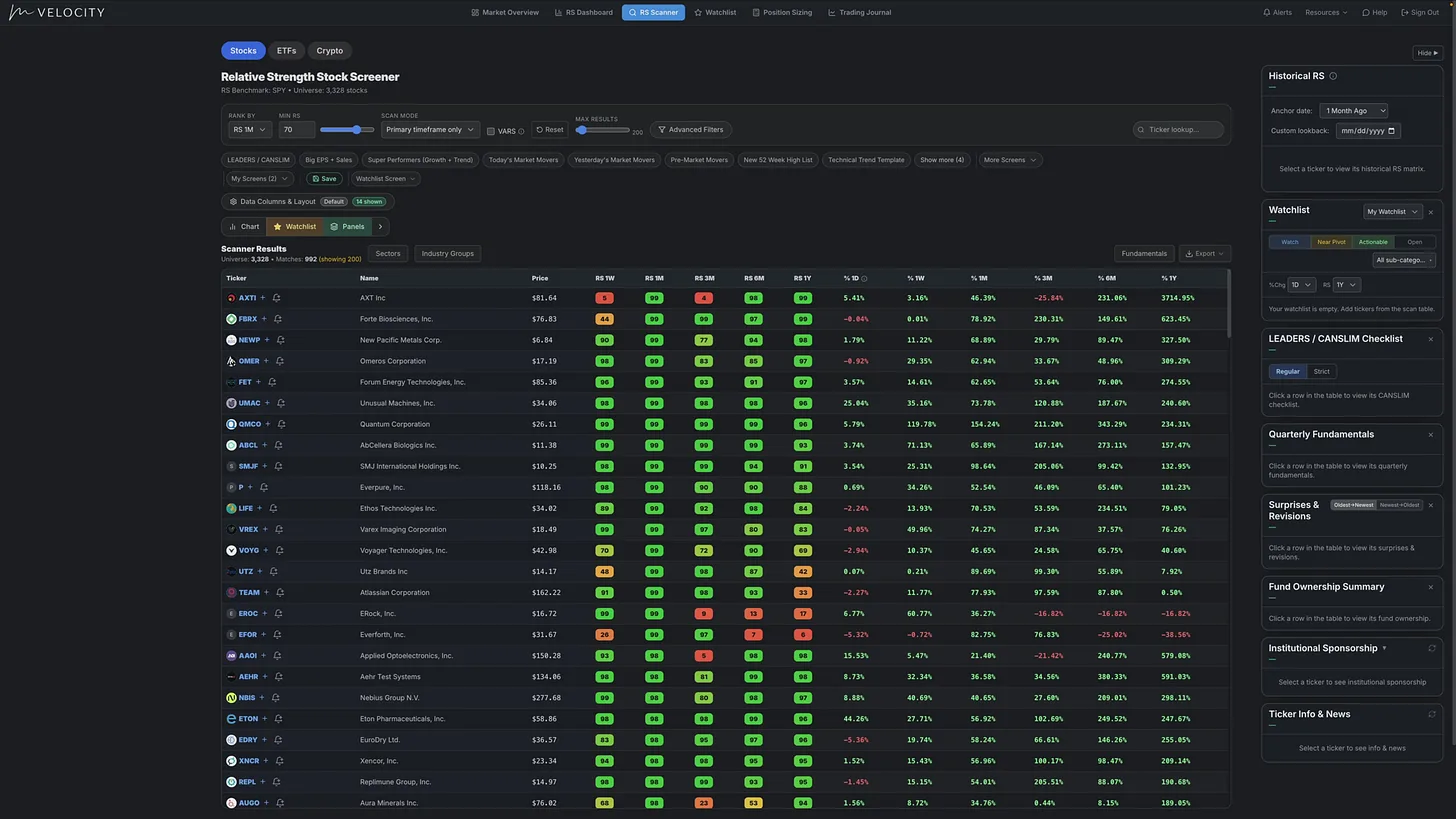
Aug 15, 2026 · Software & Tools
MTS Velocity: How I Find the Market’s Strongest Stocks | Complete Software Tutorial
See how I use Relative Strength, stock screens, charts, watchlists, risk tools, trade planning, journaling, and analytics to find and manage leading stocks.
- Momentum Trading
- CANSLIM
- Growth Stock Trading
- Stock Market
- growth stock investing
- Relative Strength Stock Screener
- Momentum Trading Strategy
- Find Stocks
Jul 3, 2026 · Software & Tools
Inside the Momentum Trading Strategy Software: A Full Trading Process in One Platform
See how the platform helps traders read the market, find relative strength, manage risk, and review performance from start to finish.
- Momentum Trading
- CANSLIM
- Trading Journal
- position trading
- Growth Stock Trading
- Stock Scanner
- Relative Strength Stock Screener
- Momentum Trading Strategy
Jun 11, 2026 · Software & Tools
Big Updates Just Dropped Inside the Momentum Trading Strategy Web App
The Relative Strength Stock Screener has come a long way in just a few months.
- find growth stocks
- Investing
- CANSLIM
- Trading
- position trading
- Growth Stock Trading
- Growth Investing
- Scanning for stocks