
Trading articles/The CANSLIM Growth Stock Playbook Behind America’s Biggest Winners
May 10, 2026 · Momentum Trading Strategy
The CANSLIM Growth Stock Playbook Behind America’s Biggest Winners
How William O’Neil turned more than a century of market history into one of the most influential frameworks for finding true growth stock leaders before they become obvious.
Originally published on Substack.
William J. O’Neil’s How to Make Money in Stocks is not just another trading book. For many growth stock investors and momentum traders, it is one of the foundational texts. His CANSLIM framework has influenced generations of market participants because it gave serious investors a structured way to answer one of the hardest questions in the market: how do you find true leaders before they become obvious?
There are thousands of stocks in the market. There are endless opinions, headlines, analyst upgrades, valuation arguments, economic forecasts, and social media narratives competing for attention. Every day, someone is convinced they have found the next great opportunity. Every day, someone else is convinced the same stock is too risky, too expensive, too obvious, or too late.
And if you have spent any time in the market, you already know this is true.
- You have seen stocks with great stories fail.
- You have seen “cheap” stocks keep getting cheaper.
- You have seen expensive-looking leaders continue higher.
- You have seen stocks break out, fail, recover, and then become major winners.
- You have seen the market reward strength when most people were waiting for a pullback.
So the real question is not whether there are opportunities in the market. There always are. The real question is whether you have a repeatable way to separate true market leaders from average stocks before the biggest part of the move has already happened.
That is the problem William J. O’Neil tried to solve.
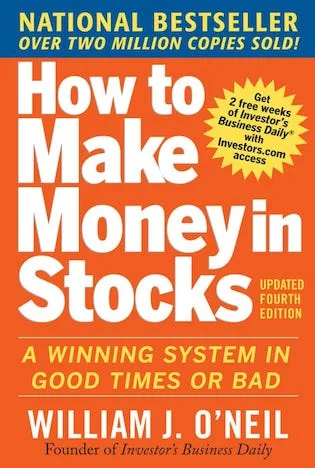
O’Neil, founder of Investor’s Business Daily and author of How to Make Money in Stocks, did not build the CANSLIM strategy from theory. He built it by studying market history. He examined more than 1,000 of the greatest stock market winners going back over 100 years, looking for the common traits those companies shared before they made their biggest advances.
That distinction matters.
Most investors start with opinions. They ask whether a stock feels cheap, whether the story sounds exciting, whether the market should go up, whether the company seems like a good long-term idea, or whether a recent pullback has created a bargain.
O’Neil started somewhere different. He asked what the biggest winners actually looked like before they became the biggest winners.
That one question changed growth stock investing.
A System Built From Winners, Not Opinions
The strength of CANSLIM is that it is not built around predictions. It is built around evidence. O’Neil studied the stocks that already produced exceptional advances and then reverse engineered the characteristics they had before those advances occurred.
He found that the greatest winners often shared several traits at their early developing stages. They showed strong current earnings growth, strong annual earnings growth, something new driving demand, favorable supply and demand, leadership, institutional sponsorship, and alignment with the general market.
That became the foundation of CAN SLIM.
Even if a trader does not use the system exactly, many of its principles show up across modern growth, momentum, swing, and position trading strategies. Buy strength. Focus on leaders. Look for earnings acceleration. Watch institutional demand. Study price and volume. Respect the general market. Cut losses quickly. Let winners work.
Those ideas have become part of the language of serious growth stock investing.
Whether you later study traders such as Mark Minervini, David Ryan, Dan Zanger, Kristjan Kullamägi, Stockbee, or other modern momentum practitioners, you will repeatedly see the same core ideas: leadership, relative strength, sound bases, institutional demand, risk control, and the willingness to buy strength when the evidence supports it.
That is one reason O’Neil’s work still matters. CANSLIM is not just an acronym. It is a decision-making framework built around how the market’s greatest winners have historically behaved.
The Historical Foundation
O’Neil’s process was rooted in a simple but powerful idea: study the winners.
In How to Make Money in Stocks, he explains that the first step in learning how to pick big stock market winners is to examine past leaders and study the characteristics they displayed before their major price advances. This included quarterly earnings, trading volume, relative strength, shares outstanding, new products, new management, and industry group strength.
That is a very different mindset from the average investor.
The average investor often asks, “What do I think this stock is worth?”
The CANSLIM investor asks, “Does this stock look like the kind of company that has historically produced exceptional market performance?”
That shift is important. It moves the investor away from opinion and toward pattern recognition. It also creates a structure for decision-making. Instead of chasing stories, buying weakness, or relying on predictions, the investor is forced to evaluate whether the stock meets a series of historically tested characteristics.
O’Neil was also influenced by earlier market operators and successful investors. One of the most important was Jack Dreyfus. O’Neil studied the stocks purchased by the Dreyfus Fund and noticed something that ran directly against conventional thinking. Dreyfus was not buying stocks because they looked cheap. He was buying stocks as they moved into new high ground from sound chart patterns.
That observation became one of the essential ideas behind O’Neil’s work.
The best stocks often do not begin their biggest moves by looking cheap. They begin by acting strong.
O’Neil also studied Jesse Livermore. From Livermore, he absorbed a lesson that every trader eventually has to learn: the objective is not to be right on every trade. The objective is to make meaningful money when you are right.
That is the heart of professional speculation. It is not about predicting every move. It is about finding situations where the odds are favorable, managing risk when they are not, and pressing your advantage when the market proves you right.
What CANSLIM Actually Means
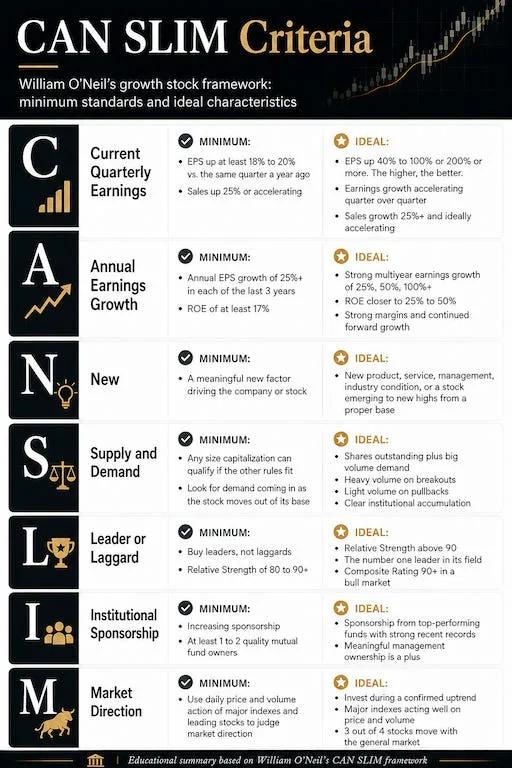
CANSLIM is based on seven key characteristics O’Neil found in many of the greatest stock market winners before their biggest advances. The original formula is written as CAN SLIM, with each letter representing one critical factor.
The power of the system is not in any single letter. The power comes from combining the letters into one complete process. Fundamentals tell you whether the company is strong. Price and volume tell you whether demand is present. Relative strength tells you whether the stock is outperforming. Institutional sponsorship tells you whether large investors are involved. Market direction tells you whether the environment is favorable.
That combination is what makes CANSLIM so useful.
C: Current Quarterly Earnings
The “C” stands for current quarterly earnings per share. O’Neil wanted to see companies with major increases in current quarterly earnings compared with the same quarter in the prior year.
The minimum standard is important. In his CAN SLIM summary, O’Neil wrote that quarterly earnings per share should be up at least 18% to 20% versus the same quarter a year earlier. He also noted that quarterly sales should be accelerating or up 25% or more.
But the minimum is not the preferred.
During strong bull markets, O’Neil preferred companies showing much more powerful earnings growth. The best companies might show quarterly earnings up 40%, 100%, 200%, or more. The higher, the better.
This is one of the first major lessons of CAN SLIM. A true market leader usually has more than an interesting story. It has numbers that confirm and sustain the story.
O’Neil also emphasized acceleration. It is not enough for earnings to simply be positive. The investor should look for earnings growth that is improving compared with prior quarters. A company that was growing earnings 20%, then 40%, then 80% is showing a different profile than a company that was growing 80%, then 40%, then 20%.
Sales matter too. O’Neil wanted strong earnings growth to be supported by quarterly sales growth of 25% or more, or by clear acceleration in the rate of sales growth over recent quarters. This matters because earnings can sometimes be temporarily boosted by cost cuts, accounting factors, or one-time items. Sustainable growth is stronger when sales and earnings are both improving.
The minimum for “C” is quarterly earnings up at least 18% to 20%. The preferred profile is quarterly earnings up 40% to 100%, 200%, or more, with earnings accelerating at some point in recent quarters and quarterly sales either accelerating or up at least 25%.
A: Annual Earnings Growth
The “A” stands for annual earnings increases.
One strong quarter is not enough. A company can report a good quarter because of a temporary industry rebound, easy comparisons, cost cuts, or nonrecurring factors. O’Neil wanted more proof. He wanted to see a record of annual earnings growth over multiple years.
His minimum standard was significant annual earnings growth, generally 25% or more, in each of the last three years. He also looked for return on equity of 17% or more, with 25% to 50% preferred. If return on equity was too low, O’Neil wanted to see strong pretax profit margins.
The annual growth requirement helps separate true growth companies from one-quarter wonders. The strongest stocks often have both current acceleration and a longer-term record of success. They are not just improving for one quarter. They have already demonstrated that the business can grow.
O’Neil also noted that the median annual growth rate of the outstanding stocks in his study, at their early emerging stage, was 36%. That is an important number because it shows that the greatest winners were often growing far faster than the average company.
The minimum for “A” is annual earnings growth of 25% or more over the last three years, with return on equity of at least 17%. The ideal is annual earnings growth of 25% or more, with strong margins, continued forward growth, and ROE or pretax margins that are excellent relative to the company’s industry. That industry context matters because some industries naturally operate with lower margins, while others have structurally higher margins, so the key is whether the company is superior compared with its direct peers.
N: New Products, New Management, New Highs
The “N” stands for something new.
This may be one of the most important parts of the entire CANSLIM framework. Many of history’s biggest winners had something new behind their advance. That could mean a new product, a new service, new management, a new industry condition, a new technology, or a new price high emerging from a sound chart base or pattern.
The reason is simple. Big stock moves usually come from change.
The market does not usually reward the same old company doing the same old thing at the same old rate of growth. It rewards companies where something material is improving. A new product can create a new earnings cycle. New management can change a company’s direction. A new industry condition can create a major tailwind. A new price high can signal that demand is overcoming supply.
This is also where O’Neil’s work runs directly against human nature. Most investors want to buy stocks when they look cheap. CANSLIM often pushes the investor toward stocks making new highs, but only when those new highs occur after a sound base and are supported by the rest of the CANSLIM criteria.
That last part matters. Buying a stock just because it is making a new high is not the strategy. The strategy is to buy a fundamentally strong leader as it emerges from a proper base into new high ground, ideally with strong volume confirming institutional demand.
The minimum for “N” is some meaningful new factor driving the company or the stock. The ideal is a powerful new product, service, management team, industry condition, or price breakout from a properly formed base that is supported by earnings, sales, leadership, and volume.
S: Supply and Demand
The “S” stands for supply and demand.
Every stock price is ultimately governed by supply and demand. If demand for shares overwhelms available supply, price rises. If supply overwhelms demand, price falls.
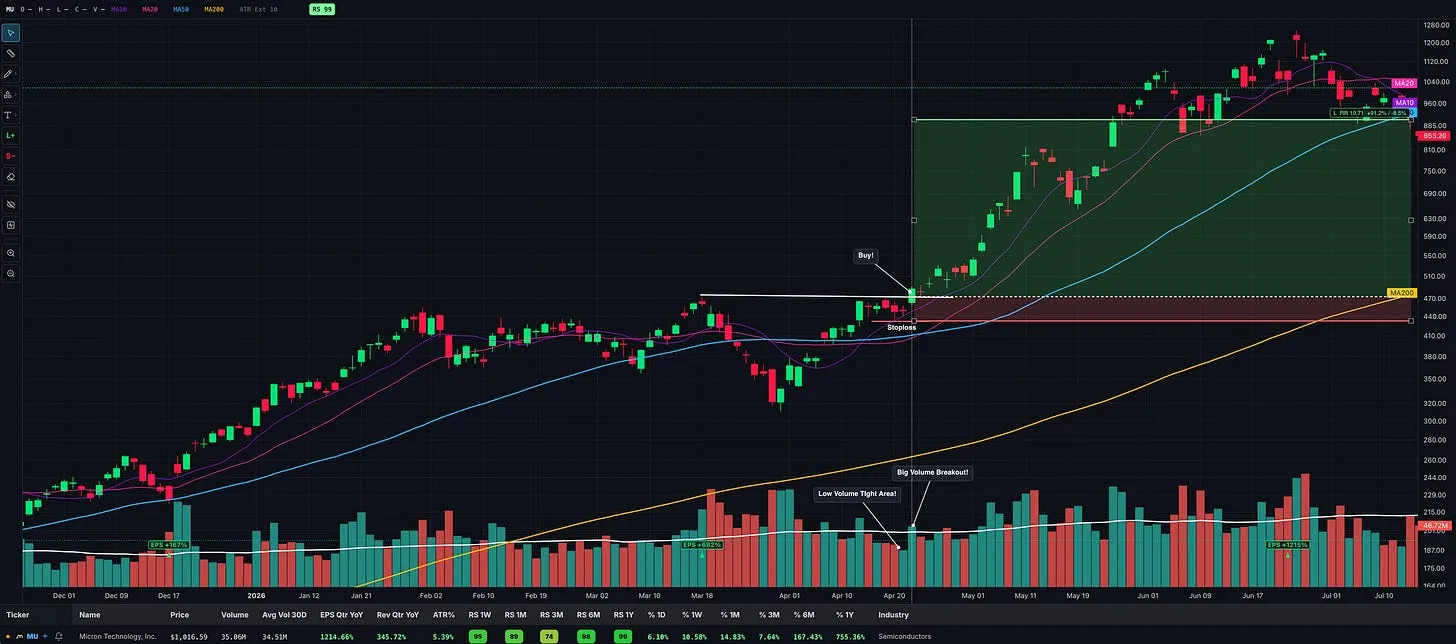
O’Neil looked at shares outstanding, float, trading volume, and volume behavior around key price areas. He wanted to see evidence that large buyers were accumulating shares. That evidence often appears on charts through heavy volume on advances and breakouts, and lighter volume during normal pullbacks.
In the CANSLIM framework, volume is not just a technical detail. It is the footprint of institutional activity.
A stock can have a great story, but if institutions are not buying it, the move may lack power. Large investors are the force that can push a stock significantly higher over time. That is why volume matters so much. It helps reveal whether serious demand is present.
O’Neil’s minimum standard for the “S” factor evolved with the market. He noted that any size capitalization could be acceptable as long as the company fit the other CANSLIM rules, but he still emphasized the importance of big volume increases when a stock begins to move out of its base.
The minimum for “S” is a stock that fits the other CANSLIM rules and shows demand coming in at key points. The ideal is a leader breaking out of a sound base on a major increase in volume, showing that institutional demand is overwhelming available supply.
L: Leader or Laggard
The “L” stands for leader or laggard.
O’Neil was clear: buy leaders, not laggards.
This is one of the hardest lessons for most investors because human nature wants a bargain. People are naturally attracted to stocks that are down, beaten up, or “due” for a rebound. They assume the stock that has already fallen is safer because it looks cheaper.
CANSLIM flips that thinking upside down.
The strongest stocks are often the ones already outperforming. They are the stocks near new highs while weaker names are still struggling. They are the stocks leading their industry group rather than following it. They are the companies with superior earnings, superior sales, superior relative strength, and superior price action.
O’Neil used Relative Price Strength Ratings to separate leaders from laggards. Most leaders had Relative Price Strength Ratings of 80 to 90 or higher, and in bull markets, composite ratings of 90 or more were preferred.
This is one of the core principles behind momentum investing. Strength is not something to automatically fear. In the right context, strength is information. It tells you where demand is concentrated.
The minimum for “L” is a stock showing clear leadership, usually with a Relative Price Strength Rating of 80 to 90 or higher. The ideal is the number one company in its field, with superior earnings growth, strong price action, a Relative Price Strength Rating above 90, and a composite rating of 90 or more during a bull market.
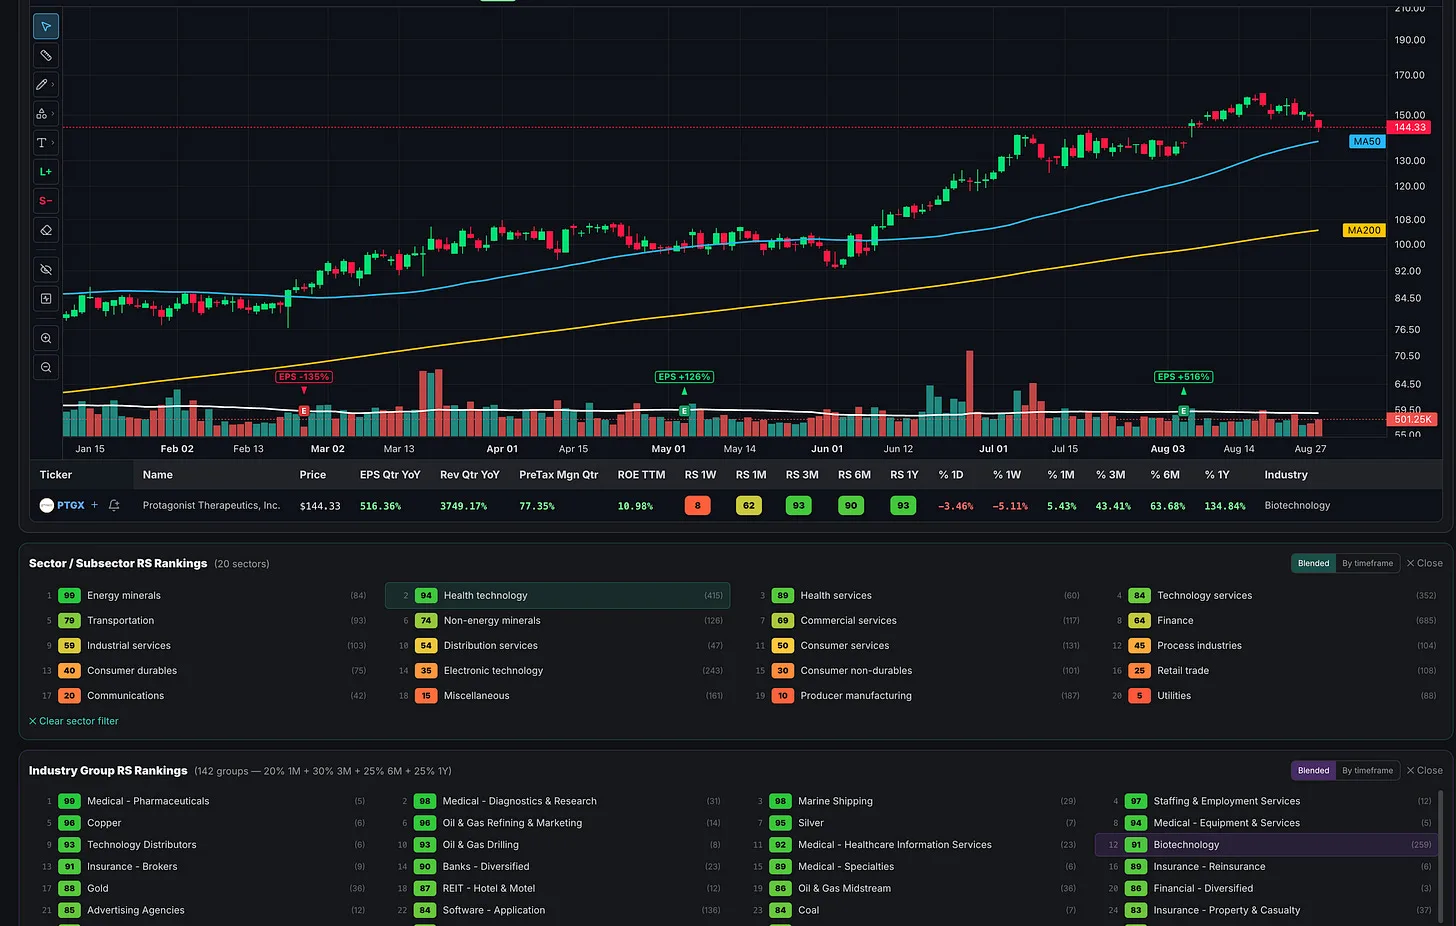
This is also why I built the Relative Strength Stock Screener. In my experience, relative strength is one of the most important signals in growth and momentum trading because it shows where money is actually flowing. Even traders who branch away from O’Neil’s full fundamental framework often keep this principle at the center of their process. Whether it is Mark Minervini-style swing trading, shorter-term high-momentum trading like Kristjan Kullamägi, or other modern momentum approaches, relative strength helps identify the names that are leading before they become obvious to everyone else.
I: Institutional Sponsorship
The “I” stands for institutional sponsorship.
Institutions provide the buying power behind many of the market’s biggest winners. Mutual funds, pension funds, hedge funds, banks, and other large investors have the ability to accumulate shares over time and drive major advances.
O’Neil wanted to see increasing sponsorship from quality institutions. He preferred stocks that had at least one or two mutual fund owners with strong recent performance records. He also liked to see management ownership because it aligns insiders with shareholders.
This factor is about confirmation.
If a company is truly developing into a major leader, institutions will often begin to notice. Their buying may show up in ownership data, but it also often appears on the chart through volume. Repeated heavy-volume up days, strong breakouts, and support during pullbacks can all suggest institutional demand.
The minimum for “I” is at least some quality institutional sponsorship. The ideal is increasing sponsorship from strong-performing funds, combined with meaningful management ownership and price-volume action that confirms accumulation. In practice, this is one of the reasons fund ownership data can be so useful.
Inside my Relative Strength Stock Screener, I track institutional ownership trends and look for funds increasing quarter over quarter. Rising fund ownership can help confirm that larger investors are beginning to support the stock’s advance.
M: Market Direction
The “M” stands for market direction.
This may be the most important letter in the entire system. You can find a company with excellent earnings, strong sales, a new product, institutional sponsorship, and a great-looking chart, but if the general market is in a major correction or bear market, your odds decline dramatically.
O’Neil emphasized that investors must learn to determine the overall market direction by interpreting the daily price and volume action of the major indexes and the action of individual market leaders.
This is what makes CANSLIM different from many stock-picking methods. It is not just about finding good companies. It is about finding good companies when the market environment is favorable.
A confirmed uptrend gives growth investors a better chance of success. A market under distribution, with major indexes showing repeated institutional selling, creates a different risk profile. The same setup that works in a healthy market can fail quickly in a weak one.
This is why CANSLIM investors pay attention to index action, follow-through days, distribution days, market new highs, and broad market participation. The goal is not to predict what the market should do. The goal is to observe what the market is actually doing.
The minimum for “M” is a market environment that is not working directly against the investor. The ideal is a confirmed uptrend where major indexes are acting well, leading stocks are breaking out, institutional accumulation is visible, and market breadth supports the advance.
Why CANSLIM Still Works
CANSLIM remains relevant because the forces behind it have not disappeared.
Technology changes. Market structure changes. Information travels faster. Trading platforms improve. Social media creates new waves of attention, but the core forces behind major stock moves remain remarkably consistent: earnings growth, sales growth, innovation, supply and demand, institutional accumulation, leadership, crowd psychology, and general market direction.
Human nature also remains the same.
Investors still want to buy stocks that look cheap. They still sell winners too early. They still hold losers too long. They still listen to opinions instead of studying price and volume. They still ignore the general market when they are excited about an individual stock. They still confuse a good company with a good stock.
CANSLIM gives investors a structure to fight those mistakes.
It forces the investor to ask better questions. Is the company growing earnings fast enough? Are sales confirming the earnings growth? Is there something new driving the story? Is the stock under accumulation? Is it a leader or a laggard? Are institutions involved? Is the general market healthy?
That is the real value of the system. It turns stock selection into a process.
A Complete Growth Stock Framework
The best part of CANSLIM is that it does not rely on one variable.
It is not only a fundamental strategy. It is not only a technical strategy. It is not only a momentum strategy. It is not only a market timing strategy. It combines all of them into one framework.
Fundamentals tell you whether the business is strong. Price and volume tell you whether demand is present. Relative strength tells you whether the stock is outperforming. Institutional sponsorship tells you whether large investors are involved. Chart patterns help identify more favorable entry points to manage risk. Market direction tells you whether the environment supports taking risk. Sell rules protect capital when the trade is wrong.
That combination is what separates CANSLIM from simple stock picking.
It is not just asking, “Is this a good company?”
It is asking, “Is this a great company, with great numbers, acting like a leader, under accumulation, emerging from a proper setup, in a market that supports growth stocks?”
Those are much better questions to ask.
The Risk Management Lesson
One of the most important parts of O’Neil’s system is not just what to buy. It is what to do when you are wrong.
O’Neil repeatedly emphasized cutting losses quickly. His rule was to sell when a stock falls 7% to 8% below the purchase price. This rule is simple, but it is also one of the reasons the system has survived.
Most investors do the opposite. They take small profits quickly because they are afraid of losing them, but they allow small losses to become large losses because they do not want to admit they are wrong.
That behavior destroys performance.
CANSLIM forces the investor to accept that being wrong is part of the game. The goal is not to avoid every loss. The goal is to keep losses small enough that one mistake cannot seriously damage the portfolio.
This is also why buying correctly matters. O’Neil believed that if you buy a stock properly as it emerges from a sound base, it should not usually fall 7% or 8% below the correct buy point. If it does, that is important information. Either the stock is not acting right, the market is weakening, or the original decision may have been wrong.
The sell rule is not a punishment. It is protection.
The Biggest Lesson From O’Neil
The biggest lesson from O’Neil’s work is not simply to memorize the acronym.
The bigger lesson is to study winners.
Study what the greatest stocks looked like before their biggest moves. Study how they based. Study how they broke out. Study how earnings and sales behaved. Study how relative strength improved. Study how volume came in at key points. Study how the general market acted during the move.
That is exactly what O’Neil did.
He did not try to reinvent the market from theory. He reverse engineered success from history.
Every serious trader and investor should adopt that habit. Instead of asking what you think should happen, ask what has historically happened before the biggest winning stocks made their major advances.
That question leads to better inputs. Better inputs lead to better decisions. Better decisions lead to better risk management. Better risk management gives you a chance to survive long enough to capture the few exceptional winners that can make a major difference.
Final Thoughts
The CAN SLIM strategy remains one of the most influential growth stock investing systems ever developed because it gives investors a structured way to identify true market leaders.
It teaches you to look for companies with strong and accelerating quarterly earnings, powerful annual growth, something new driving demand, favorable supply and demand, leadership, institutional sponsorship, and alignment with the general market.
Even if you eventually build your own strategy, the principles remain valuable.
Buy strength, not weakness. Focus on leaders, not laggards. Look for acceleration, not deceleration. Follow institutional demand, not opinions. Respect the market, not your forecast. Study history, not hype. Cut losses quickly and let winners run.
That is why O’Neil’s work still matters.
The market’s biggest winners rarely come out of nowhere. They usually leave clues. CAN SLIM is one of the most enduring frameworks ever created for learning how to recognize them.
It is also no coincidence that since William J. O’Neil developed the CAN SLIM framework and wrote How to Make Money in Stocks, his work has become foundational for many growth stock investors and momentum traders who came after him. Many successful traders have gone on to build their own systems, with different time frames, tactics, risk models, and entry rules, but the influence of O’Neil’s work is still easy to see: leadership, relative strength, institutional demand, sound bases, earnings acceleration, and respect for the general market.
And this article only scratches the surface.
O’Neil’s book does far more than explain the seven letters of CAN SLIM. It includes more than 100 charts of some of the greatest winning stocks in market history, detailed lessons on how to read charts, deeper explanations of each CAN SLIM factor, warning signs that a market may be topping, guidance on when to get back in, rules for selling and taking profits, common mistakes investors make, portfolio management principles, and the importance of aligning with the best market themes, sectors, and industry groups.
It also teaches the time-tested chart patterns that have appeared again and again in major winners, including the cup with handle, flat base breakout, and high tight flag.
That is what makes How to Make Money in Stocks more than just a trading book. It is a complete study of how great stocks behave, how strong markets develop, how institutional demand reveals itself, and how disciplined investors can use history as a guide.
You do not have to follow CAN SLIM perfectly to benefit from it.
But if you are serious about growth stock investing or momentum trading, you should understand it. O’Neil gave investors a framework for studying winners before they became obvious. That framework still matters because the market still rewards many of the same traits it has rewarded for more than 100 years: growth, leadership, supply & demand, timing, and discipline.
Continue Studying the Playbook
This is one of the legendary books and frameworks that helped shape the way I think about growth stock investing and momentum trading.
That foundation is deeply ingrained in the Momentum Trading Strategy Course, where we study many of the same core concepts O’Neil taught, along with lessons from legendary traders and investors such as Jesse Livermore, Gerald Loeb, Nicolas Darvas, Mark Minervini, Dan Zanger, and many more.
Inside the course, we take these timeless principles and build on them with a modern framework for finding leading stocks, reading market conditions, managing risk, sizing positions, and developing a repeatable trading process.
More in Legendary Traders
All Legendary Traders articles →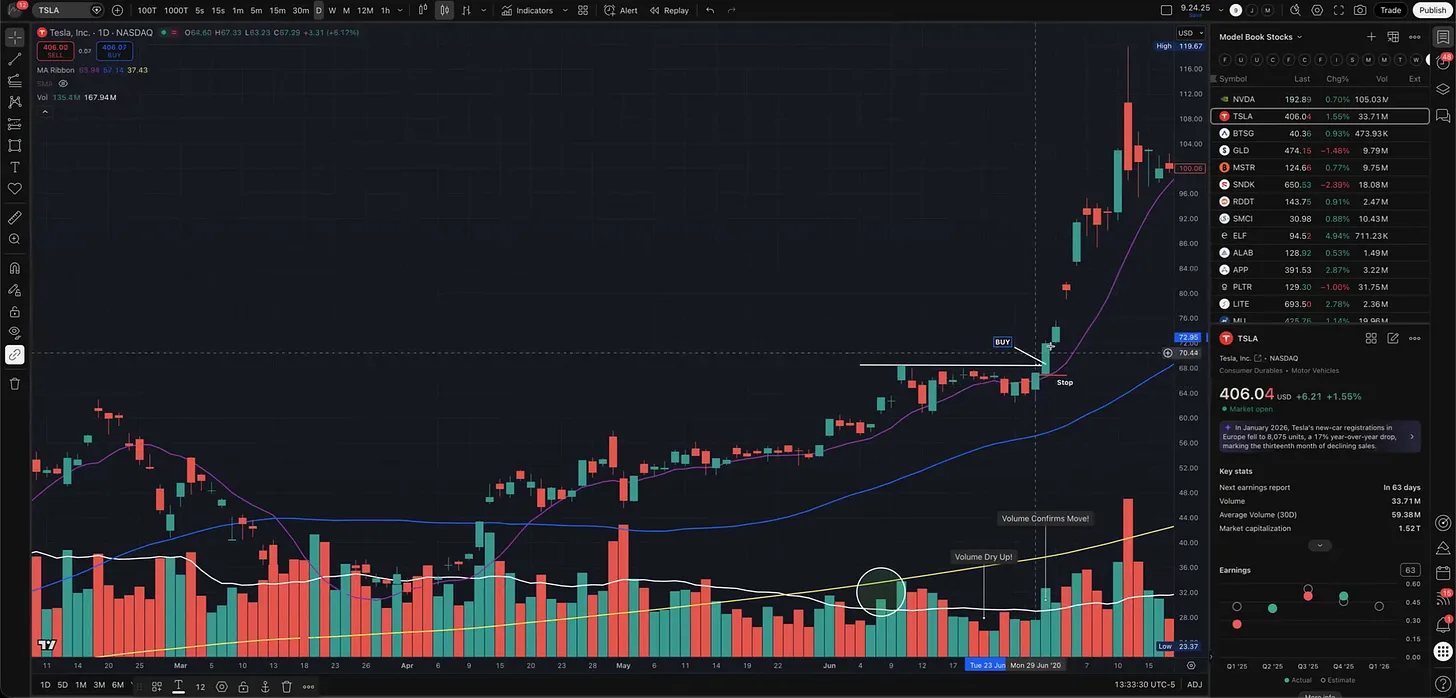
Sep 17, 2026 · Legendary Traders
4 Legendary Traders. 4 Breakout Entry Tactics.
A chart-by-chart breakdown of Minervini’s VCP, O’Neil’s cup with handle, Darvas’s box breakout, and Kullamägi’s opening range breakout.
- how to make money in stocks
- IBD
- Momentum Trading
- VCP
- technical analysis
- CANSLIM
- Trading Setups
- position trading
Sep 6, 2026 · Legendary Traders
Market Wizard David Ryan: How He Made 1,379% in Three Years
Inside the growth-stock approach of William O’Neil’s protégé and three-time U.S. Investing Champion, from precise entries to holding major winners.
- IBD
- fundamental analysis
- Learn Trading
- technical analysis
- position trading
- David Ryan
- Market Wizard
- CAN SLIM
Aug 29, 2026 · Legendary Traders
Why the Market’s Biggest Winning Stocks Rarely Move Alone
Lessons from Nicolas Darvas, William O’Neil, and Mark Minervini on using industry-group strength and relative strength to find new market leaders without getting whipsawed.
- growth stocks
- CANSLIM
- position trading
- David Ryan
- stock trading
- Kristjan Kullamägi
- Nicolas Darvas
- industry groups