Momentum Trading Strategy

Notes

Short lessons on momentum trading, every day.

Every note from Substack, in one place: risk, setups, leading stocks, market conditions and the mindset behind them. Search them, browse by topic, or filter by stock.

Showing 221–240 of 1222 notes

View on Substack ↗

95% of His Money Came From Stocks at New Highs

Dan Zanger was asked whether he ever bottom-fished.

His answer:

“All the biggest-moving stocks I’ve owned during the past 20 years, where I’ve made 95% of my money, were ones hitting new highs from very solid bases.”

A stock can be at an all-time high and still be near the beginning of a fresh advance. It may have spent months consolidating before finally breaking through resistance.

Yet traders see the new high and immediately think, “I missed it.”

Then they search for something that “hasn’t moved yet,” assuming a lower price means more opportunity.

If your first reaction to every new high is “too late,” you may be dismissing the exact opportunities that produced most of Zanger’s money.

View on Substack ↗

Nicolas Darvas: More Information Made Him a Worse Trader

In 1959, Darvas returned to New York after making over half a million dollars while trading abroad through cables.

He expected closer contact with the market to improve his results. Instead, he lost nearly $100,000 in a few weeks.

He watched the ticker, listened to rumors, absorbed other traders’ opinions, and abandoned his rules.

His conclusion:

“My ears were my enemy.”

He left for Paris and told his brokers to send only his usual daily telegram.

That was 1959. Today, the noise arrives through instant news, social media, and AI-generated analysis.

You can consume more information and become less capable of following your process. You can even use AI to hunt for a justification to ignore your own rules.

Before adding another opinion, ask whether it improves your decisions or simply increases your urge to trade.

Darvas had to leave New York to escape the noise. Today, we carry it in our pockets.

View on Substack ↗

Jesse Livermore: A Lower Average Can Become a Bigger Mistake

Jesse Livermore wrote in How to Trade in Stocks:

“Never average losses. Let that thought be written indelibly upon your mind.”

Then he explained the trap.

You buy 100 shares at $50. The stock falls to $47, so you buy another 100 shares to lower your average.

Your average cost improves to $48.50. But you now own twice as much of a stock moving against you.

If it falls to $44, the original shares lose $600. The additional shares lose another $300.

You “improved” your average and increased your loss to $900.

That is why averaging down can feel productive while making the situation worse. You focus on how little the stock needs to recover instead of how much more you stand to lose.

Livermore’s approach was to add as the trade moved in his favor. A losing first purchase was a reason to protect capital, not commit more.

You can always take a fresh entry if the setup returns.

View on Substack ↗

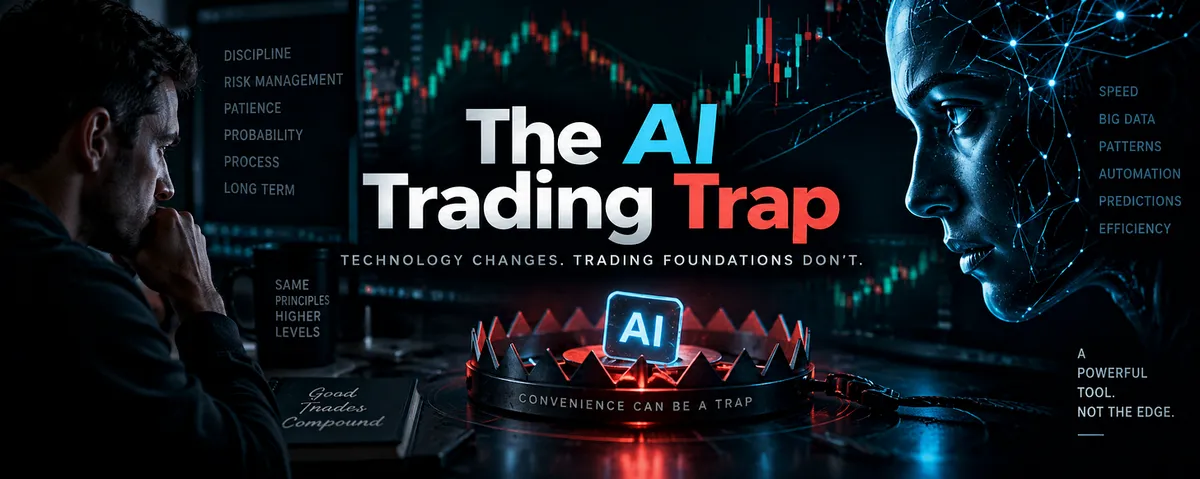
The AI Trading Trap

I’ve been getting a lot of messages about AI and how it’s going to change trading.

Of course technology will change trading. We already went from floor traders and phone calls to computers, algorithms, and instant access to information.

But supply and demand won’t change. Human emotion, new trends, innovation, and speculation will still exist and continue driving markets.

You do not need AI to become a successful trader.

The trap I see forming is traders who haven’t found consistency searching for AI to solve the problem for them.

It can become the same rabbit hole as indicator obsession: constantly chasing the next tool while avoiding the work that would actually improve their trading.

A better scanner won’t fix chasing extended stocks, oversizing positions, ignoring stops, or trading out of boredom.

It’s no different than systematic or algorithmic traders ruining a perfectly good system by constantly overriding it.

So the bottom line is this: your time is probably better spent becoming a better trader.

Then, when better technology arrives, you’ll actually know how to use it and profit from it.

And remember, experienced traders will have access to the same technology. They’ll likely understand how to use it, what questions to ask, and when the output is wrong better than the inexperienced trader.

With that said, I’m building some interesting things inside MTS Velocity, including pattern recognition and experimenting with AI agents that scan stocks, review charts, and analyze technical and fundamental data.

In my early testing, combining traditional screening with AI visually reviewing charts looks more promising than trying to hard-code every possible variation of a cup-and-handle, VCP, pullback, or other setup.

The goal is to guide that analysis using the trading books, model books, and methodology we actually use, then eventually bring it into the platform for paid members.

I’m excited about the potential.

But there’s something traders need to understand:

AI becomes more useful as your own knowledge increases.

You need to know what questions to ask, which variables matter, when the answer is wrong, and how the setup fits into the broader market environment.

An inexperienced trader may benefit from AI.

An experienced trader will probably benefit even more.

A solid fundamental and technical screen, followed by a trained eye and disciplined risk management, is already enough to find and trade great opportunities.

If AI makes that process faster and better, fantastic.

We’ll use it.

Until then, control what you can control.

Study charts. Refine your setups. Manage risk. Review your mistakes.

Use AI to amplify your trading skills. Don’t let the search for better technology become a substitute for developing them.

View on Substack ↗

The 604% Fund That Taught William O’Neil to Buy High

One of William O’Neil’s biggest breakthroughs came from studying someone else’s trades.

O’Neil describes researching three leading mutual funds in January 1960. The Dreyfus Fund stood out because its gains were twice those of many competitors. He wanted to understand exactly what Jack Dreyfus was doing.

So he ordered the fund’s quarterly reports and prospectuses from 1957 through 1959, calculated the average prices paid for new holdings, and marked those purchases on stock charts.

After examining more than 100 purchases, O’Neil discovered:

“every stock had been bought at the highest price it had sold for in the past year.”

Those stocks had formed recognizable chart patterns before breaking into new highs. That combination helped shape O’Neil’s early buying rules.

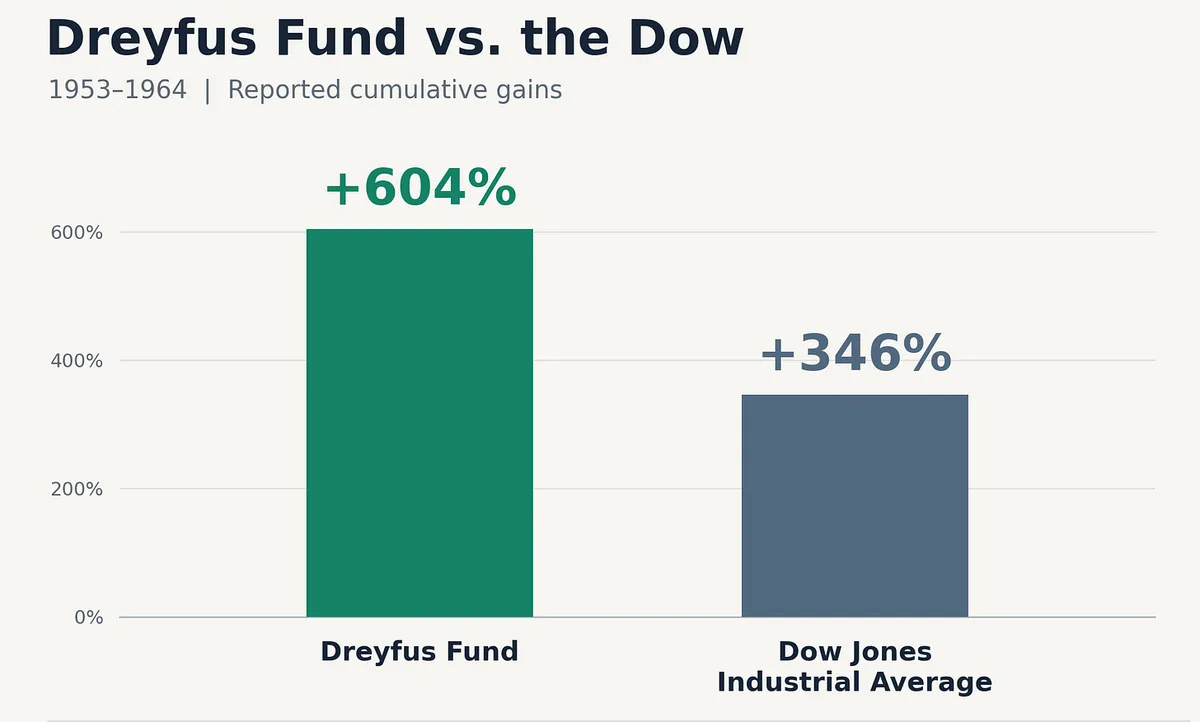
The results explain why he paid attention. From 1953 to 1964, the Dreyfus Fund reportedly returned 604%, compared with 346% for the Dow Jones Industrial Average. Historical reporting also puts its lead over the second-best fund at 102 percentage points.

And the research operation was remarkably simple. O’Neil describes three people recording daily price and volume for hundreds of stocks on oversized charts. He saw those charts himself when he visited Dreyfus’s New York headquarters. Strong quarterly earnings were another common feature of the stocks the fund bought.

Dreyfus also knew when to reduce exposure. He cut the fund’s stock holdings to less than half its assets in early 1957, ahead of the Dow’s roughly 20% decline from July to October. Buying strength went hand in hand with protecting capital.

This is one reason I keep encouraging traders to study the greats. O’Neil examined actual purchases, identified repeatable characteristics, and used that evidence to build his own rules.

Before you dismiss a stock as “too high,” remember what O’Neil found when he studied a fund that was beating the competition.

View on Substack ↗

“Too High to Buy” Is How You Miss the Biggest Winners

A stock falls 60%, and suddenly it looks like an opportunity. Another stock reaches a new high, and you think you missed it. That bargain-hunting instinct can become an expensive habit.

William O’Neil explained it in How to Make Money in Stocks:

“You buy stocks when they’re nearer to their highs for the year, not when they’ve sunk so low that they look cheap.”

A stock’s old price can anchor your expectations. You see $100 become $40 and imagine the money you’ll make when it “gets back.” But the market owes you absolutely nothing, including a return to that old high.

Meanwhile, a stock making new highs may be experiencing strong earnings + sales growth and institutional buying. The higher price can reflect a business getting stronger. Dismissing it because it has already gone up can mean overlooking exactly the strength O’Neil taught investors to study.

The entry still matters. His approach paired strong fundamentals with a breakout from a sound base, buying close to the proper buy point and cutting losses quickly when wrong.

How many big winners have you watched keep climbing while waiting for them to get “cheap”?

View on Substack ↗

Set Goals That Sound Insane

Set trading goals that sound completely insane to other people.

Most people underestimate what is possible because they underestimate themselves.

But belief alone is not enough.

I actually like the SMART goal-setting framework. Specific. Measurable. Achievable. Relevant. Time-bound.

But I have always had a problem with versions that tell you your goals need to be realistic.

Realistic according to who?

Most people who accomplish extraordinary things set goals that looked completely unrealistic to everyone around them when they started.

So make your goals specific. Make them measurable. Give yourself deadlines. Build a plan.

But do not let someone else's definition of realistic put a ceiling on what you are willing to pursue.

There are plenty of people with huge dreams who never get anywhere because their daily habits do not match their goals.

That is where the real difference is made.

Today there are more gurus, fraudsters, and fake success stories than ever. But once you filter through the noise and find people with legitimate results, something becomes obvious:

The blueprint already exists.

Trading is no different.

People have built extraordinary careers using the same technical and fundamental principles I preach. Why? Because they did not come from me.

Growth stock investing and momentum trading have been around for decades. I have shared the books to read. I have built affordable software that does many of the things much more expensive platforms do. I have built a course for people who learn better visually and through instruction.

The information is available.

The question is whether you are willing to do the work long enough to see the results.

Big goals are achieved through very small actions repeated over and over again.

Build a process and routine that fits your life, but it needs to include the things that actually move you forward:

  • Read. Study. Absorb. Repeat.

  • Read the great books more than once. I have read the same life-changing trading books over and over again.

But more importantly, put them into practice.

Do not just read about trading.

  • Review charts and stocks daily.

  • Master stock screening using the growth fundamentals and technical characteristics that actually matter.

  • Master how to build and manage watchlists, identify potential setups, and set alerts so you are prepared before a stock becomes actionable.

  • Improve your risk management and position sizing.

  • Improve your trade planning.

  • Conduct after-action reviews of your trades.

  • Keep a trading journal. Track both technical mistakes and emotional mistakes.

Continue learning. Continue studying great traders who have succeeded in the same discipline.

Then do it again tomorrow.

And the next day.

And the next month.

And the next year.

Most of the journey will be quiet.

Nobody is going to congratulate you for studying charts while everyone else is watching Netflix.

Nobody is going to applaud you for passing on a mediocre trade or sitting in cash because the market environment is poor.

Nobody is going to notice the hundreds or thousands of hours you spend improving before the results finally show up.

That is why the road can feel lonely.

That is also why you need to love the game of trading.

And stop comparing yourself to everyone else.

Your goal is not to become somebody else. Your goal is to become the best trader you are capable of becoming.

The goal gives you direction. The habits get you there.

Set the goal high enough that it scares you.

Set a goal that might even seem impossible today.

Then stop obsessing over how far away it looks and start working backward.

10-year goal. 5-year goal. 2-to-3-year goal. 1-year goal. 6-month goal. Quarterly goal. Monthly goal. Weekly goal.

Then ask the question that actually matters:

What am I doing today?

Big goals become much less intimidating when you break them into smaller goals, and smaller goals eventually become today's tasks.

Focus on today.

Then tomorrow.

Then this week.

Stack enough of those days and weeks together and eventually you look up and realize you are much closer to that insane goal than you ever thought possible.

Extraordinary results are usually ordinary actions performed consistently for an extraordinary amount of time.

View on Substack ↗

David Ryan Went From $52K to $16K. Then Made 1,379% in 3 Years

David Ryan knew how to find great stocks.

That wasn’t his problem.

He turned $20,000 into $52,000, then watched the account collapse back to $16,000.

His biggest mistake?

He kept buying the right stocks at the wrong prices.

Ryan was chasing leaders 15% to 20% above proper buy points, getting caught in normal pullbacks, and staying aggressive when the market weakened.

Then he went back and studied his own trades.

That review changed everything.

From 1985 through 1987, Ryan went on to compound a 1,379% return and become a three-time U.S. Investing Champion.

My newest article breaks down exactly how the William O’Neil protégé approaches:

• Finding true growth-stock leaders

• Breakouts vs. pullback buys

• Precise entries

• Adding to winning positions

• Holding major winners

• Cutting failed trades quickly

• Reviewing mistakes so they stop repeating

👇 Read

https://tradingmomentum.substack.com/p/market-wizard-david-ryan-how-he-made

ArticleMarket Wizard David Ryan: How He Made 1,379% in Three Years
View on Substack ↗

The Same Stock Move Can Be a Reason to Hold or Sell

A stock surges on heavy volume. Is that a reason to take profits or hold for a much bigger move? The answer depends on what happened before the surge.

Rules matter, but so does the context in which you apply them. Even fully systematic traders have to account for market conditions: a system with positive expectancy across thousands of trades in one environment can struggle when that environment changes.

Consider a stock with strong earnings and sales growth emerging from a long base. A rapid advance on heavy volume can be evidence of powerful demand and the beginning of a major winner. Automatically selling the entire position because it went up “too much, too fast” can cut short the very opportunity you spent months looking for.

Now consider that same acceleration after a stock has already advanced for more than a year and formed several successive bases. That burst of buying could be a climactic move near the end of the run. O’Neil’s examples of climax tops illustrate why the stock’s prior advance matters.

Similar price action. Different stages of the move. Different implications.

That doesn’t mean abandoning stops or refusing to take partial profits. It means recognizing when the evidence supports giving a potential leader more room to develop and when it supports protecting gains more aggressively. Neither outcome is guaranteed, but the difference matters.

Everyone wants a rule that tells them exactly what to do. Developing judgment means learning to recognize the situation that rule was designed for.

Before asking, “Should I sell this strength?” ask, “Where is this strength occurring within the stock’s larger move?”

View on Substack ↗

Big Returns Don’t Require Big Risk

If you think superperformance requires risking a huge chunk of your account on every trade, spend more time studying the people who have actually achieved it. David Ryan is a three-time U.S. Investing Champion and William O’Neil protégé. His approach puts risk control first.

In one interview, Ryan described starting positions with 5–10%of his portfolio. If a stock advances, builds an entirely new base, and breaks out again, he can add to that already profitable position. Over time, a successful holding can reach 20–25% of his portfolio. That larger position develops as the stock proves itself.

Here’s the math people miss: a 10% position with an 8% stop represents approximately 0.8% of total portfolio equity in planned risk, assuming execution at the stop. Having 10% invested in a stock does not mean risking 10% of your account.

Ryan described his intention to risk no more than 1% of total equity on an individual trade. He also discussed stops around 7%, with tighter setups sometimes allowing 3–4%. The entry matters because it helps determine how closely you can control the risk.

This is the same discipline I keep coming back to when discussing Ryan, Minervini, Zanger and O’Neil: control losses, choose your entries carefully, and build exposure as trades work.

Yet so many traders study these people’s returns and ignore their risk management. They want the performance without practicing the discipline that produced it.

Sometimes the answers are staring you right in the face.

View on Substack ↗

Your Hardest Trading Days May Become Your Proudest Memories

Pain feels different in the rearview mirror.

In the middle of a trading drawdown, you feel frustration, self-doubt, and the weight of every mistake. It’s hard to imagine looking back on this period with anything but relief that it’s over. But distance can change what you see.

Soldiers know this from demanding military schools and difficult deployments. Moments that felt miserable can later become stories told with laughter, pride, and a bond with the people who endured them together. You remember how hard it was, but you also remember what you overcame and who stood beside you.

Keep that perspective when trading gets difficult. The lessons you’re learning, the discipline you’re developing, and the people helping you through it may become some of the most meaningful parts of your journey.

Keep doing the work. Protect your capital, learn from your mistakes, and give yourself a chance to grow through this stretch.

One day, “I hate going through this” may become “I’m proud I made it through that.”

View on Substack ↗

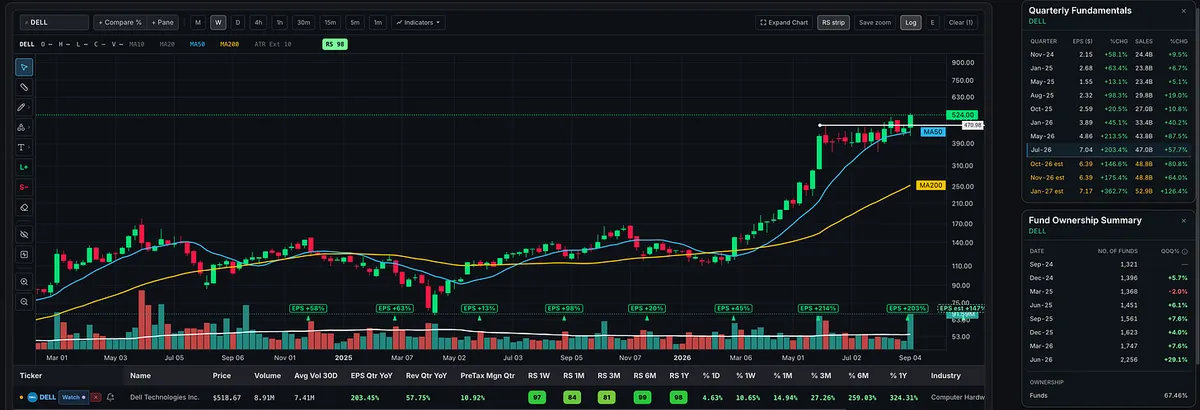
DELL Shook Everyone Out. Now It’s Breaking Out.

I think DELL gets the award for shaking the most people out this week.

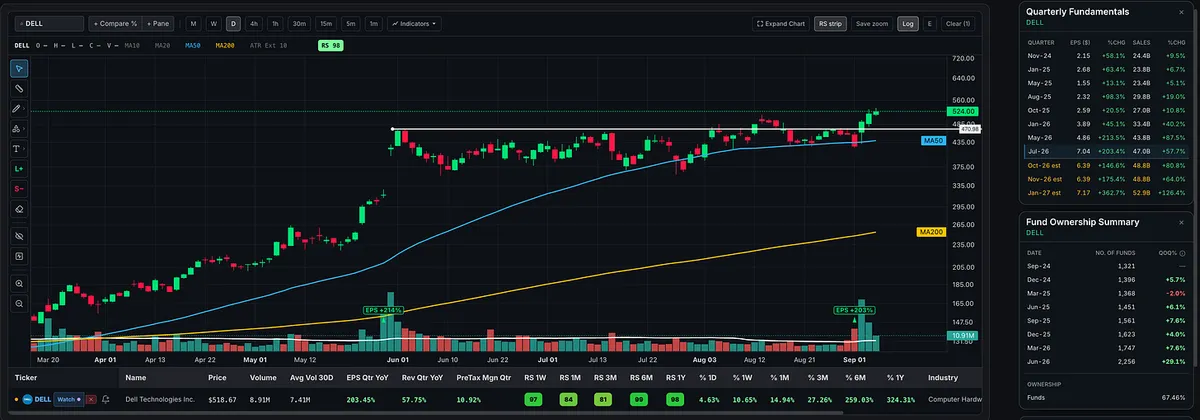
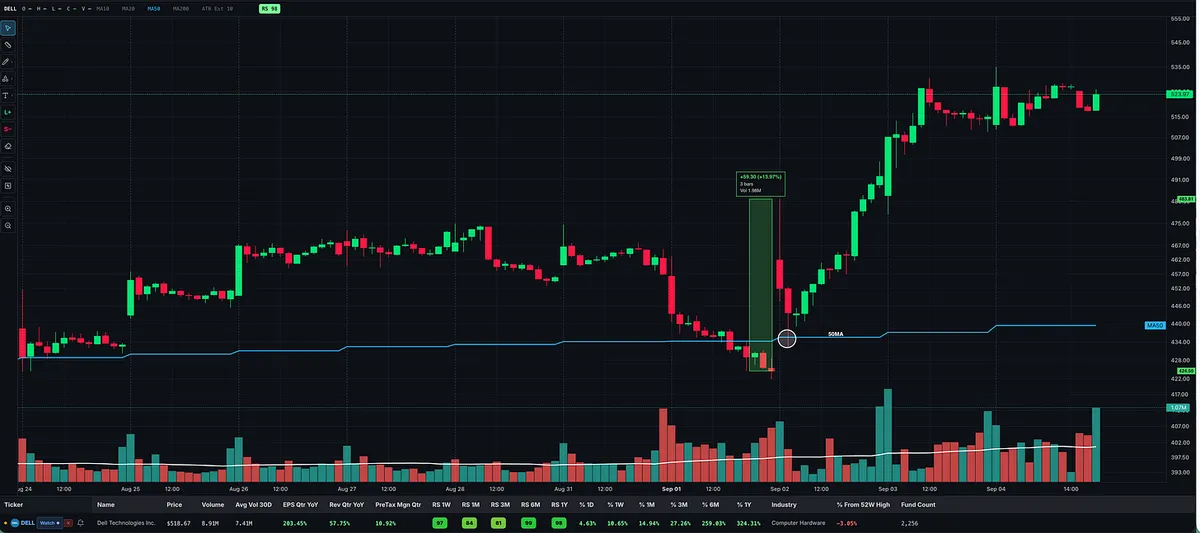
The 30-minute chart tells the story. DELL gapped up after earnings, completely reversed, gave up the entire gap, and briefly undercut its 50-day moving average. Anyone who chased the initial gap or placed an obvious stop near the 50-day probably got taken out.

Then DELL snapped back, reclaimed the 50-day, and rallied nearly $100 from Tuesday’s low.

The daily chart shows how violent the shakeout was. On the weekly chart, it looks like nothing more than a brief pause within the larger uptrend.

The breakout is still developing, but this is a great example of a strong stock doing everything possible to shake people out before starting its next move.

Good job, DELL. 😂

View on Substack ↗

This Is What Demand Looks Like

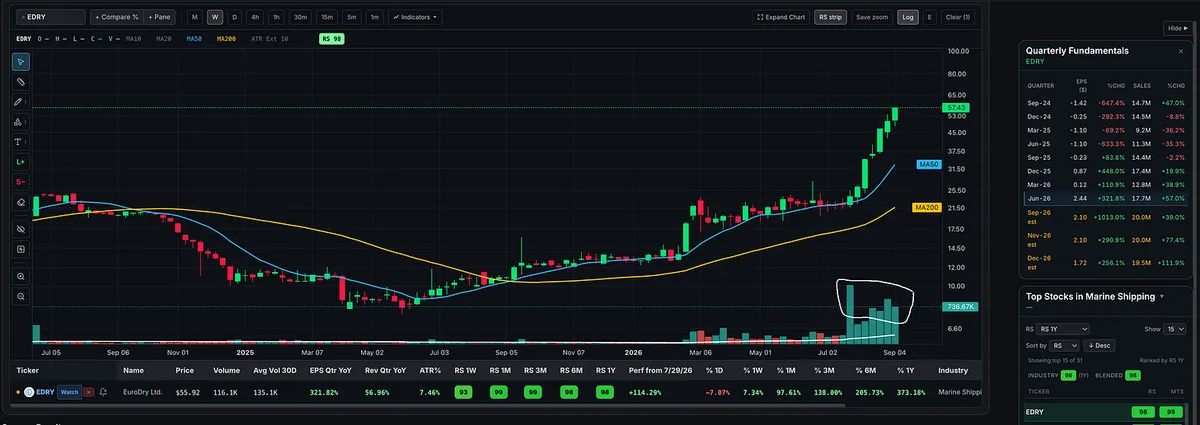
Look at that volume coming into EDRY.

William O’Neil taught that volume is the best measure of supply and demand and institutional sponsorship. Mark Minervini makes the same point: a proper Stage 2 advance should show significant volume on big up days and weeks, with lighter volume during normal pullbacks.

That is exactly what this weekly chart is showing. As EDRY broke out and accelerated, volume expanded dramatically. Price and volume rising together tell you that demand is overwhelming supply.

Train your eye to recognize this kind of volume expansion. Big price moves need fuel, and volume shows you when serious buyers are stepping in.

View on Substack ↗

Swing Trader or Position Trader? The Difference Is Management

The underlying strategy may be the same. What changes is the entry, holding period, and method used to manage the trade.

Time frame affects how long we hold a position and how we manage the trade. It does not necessarily change the foundation of the strategy.

Mark Minervini describes swinging in and out of stocks to compound capital, while David Ryan emphasizes holding winners as long as the uptrend remains healthy. These are tendencies, not rigid rules.

Minervini may hold an exceptional winner for multiple quarters, while Ryan will exit immediately if a new position hits his stop or doesn’t act right.

William O’Neil also combines profit-taking rules with provisions for holding exceptional winners longer. Position trading does not mean holding every purchase for years or tolerating big drawdowns. The longer holding period applies only to stocks that continue acting correctly.

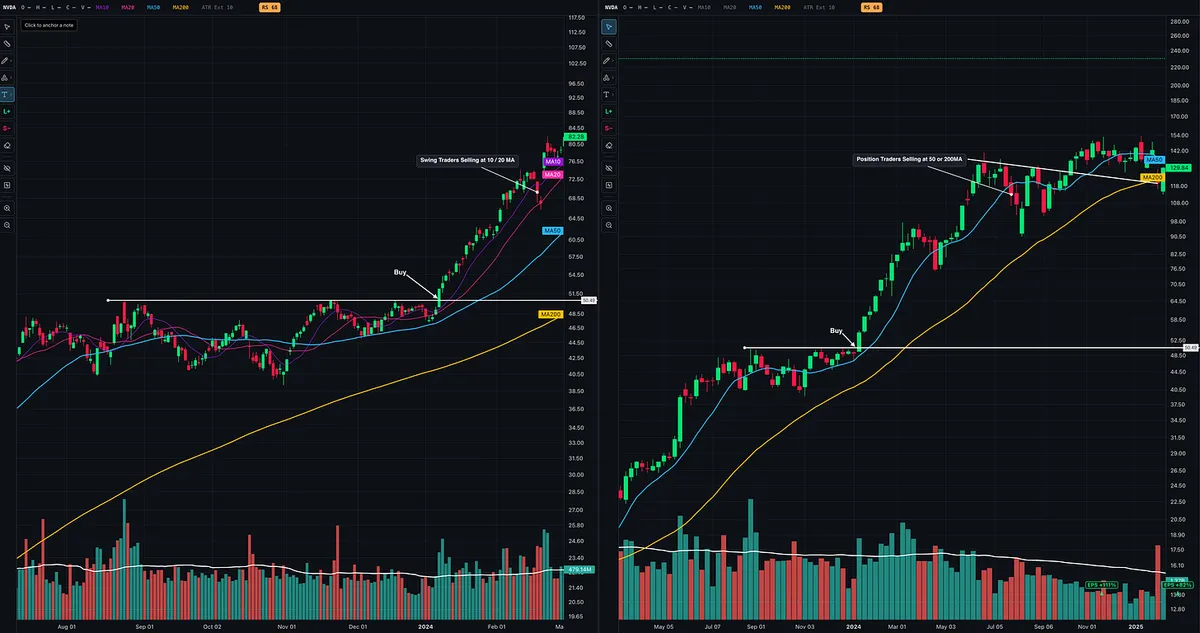
NVDA illustrates how the same opportunity can be managed differently depending on the trader’s time frame.

In this example, both traders enter at the same breakout.

The swing trader may capture the faster portion of the move and begin selling as the stock loses its shorter-term 10-day or 20-day moving averages. The position trader may give the stock more room and use the 50-day or even the 200-day moving average, along with the larger price structure, to participate in a longer advance.

They do not have to use the same entry, either.

One trader may enter on an early cheat, pullback, or pullback reversal, while another waits for the traditional breakout. These are differences in execution, not necessarily differences in the underlying strategy.

Many newer traders confuse a trader’s time frame with the time frame of the chart being viewed. They are related, but they are not the same thing.

A setup can be visible on the weekly chart that is not as clear on the daily chart. A shorter, tighter setup may also appear on the daily chart without creating a distinct pattern on the weekly chart.

Ideally, as we see in this NVDA example, the daily and weekly charts are aligned. The weekly chart confirms the larger Stage 2 uptrend and overall price structure, while the daily chart provides a more precise view of the setup, entry, and risk.

David Ryan is primarily a position trader, but he studies both daily and weekly charts. Minervini generally trades shorter-term swings, but he also uses both.

A swing trader may naturally rely more heavily on the daily chart for setups, entries, and trade management while using the weekly chart for context. A position trader may rely more heavily on the weekly chart for the larger trend and base structure while using the daily chart to refine entries and manage risk.

The chart time frame is the lens being used. The trading time frame is how the position is managed.

A position trader generally seeks to compound capital by giving winning stocks more time to produce larger gains. A swing trader seeks to compound the account through greater trade frequency.

What they share is more important than what separates them.

Both are buying a high-relative-strength leader in a confirmed Stage 2 uptrend with constructive price and volume characteristics. The opportunity may be the same. The difference is how each trader chooses to manage it.

View on Substack ↗

You Can’t Trade What You Haven’t Learned to See

Many traders simply haven’t spent enough time studying charts to consistently recognize great setups. That skill takes practice, repetition, and studying how price and volume behave before, during, and after a move.

There is nothing wrong with mastering just one or two setups. If your thing is VCPs, flat-base breakouts, or cup-with-handles, you can build an entire trading career around those patterns. BUT a smaller playbook generally means fewer opportunities. You have to be willing to sit on your hands until your setup appears.

A broader playbook that includes bull flags, pennants, and upside reversals on pullbacks can give you more opportunities. But knowing the names of more patterns doesn’t mean you’ve developed the skill to trade them. The problem I see is traders who only understand one or two setups trying to trade as though they’ve mastered ten. Their activity exceeds their skill.

With enough chart time, you also begin to realize that a setup doesn’t always need a perfect name. You start recognizing the underlying price and volume behavior: a powerful advance on heavy volume, followed by a controlled pullback or tight consolidation as volume contracts, then renewed buying as price pushes into new highs.

That tight area might be a handle, the final contraction in a VCP, three weeks tight, or a short flag. The shapes differ, but many share the same characteristics: strong demand, evidence of selling pressure drying up, and buyers returning to support the next advance. You learn to recognize where an entry makes sense and where the setup would be invalidated.

There is both an art and a science to reading charts. Spend time studying successful setups and failed ones, learning their differences, and understanding the price action behind the pattern. Expand your trading activity only as your ability develops.

These price and volume patterns have appeared in winning stocks for more than a hundred years. They’re unlikely to disappear anytime soon. The time you spend studying them is an investment in a skill you can use throughout your trading career.

View on Substack ↗

Stocks Like SNDK Are Nothing New

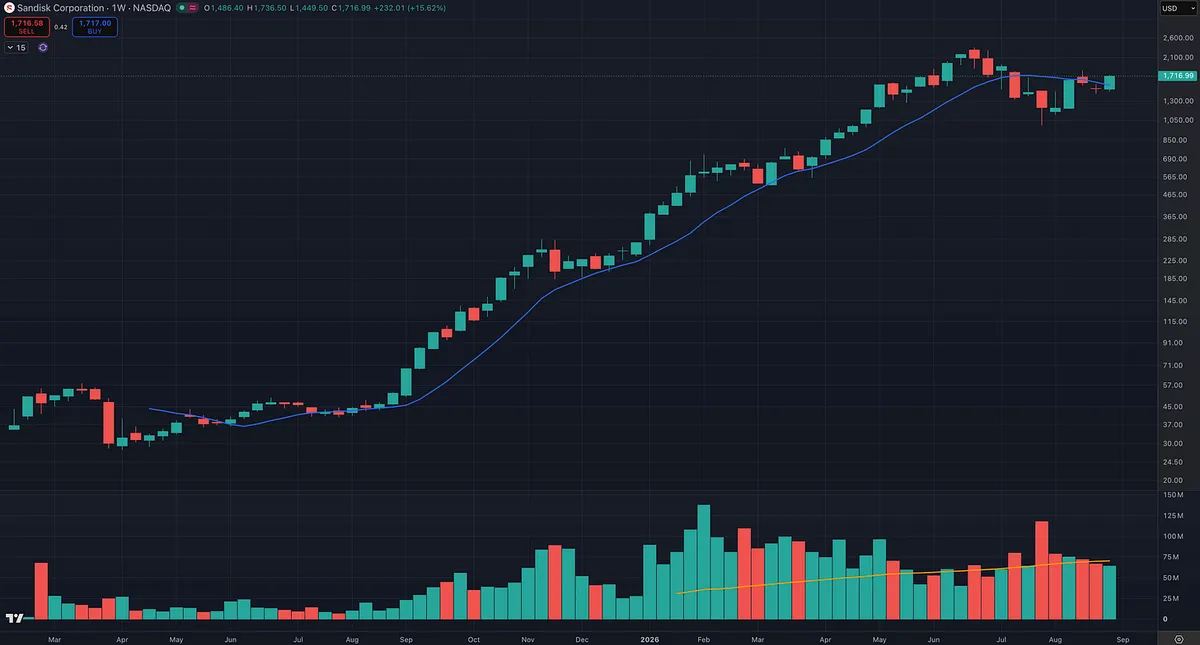
Over the last year, I’ve heard people talk about massive winners like SNDK as though these moves are something unique to modern markets. Open William O’Neil’s How to Make Money in Stocks and study the historical charts. You’ll find stock after stock, across more than a century, that looks remarkably similar to the leaders we see today.

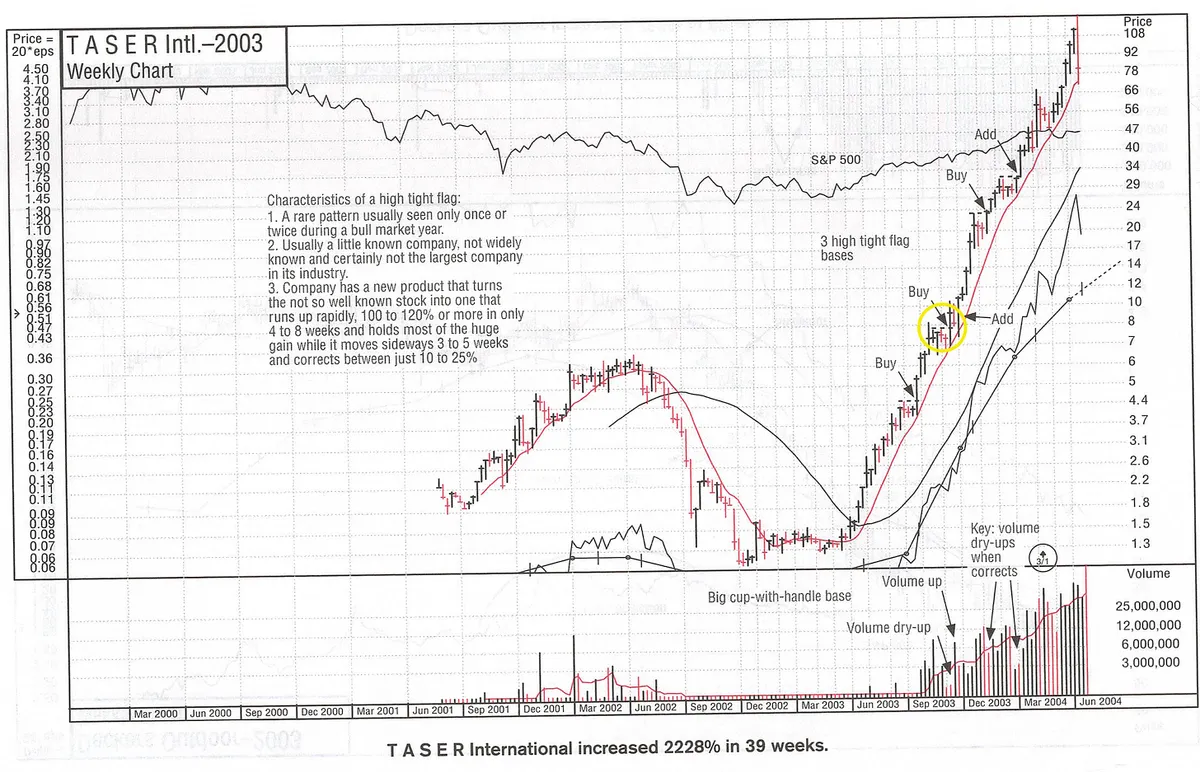
Look at TASER in 2003. O’Neil’s chart identifies three high tight flag bases during an advance that ultimately produced a 2,228% gain in 39 weeks. Notice the buy and add points as the stock keeps moving into new highs.

I’ve shared and discussed many stocks with similar patterns over the last couple of years, and the response is often the same: “It looks too extended.” But a stock having already made a huge move doesn’t automatically mean its next setup is unbuyable. I think some traders are missing what bull flags and pennants actually look like, and how tight consolidations or pullbacks can provide opportunities to enter and manage risk. They let fear or memories of past failed trades keep them from taking the next valid setup, potentially missing a huge opportunity.

If you call yourself a growth stock investor or momentum trader, study the biggest winning stocks in history. Buying strength and new highs is central to this discipline. We look for powerful stocks forming valid setups, and we use sell rules to cut losses when we’re wrong and protect gains as trends break down.

History gives us the confidence to buy strength. Discipline helps us manage the risk.

View on Substack ↗

When Should You Sell a Winning Stock?

Finding a great stock is only half the battle.

The harder part is knowing when to hold, when to trim, and when to protect the gain without cutting a potential monster winner short. In this post, I break down how I use moving averages, donchian channels, higher lows, ATR trailing stops, partial sales, and financing risk to manage winning trades.

O’Neil and Minervini both spent a lot of time on this exact problem because how you manage the winner can matter just as much as finding it.

👉 Read: https://tradingmomentum.substack.com/p/when-should-you-sell-a-winning-stock

ArticleWhen Should You Sell a Winning Stock? The Trade Management Playbook
View on Substack ↗

IBIT

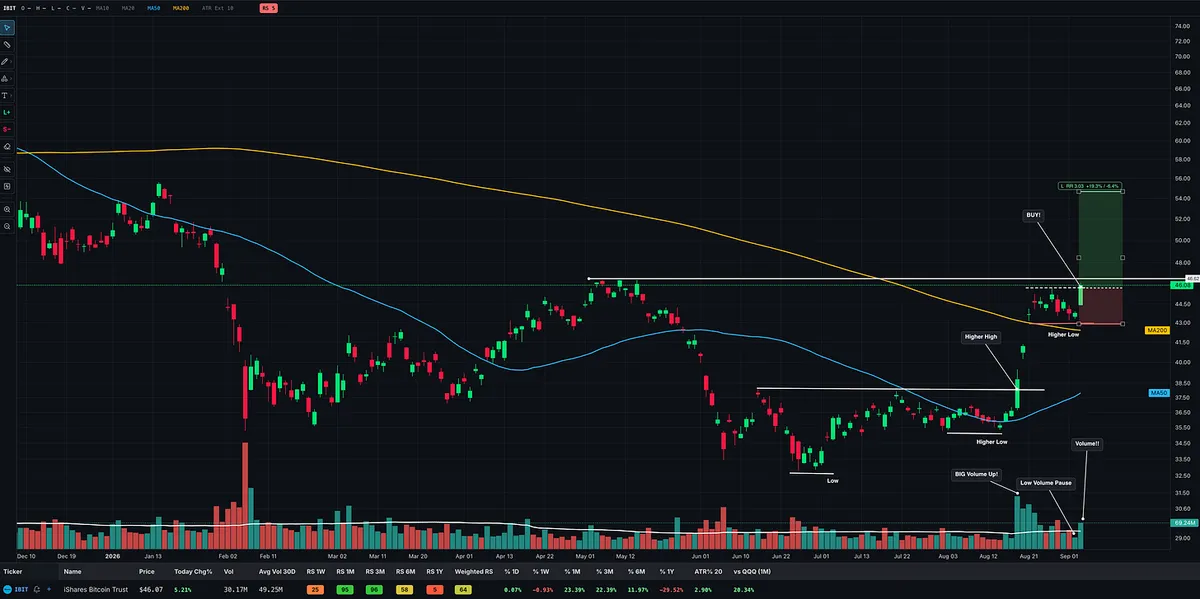
Buy at $45.90

Stop at $43

Late Stage 1 → potential Stage 2 transition.

It still doesn’t have all the ingredients I normally want for a fully confirmed Stage 2 uptrend, including the 50-day above the 200-day and the 200-day rising, but the change of character is getting my attention.

Not quite Stage 2 yet by Minervini or Weinstein’s stricter definitions.

Quoting Momentum Trading StrategyI Don’t Need to Call the Bottom. I Need to See the Character Change. Bitcoin and crypto are getting my attention again. Not because I’m trying to predict the bottom. Because the price action is starting to behave differently. Look at IBIT on the attached chart. We had the low, then a higher low, a higher high on str…
View on Substack ↗

The U.S. Debt Crisis Has Been “Coming” for Over 40 Years

There’s a lot of chatter about the U.S. debt again.

And I’m not saying it isn’t a problem. It is. But one thing studying market history teaches you is that being right about a long-term problem and being right about when it becomes a market problem are two very different things.

Go back to the late 1980s.

In the 1987 Paul Tudor Jones documentary Trader, Jones correctly anticipated the stock market crash. But the documentary also discussed his much broader belief that America could be nearing the end of a 200-year bull market.

Then read the Jim Rogers interview in Market Wizards. Rogers was already talking about U.S. budget deficits, trade deficits, foreign debt, a weakening dollar and eventually a collapse in the bond market. When Schwager asked when, Rogers basically admitted he didn’t know. He said it could be three years or it could be ten.

That interview was more than 35 years ago.

The point isn’t that debt doesn’t matter. It absolutely does. The point is that nobody knows when a long-term structural problem becomes the catalyst that actually matters to markets.

It could become a major issue tomorrow. It could be 10, 20 or 30 years from now. It could be long after we’re gone.

So understand the debt. Understand the potential consequences. But also understand your time frame.

For most traders, letting a decades-long macro concern override what the market is actually doing today can be just as dangerous as ignoring the risk completely.

And this is something I think a lot of people struggle to separate.

A major economic crisis can be terrible for the country and devastating for millions of people. We saw that in 2008. We saw something far worse during the Great Depression. You can understand that, care about it and still recognize that your job as a trader is different.

Your job is not to predict the exact day the system finally breaks.

Your job is to follow your system, manage risk and respond to what the market is actually doing.

You could sit in cash for 10 years waiting for a debt crisis that never comes while the market goes through an enormous bull market. Or you could participate in that bull market and allow your rules to progressively reduce exposure when the market itself begins telling you conditions have changed.

That is why having a strategy and a risk-management process matters so much.

You have to learn to separate what you believe is right for the country, the economy or society from what the market is actually doing. Those are not always the same thing.

If a true debt crisis eventually arrives, it could be devastating economically, but as traders, our advantage is that we do not have to predict when it happens.

We have to recognize when the market changes and act accordingly.

None of this is new. Traders were having almost the exact same conversation before many people participating in markets today were even born.

View on Substack ↗

I Don’t Need to Call the Bottom. I Need to See the Character Change.

Bitcoin and crypto are getting my attention again.

Not because I’m trying to predict the bottom.

Because the price action is starting to behave differently.

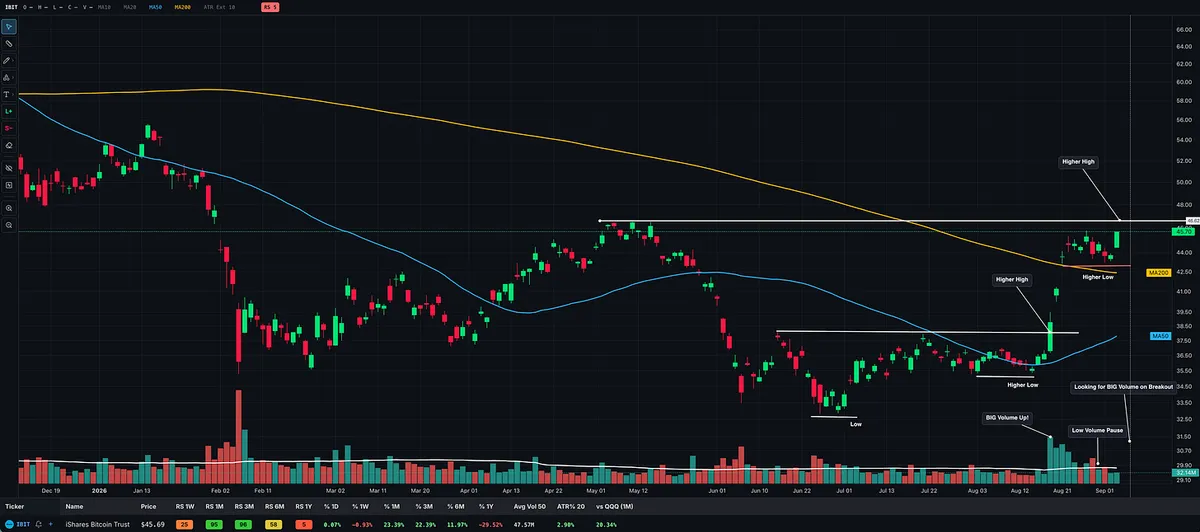
Look at IBIT on the attached chart. We had the low, then a higher low, a higher high on strong volume, another higher low, and now price is pushing back toward the prior May high. Short-term relative strength has improved significantly.

That is what I mean by a change of character.

You see this repeated across O’Neil, Minervini, Weinstein, Ryan, and Zanger.

Minervini describes a Stage 2 advance as a stock beginning to stair-step higher through higher highs and higher lows, with strong volume on advances and lighter volume on pullbacks.

Zanger describes an uptrend almost the same way in Momentum Masters: higher highs, higher lows, with tight consolidations between advances. Ryan also wants the moving averages and relative strength confirming the trend.

Weinstein puts heavy emphasis on relative strength improving before the breakout and warns that poor volume on a breakout is a danger signal.

But this is important:

Change of character is not full confirmation.

IBIT has reclaimed its 50-day and 200-day moving averages, but the longer-term trend still has work to do.

Minervini’s confirmed Stage 2 criteria require the 200-day to turn higher, with the shorter moving averages properly aligned above it.

Ryan describes an even stronger uptrend as the 20-day above the 50-day, the 50-day above the 200-day, with the averages rising.

We are not there yet.

There is also still plenty of overhead supply with IBIT well below its all-time highs.

So I’m not saying:

“Bitcoin is definitely starting a new bull market.”

I’m saying:

The evidence is improving.

Higher lows. Higher highs. Improving RS. Big volume on the initial upside move. Low-volume consolidation afterward. Price now pressing back toward resistance.

The next thing I want to see is simple:

A decisive breakout through the prior high on strong volume, followed by price holding that breakout and continuing to build the uptrend.

Then I want to see the moving averages continue to improve and eventually stack correctly as the trend matures.

I don’t need to guess what Bitcoin will do next.

I just need to recognize when the market starts telling me something has changed.