Momentum Trading Strategy

Notes

Short lessons on momentum trading, every day.

Every note from Substack, in one place: risk, setups, leading stocks, market conditions and the mindset behind them. Search them, browse by topic, or filter by stock.

Showing 1101–1120 of 1230 notes

View on Substack ↗

Many ask how I trade differently between my day trading account and my swing/position account.

This is the cleanest explanation I’ve found, from Market Wizards, quoting Mark Weinstein.

Swing & Position Trading

“Although the cheetah is the fastest animal in the world and can catch any animal on the plains, it will wait until it is absolutely sure it can catch its prey. It may hide in the bush for a week, waiting for just the right moment. It will wait for a baby antelope, and not just any baby antelope, but preferably one that is also sick or lame. Only then, when there is no chance it can lose its prey, does it attack. That, to me, is the epitome of professional trading.”

That’s how I treat swing and position trades.

Extreme selectivity. Patience. Waiting for the right setup under the right conditions.

Fewer trades. Higher conviction. Asymmetric payoff.

I’m looking to trade the best CANSLIM names only: big earnings, big sales, top industry groups, clear institutional accumulation, and high relative strength.

Day Trading

“When I trade at home, I often watch the sparrows in my garden. When I feed them bread, they take just a little piece at a time and fly away. They keep on flying back and forth, taking small bits of bread. They may have to make a hundred stabs at a piece of bread to get what a pigeon gets at one time, but that is why a pigeon is a pigeon. You will never be able to shoot a sparrow, it is just too fast. That is the way I day trade.”

Day trading is different.

Quick profits. Raise stops. Leave a portion to run. Repeat.

I’m still trading momentum, but the focus shifts to stocks in play: news catalysts, earnings, new highs, gaps, heavy volume, and high RVOL. Speed and execution matter more than perfection.

Different timeframes. Different filters. Same discipline.
View on Substack ↗

If you trade stocks, you already know this is true:

Your results improve when you understand the environment you are trading in.

Even short-term traders benefit from big-picture context. As Mike Bellafiore explains in The Playbook, professional traders do their homework first. They understand market conditions, leadership, and risk before they focus on execution.

This Big Picture Market Pulse breaks down:

  • Market regime

  • Relative strength leadership

  • Breadth and internal health

  • Liquidity, rates, and sentiment

So whether you day trade, swing trade, or position trade, you are not guessing. You know what type of market you are operating in before you put capital at risk.

👉 Read the full Market Pulse here.

https://tradingmomentum.substack.com/p/big-picture-market-pulse-december

On SubstackBig Picture Market Pulse — December 21, 2025
View on Substack ↗

My Favorite Trade Setup: Big Momentum, Tight Contraction, Asymmetric Risk

Most traders chase breakouts. I wait for something else.

First, a big momentum move.

Then price tightens and contracts.

Volume dries up as sellers disappear.

Then price breaks out with volume confirming the move.

That is where asymmetric risk shows up.

Small, defined downside. Open-ended upside.

I just published a full post breaking this setup down step by step, including:

  • What I look for to validate it

  • Where I enter

  • Where my stop goes and why

  • When I pass and do nothing

This works on weekly charts, intraday charts, and even short scalping timeframes.

Same behavior. Every market. Every cycle.

👉 Read the full breakdown here https://tradingmomentum.substack.com/p/my-favorite-trade-setup-big-momentum

ArticleMy Favorite Trade Setup: Big Momentum, Tight Contraction, Asymmetric Risk
View on Substack ↗

Why Markets Move the Same Way on Every Timeframe

Trading is fractal, just like nature. The same patterns that exist on daily and weekly charts also appear on 30-minute, 15-minute, 5-minute, and even 1-minute, 15-second, and 5-second charts.

Yesterday, the Nasdaq gave a textbook example.

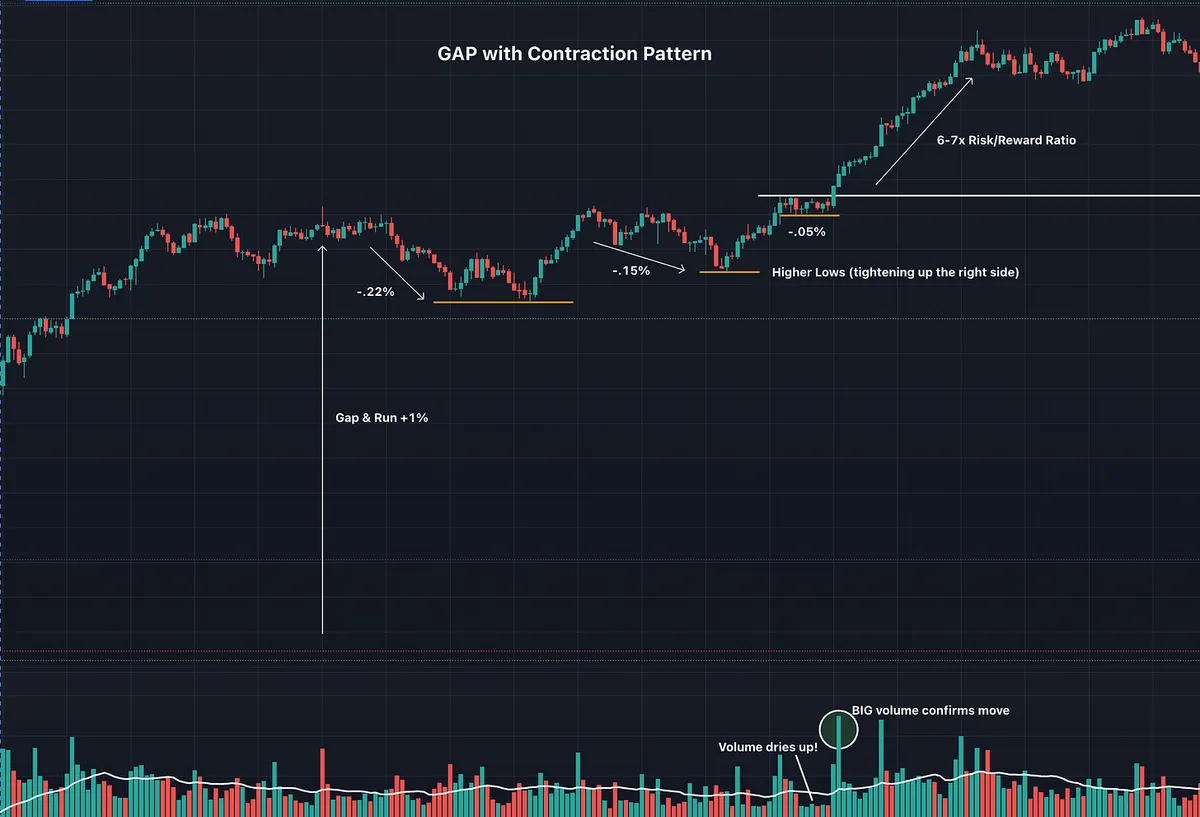
We opened with a ~1% gap up and run, followed by a strong initial impulse. After that move, price began to contract in a very orderly way.

Each pullback became progressively smaller:

  • First contraction: -0.22%

  • Second contraction: -0.15%

  • Third contraction: -0.05%

As price tightened up the right side of the chart, volume dried up.

That’s the tell.

Selling pressure was fading. Supply was disappearing. When price finally broke out of the contraction, volume expanded, confirming the move and producing a ~6–7x risk/reward opportunity.

This is what I call a Contraction Pattern.

It’s the same behavior across all timeframes:

  • A strong impulse

  • Followed by shrinking pullbacks

  • With volume drying up

  • Leading to expansion

As volatility contracts, risk tightens and reward expands.

These are the types of trades I look for over and over again.

View on Substack ↗

“Some of the best trades come when everyone gets very panicky. The crowd can often act very stupidly in the markets. You can picture price fluctuations around an equilibrium level as a rubber band being stretched. If it gets pulled too far, eventually it will snap back. As a short-term trader, I try to wait until the rubber band is stretched to its extreme point.”— Linda Bradford Raschke, The New Market Wizards

View on Substack ↗

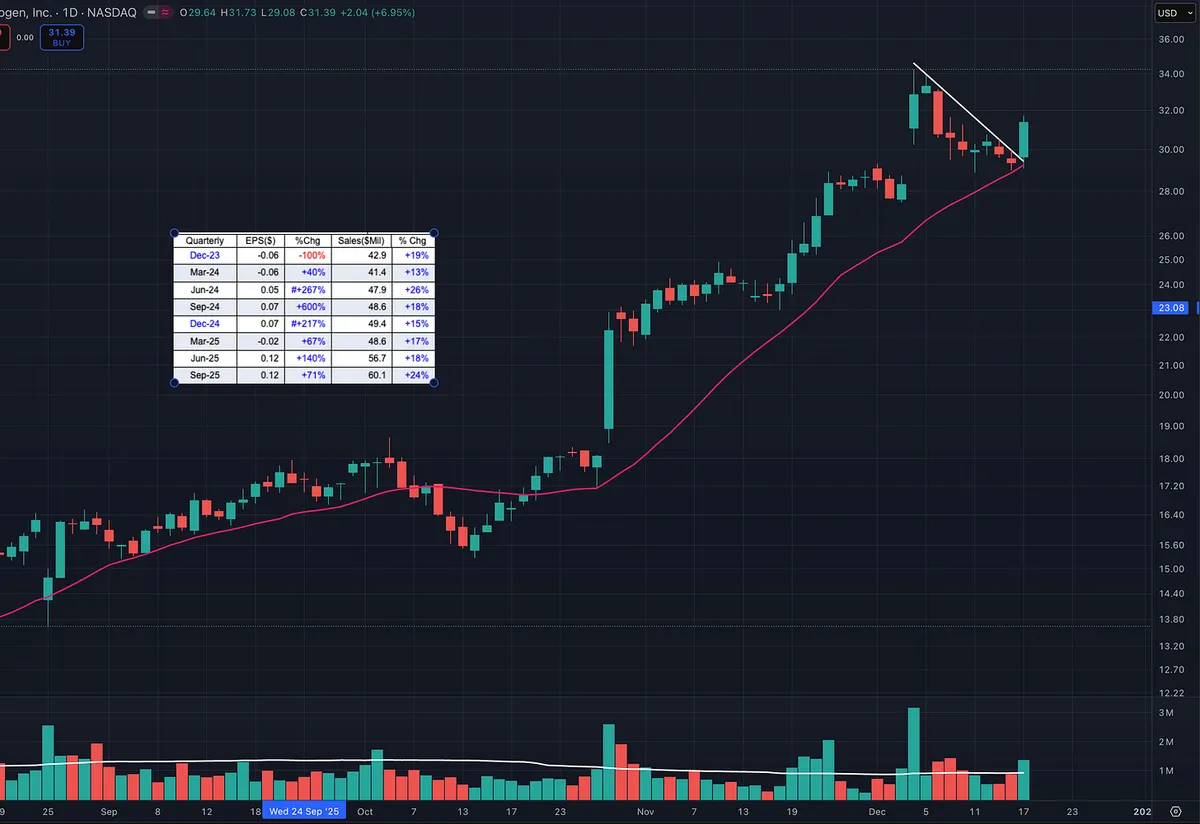
Powerful move from a watchlist stock today.

AXGN bounced cleanly off the 20-day moving average on expanding volume while the major indexes were down.

That relative strength matters. When a stock holds support and pushes higher against a weak market, it’s a sign institutions are still accumulating.

The best leaders rarely give deep pullbacks. They reset just enough to shake out weak hands, then move again.

This is why keeping a tight, prepared watchlist matters. When the market gives you the signal, it’s time to execute.

View on Substack ↗

“Learn to take losses. The most important thing in making money is not letting them get out of hand. And don’t increase your position size until you’ve doubled or tripled your capital. Most people make the mistake of betting bigger as soon as they start making money. That’s a quick way to get wiped out.”— Marty Schwartz, Market Wizards

View on Substack ↗

Most traders study charts after the big move.

That’s why they keep missing the best setups.

The real edge is learning to recognize what a stock looks like before it breaks out. Tightening price action. Drying volume. Quiet strength on the right side of the base.

I just published a post on how to train your eye to spot winning setups in real time, using NVDA as a real example.

If you want to stop chasing and start anticipating, this is worth reading.

👇

https://tradingmomentum.substack.com/p/how-to-train-your-eye-to-spot-winning

ArticleHow to Train Your Eye to Spot Winning Stock Setups Before the Breakout
View on Substack ↗

“Human nature never changes. Therefore, the stock market never changes. Only the faces, the pockets, the suckers, the manipulators, the wars, the disasters, and the technologies change. The market itself never changes. How can it? Human nature never changes, and human nature runs the market — not reason, not economics, and certainly not logic. It is our human emotions that drive the market, as they do most other things on this planet.”

— Jesse Livermore: World’s Greatest Stock Trader by Richard Smitten

View on Substack ↗

REMINDER: “Don’t fight the Fed” – Marty Zweig

The One Rule Almost Every Market Wizard Agreed On

There is a reason the large majority of Market Wizards subscribed to Marty Zweig’s newsletter. Zweig wasn’t just another voice on Wall Street. He was the one who gave the world a simple rule that explained entire market cycles:

Don’t fight the Fed.

The best traders in the world built this into their process. When liquidity was flowing and rates were moving lower, they pressed. When the Fed was tightening and raising rates, they pulled back.

The Wizards didn’t obsess over predictions. They watched the tape, respected monetary conditions, and aligned themselves with the primary trend.

And that one rule still works today.

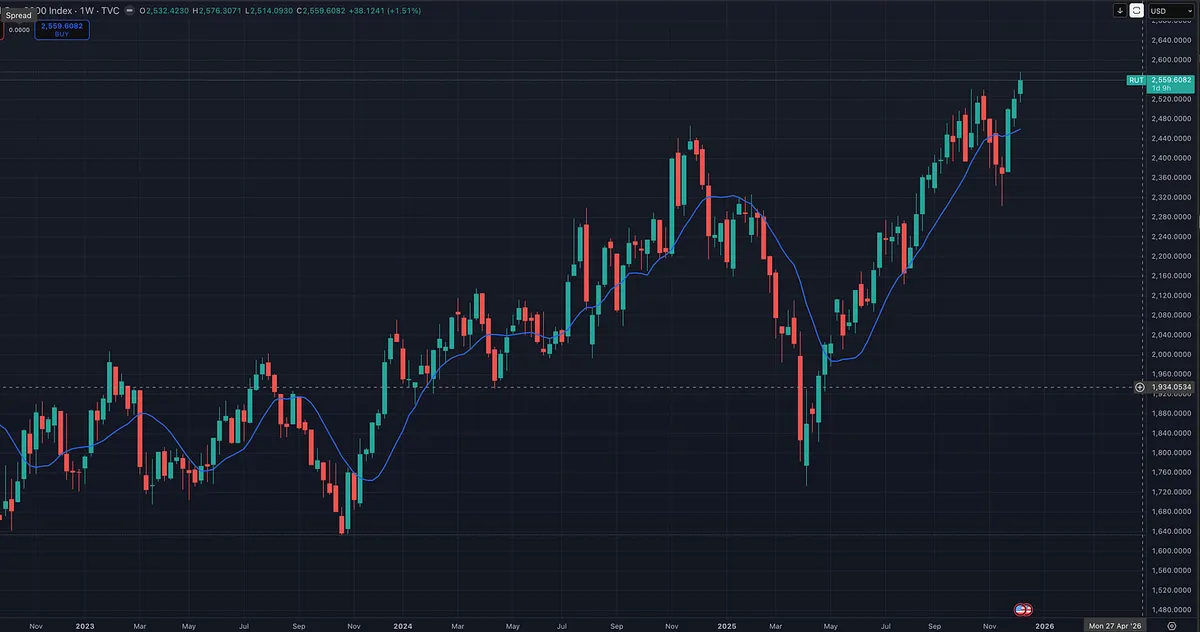
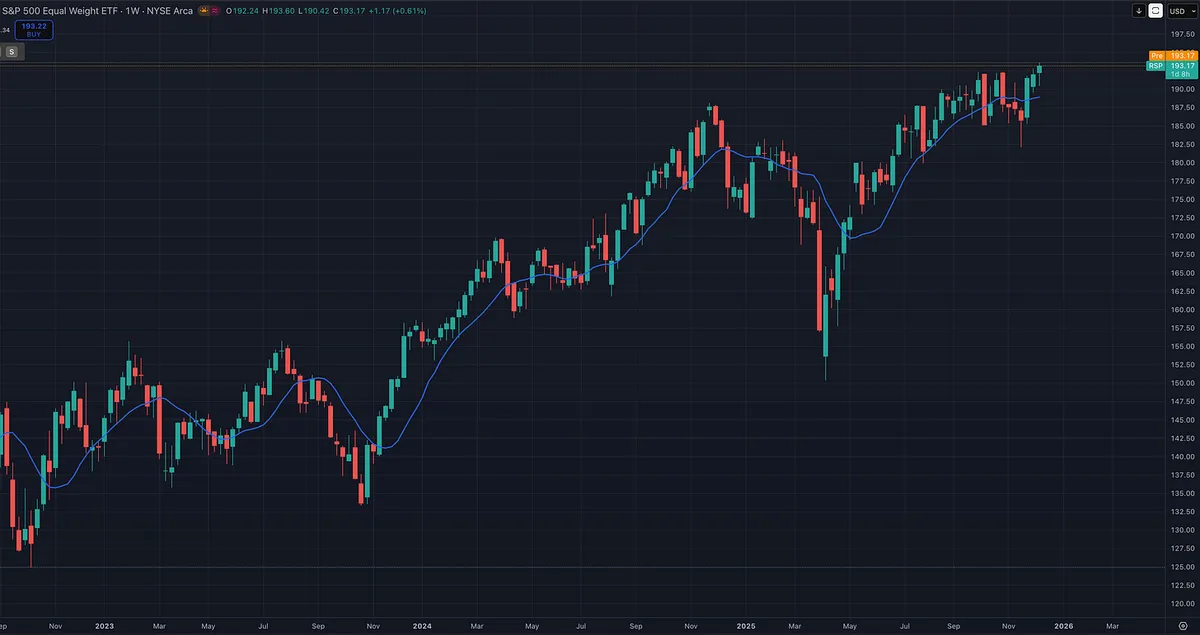
The Russell 2000 is at all-time highs. The Equal Weight S&P 500 is at all-time highs. Every major index is closing in.

While negative media gets more views, the same is true for bearish commentary on social media. That constant doom cycle has caused countless people to miss one of the strongest bull markets happening right in front of them.

Start listening to the market, not the commentators. The tape tells the truth.

View on Substack ↗

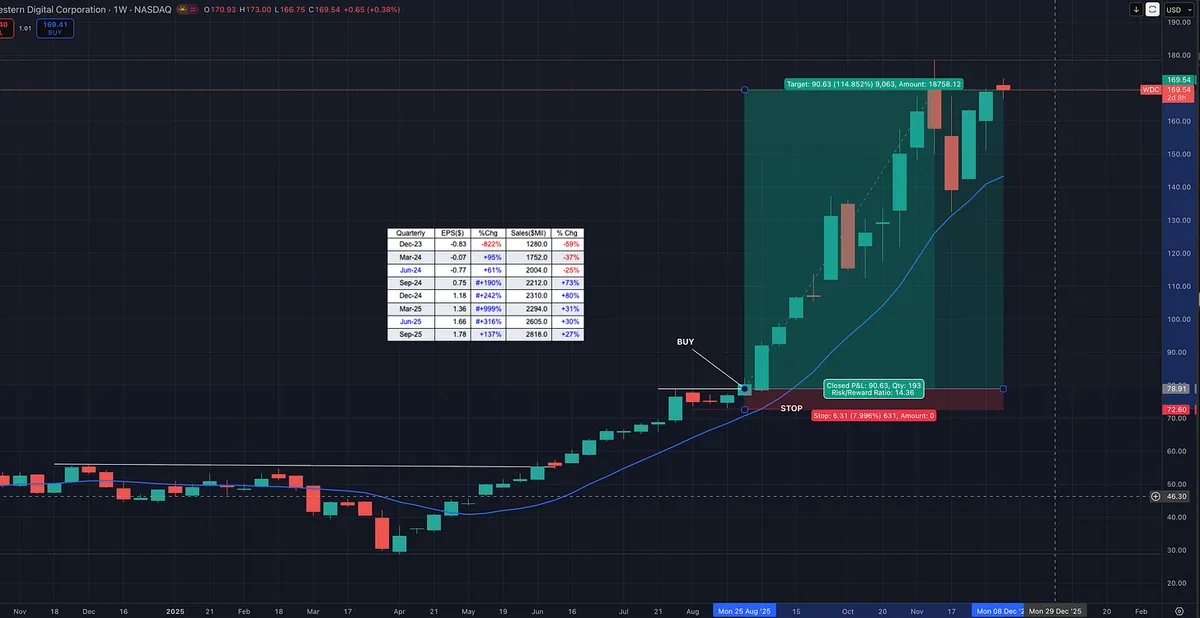
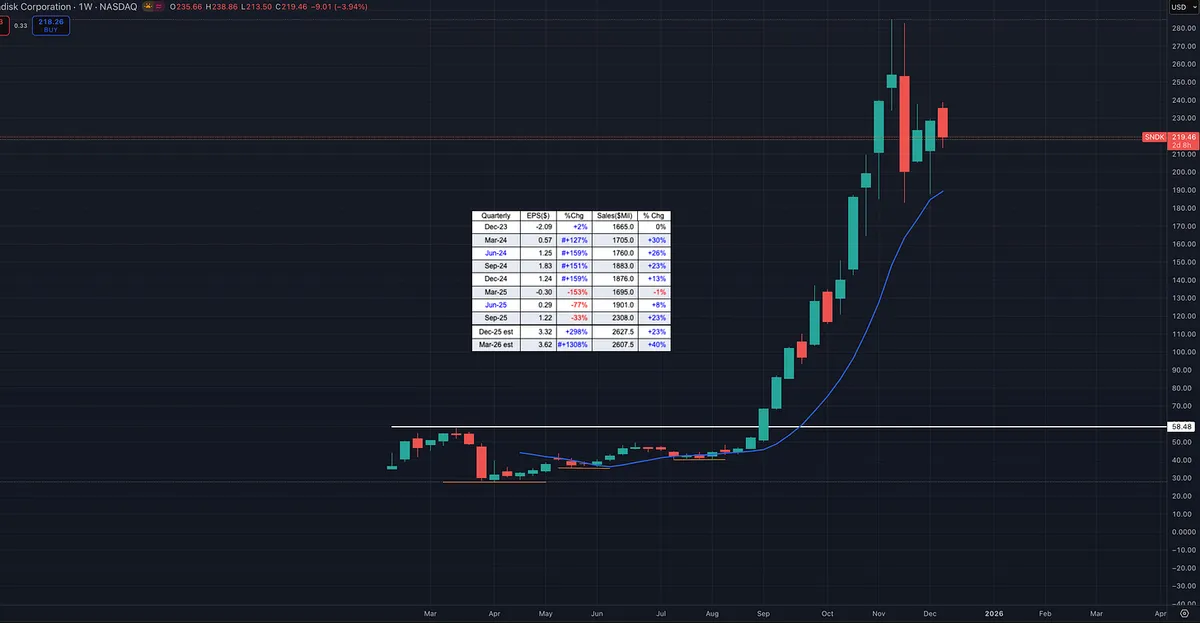
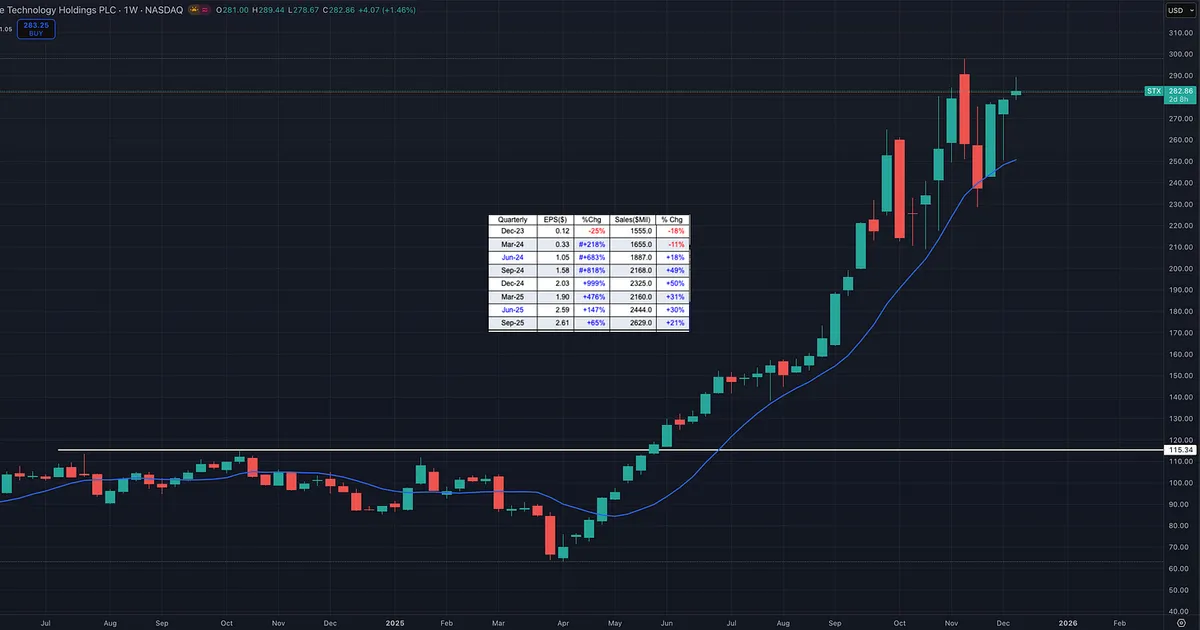
Data Storage Quietly Became One of the Strongest Leadership Groups in the Market

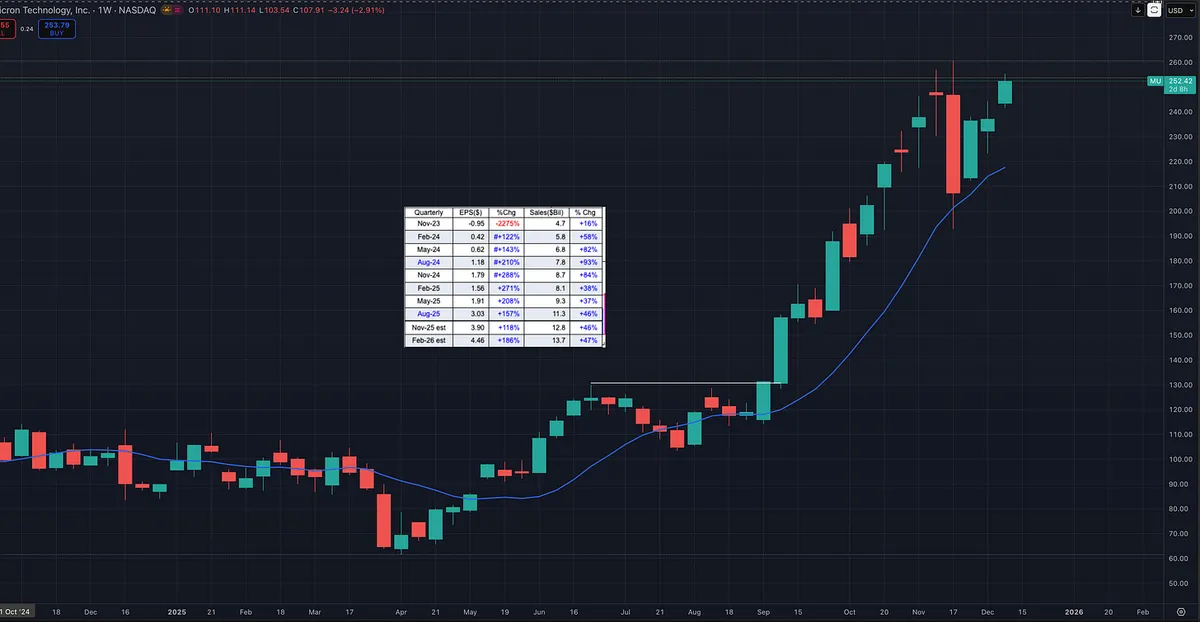
While everyone kept talking about chips, metals, and AI all year, the real expansion of this bull cycle has been happening somewhere else: data storage.

MU, WDC, STX, and even SNDK have been posting massive earnings and sales acceleration. SNDK has not delivered the same near-term numbers, but analysts and funds are clearly positioning for future growth and the stock has surged alongside the leaders.

This entire group started emerging back in April. Since then, the charts, the tape, and the fundamentals have all lined up.

This is exactly why serious traders track relative strength stocks and relative strength industry groups. Leaders rarely move alone. The biggest moves come when multiple stocks in the same industry begin showing strength at the same time, which is a sign that big money is rotating into that group.

When a major theme like AI takes hold, leadership does not stay static. It expands. And by the time most people finally recognize the True Market Leaders, the next group is already breaking out.

Watch the stocks. Watch the groups. Watch the earnings and sales.

View on Substack ↗

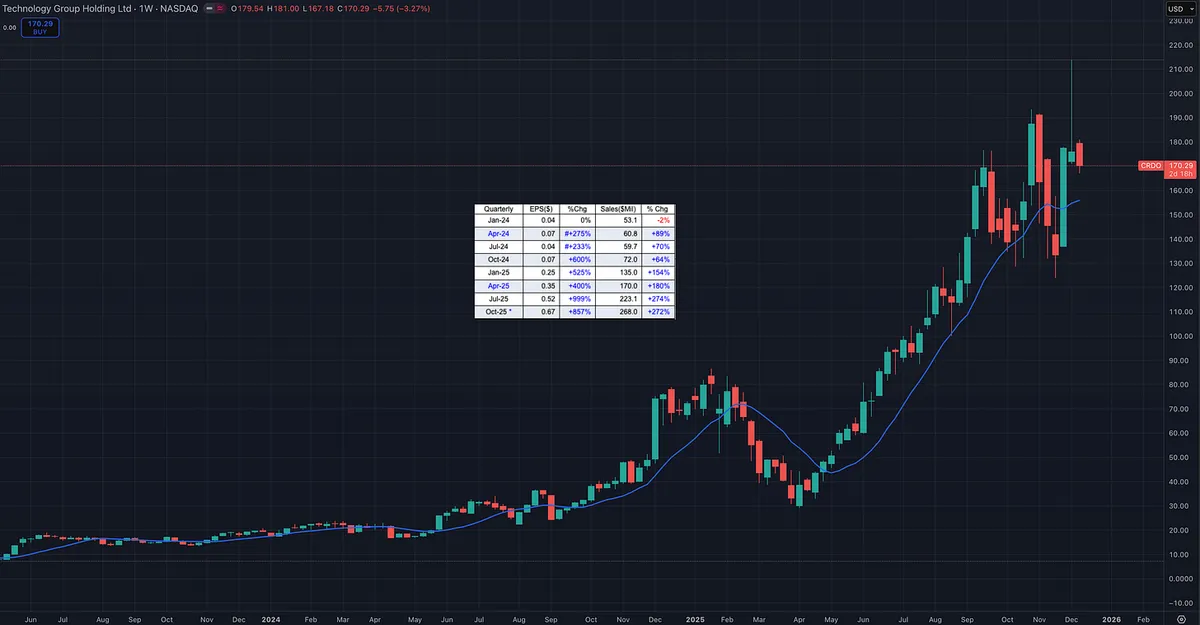
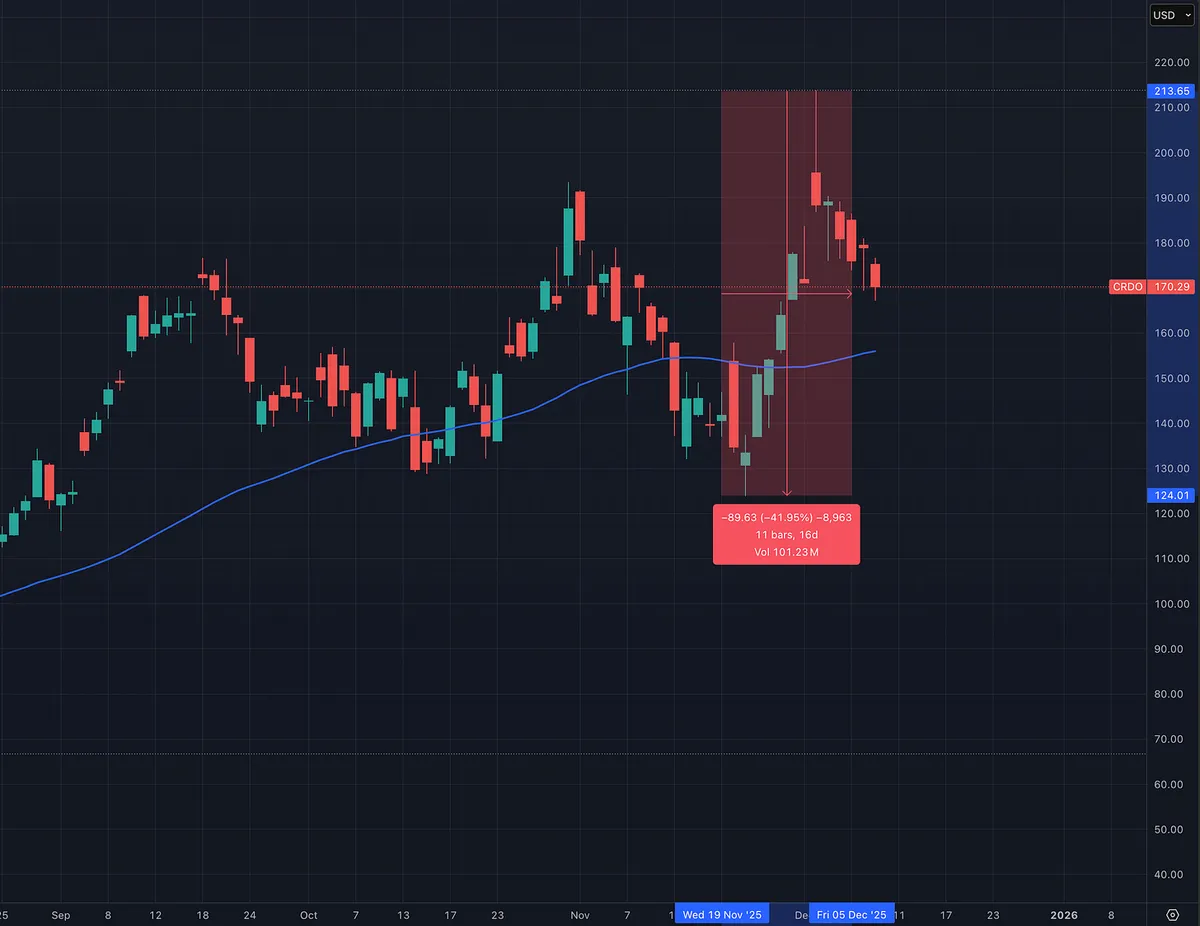
CRDO is a Leader with Elite Fundamentals but the Tape is Telling a Different Story

CRDO continues to post some of the strongest numbers in the entire market. Earnings growth is explosive. Sales acceleration is off the charts. Margins and return on equity are exceptional. Fund ownership is rising fast and the stock carries a Relative Strength rating of 98, which places it near the top of all equities.

The theme is perfect as well. CRDO sits in a hot industry group and lines up with the broader bull market cycle that has rewarded AI and high performance semiconductor names all year.

On paper this is everything you want to see from a future leader.

But the price action is sending a warning. The recent wide and loose behavior on the weekly chart is not what you want to see after a strong advance. True leaders usually tighten up, pull back in a controlled manner, and continue to show evidence of institutional support. When the bars become wide and the swings get emotional, it tells you the tape is not in full agreement.

The stock is powerful, but the action needs to calm down. The high to low swing is close to 40 percent. Ideally we would see the chart tighten along the right side and form a more controlled structure. That would give us a cleaner risk reward setup and a higher quality breakout opportunity.

View on Substack ↗

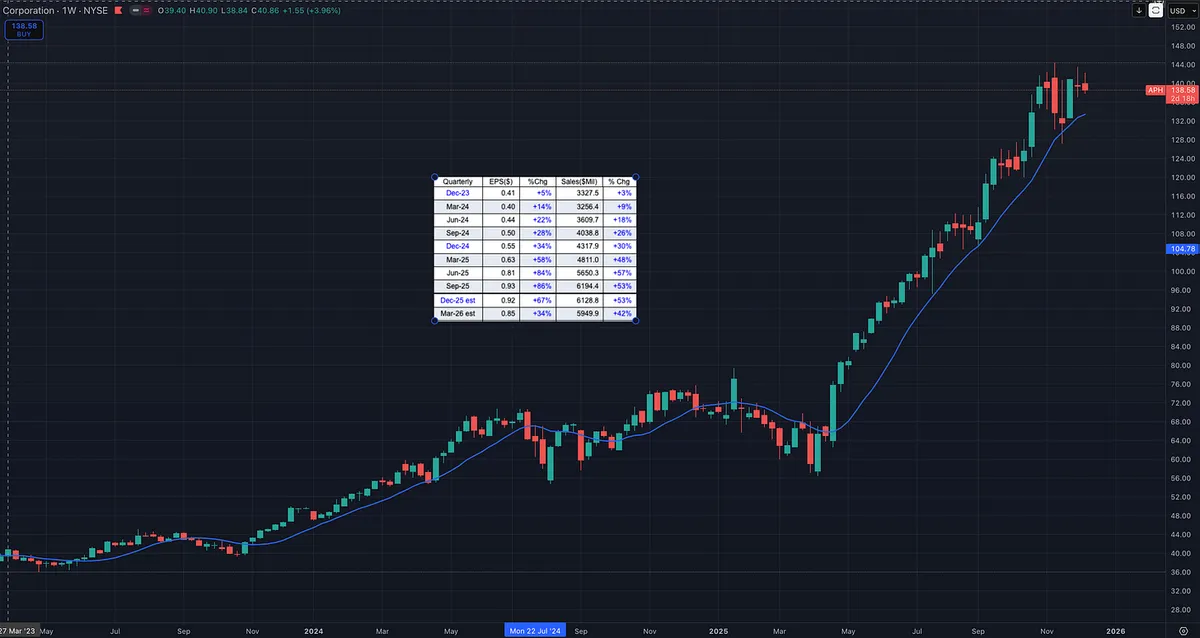
APH is a Textbook CANSLIM Leader

APH has been one of the true market leaders this year. The stock is showing the exact characteristics that appear again and again in the biggest winners. Earnings are strong and accelerating. Sales growth is consistent. Margins and return on equity are elite. Fund ownership keeps rising, which confirms steady institutional accumulation.

Price action agrees. APH carries a Relative Strength rating of 94 and continues to outperform most of the market. It also sits inside a powerful industry group and benefits from the larger AI infrastructure theme that is driving capital flows this cycle.

This is what CANSLIM was built to identify. A company with elite fundamentals, strong technical action, increasing sponsorship, and a major trend behind it. When all of these line up, you get a potential leader that can continue to surprise on the upside.

APH checks every CANSLIM box right now.

View on Substack ↗

I cannot predict what the market will do. No one can. What I can do is observe how the market behaves and how it reacts to information like Fed decisions or major catalysts. Price action tells the truth. Reactions tell you even more. My job is not to guess. My job is to interpret what the market is revealing and take trades only when the risk to reward is firmly in my favor. This is the foundation behind every great trader from O’Neil and Minervini to Zanger and Darvas. They did not predict. They observed, prepared, and acted only when the market confirmed their thesis.

View on Substack ↗

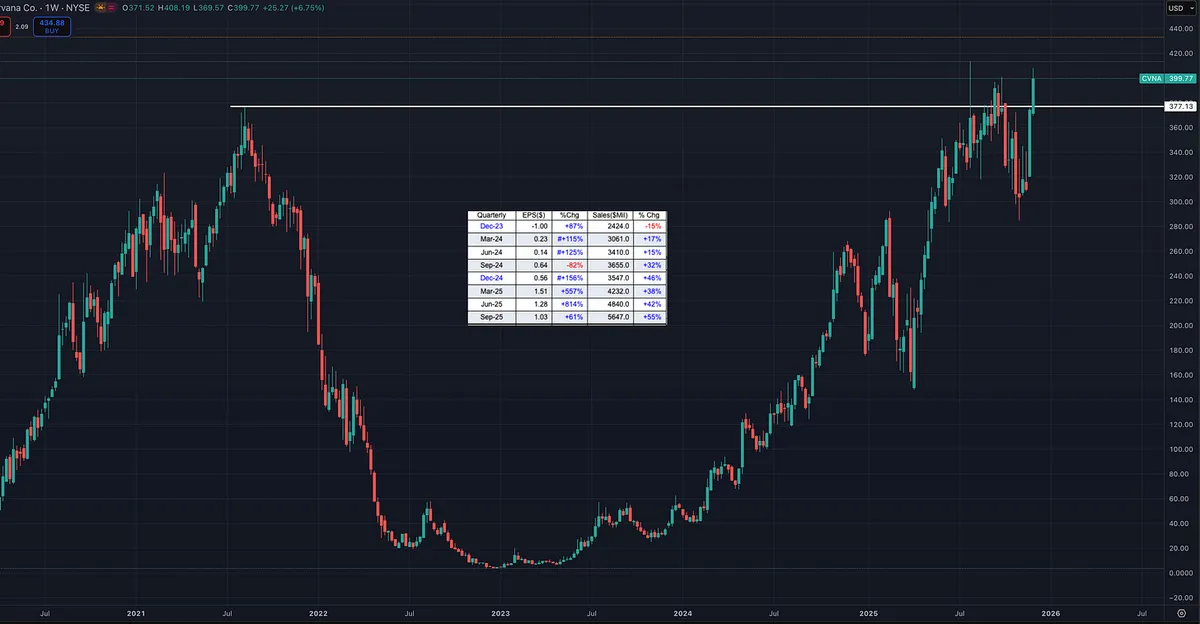
$CVNA is a powerful example of a true fundamental turnaround.

Earnings and sales growth have exploded over the past year, and institutional fund ownership has doubled. RS is 91 and confirming the strength.

EPS has shifted from negative to consistent double and triple digit growth. Sales have now accelerated for four straight quarters. When both earnings and revenue inflect this aggressively, the market pays attention.

The stock just broke out to all-time highs with clear institutional accumulation behind the move.

High growth. Rising demand. Strong technicals. Increasing institutional sponsorship.

This is the type of leadership you want on a watch list.

View on Substack ↗

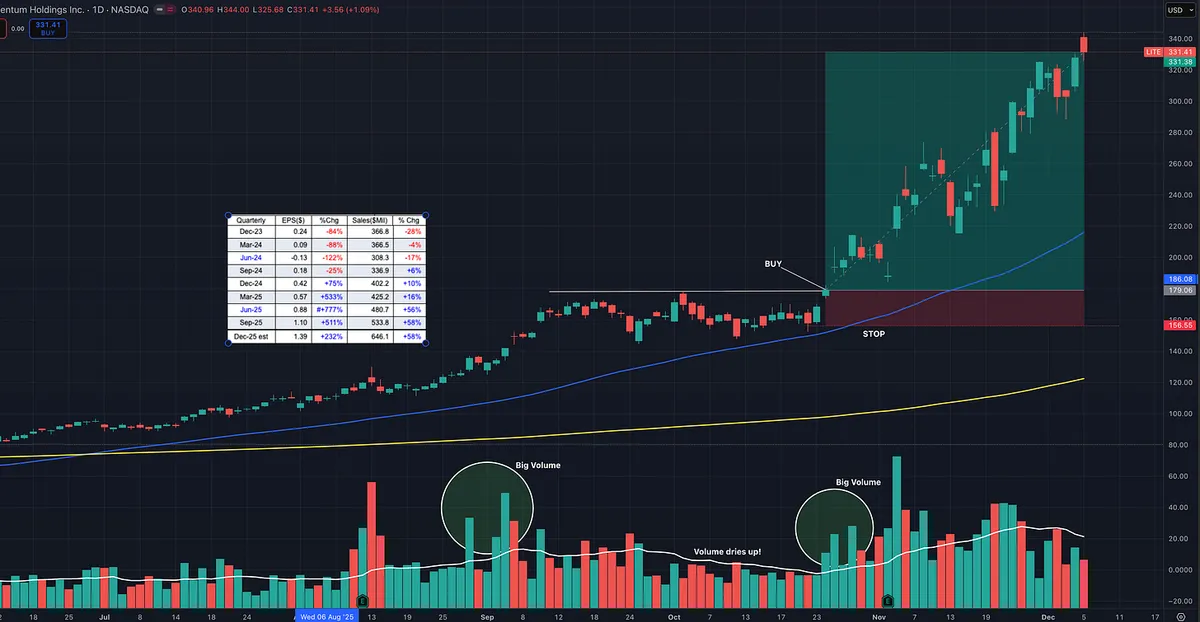
Great example of volume and price analysis with LITE.

LITE was easily spotted on scanners for its Relative Strength performance (RS 99), huge earnings and sales acceleration, and its position in a leading sector and theme. This is exactly what real leadership looks like from a top industry group in telecom and fiber optics.

The setup was a flat base breakout after tight consolidation. Big volume came in on the first move up, followed by controlled consolidation where volume dried up, and then another surge of big volume on the breakout.

The combination of strong fundamentals, clean technical price action, increasing fund ownership, and leadership within its sector created a high quality risk and reward opportunity.