Momentum Trading Strategy

Notes

Short lessons on momentum trading, every day.

Every note from Substack, in one place: risk, setups, leading stocks, market conditions and the mindset behind them. Search them, browse by topic, or filter by stock.

Showing 801–820 of 1226 notes

View on Substack ↗

The Simple Screener That Finds Momentum Breakout Stocks

One of the biggest questions traders ask is:

“How do you actually find these breakout stocks before they move?”

The answer is simpler than most people think.

You start by narrowing the market down to the strongest stocks already showing leadership.

One of the fastest ways to do that is by using a Relative Strength Stock Screener.

This is the same basic idea used by momentum traders like Kristjan Kullamägi when searching for breakout setups.

The Simple Process

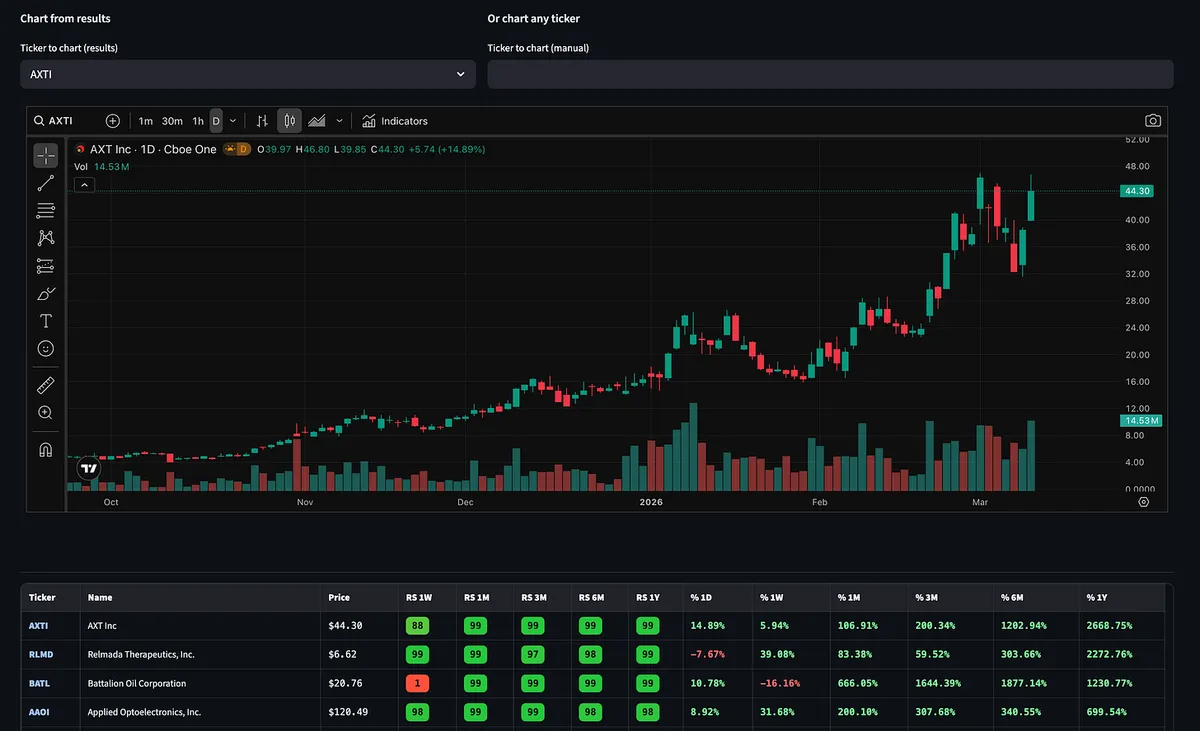
Use a relative strength screener and sort stocks by performance.

Move the rank by timeframe to 1 or 3 months, then set the filter to 98 or higher.

That shows you the top performing ~2% of stocks in the market.

Those are the names you want to study.

Why This Works

Because the biggest winners tend to behave in a very specific way.

As Kristjan explains:

“If you study thousands of the biggest winning stocks over the past 100 years they tend to move in stair steps. Meaning they will make a 20–50%+ move, pull back and go sideways for a while, then make another move.”

That stair-step behavior is where momentum traders find their edge.

A stock makes a strong move. Then it pulls back and consolidates. Then it breaks out again.

Those consolidations are where many of the best breakout setups form.

The key is focusing on stocks that are already proving themselves as leaders.

That’s why scanning for the top 1–2% performers is so powerful.

What to Look For Next

Once you identify leaders, start watching for technical setups such as:

• Tight consolidations

• Volatility contractions

• High tight flags or pennants

• Higher highs and higher lows

• Flat base breakouts

Other patterns that often appear in strong leaders:

• Ascending triangles

• Darvas boxes

• Wedges

• Parabolic curves

And always watch the volume behavior:

• Volume drying up during pullbacks or consolidations

• Heavy volume expansion on breakouts

This is one of the easiest ways to build a watchlist of potential momentum leaders before they make their next move.

In fact, this exact process is how I spotted LITE before it went on to move over 100%.

For Paid Subscribers

For those inside the paid subscription, you already have access to the Relative Strength Screener tool that automatically filters for these types of stocks.

It’s one of the simplest ways to quickly narrow thousands of stocks down to a handful of high-probability breakout candidates, the same type of setups momentum traders like Qullamaggie focus on.

If you're more CANSLIM / position trader focused, you can slightly loosen the relative strength filter and add Sales and Earnings growth to your screen.

Another option is to use the Super Performer preset in the screener, which combines several of those fundamental growth filters.

You’ll find the screener inside the Momentum Trading Strategy section for paid subscribers.
View on Substack ↗

Why Most Traders Lose After a Losing Streak

“When you understand what’s involved in winning, as do professional gamblers, you’ll tend to bet more during a winning streak and less during a losing streak. However, the average person does exactly the opposite: they bet more after a series of losses and less after a series of wins.” — Dr. Van Tharp

This simple idea explains a lot about why most traders struggle.

Professionals understand that performance clusters.

When things are working, it usually means the environment is favorable for their strategy. That’s when they lean in and press their edge.

When things aren’t working, it usually means the market conditions have changed. That’s when professionals reduce risk and protect capital.

But most traders do the opposite.

After a string of losses they start forcing trades, increasing size, and trying to “make it back.”

After a few wins they become cautious, take profits too quickly, or reduce size because they’re afraid of giving gains back.

In other words, they press when they should defend and defend when they should press.

Winning traders flip that behavior.

They stay disciplined during drawdowns and aggressive when their edge is working.

Understanding this shift alone can dramatically change the way you approach risk, position sizing, and consistency in the market.

View on Substack ↗

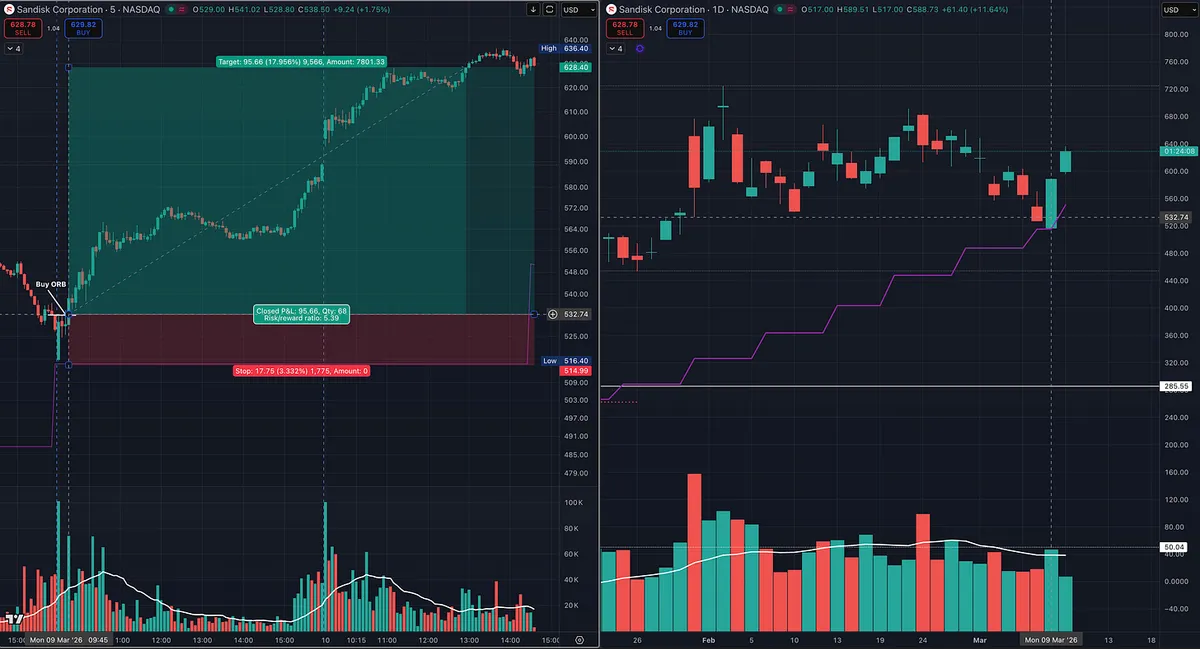
How to Buy Pullbacks in Strong Stocks (SNDK Example)

If you're a swing trader, one of the highest probability opportunities is buying pullbacks in leading stocks.

A good example right now is SNDK.

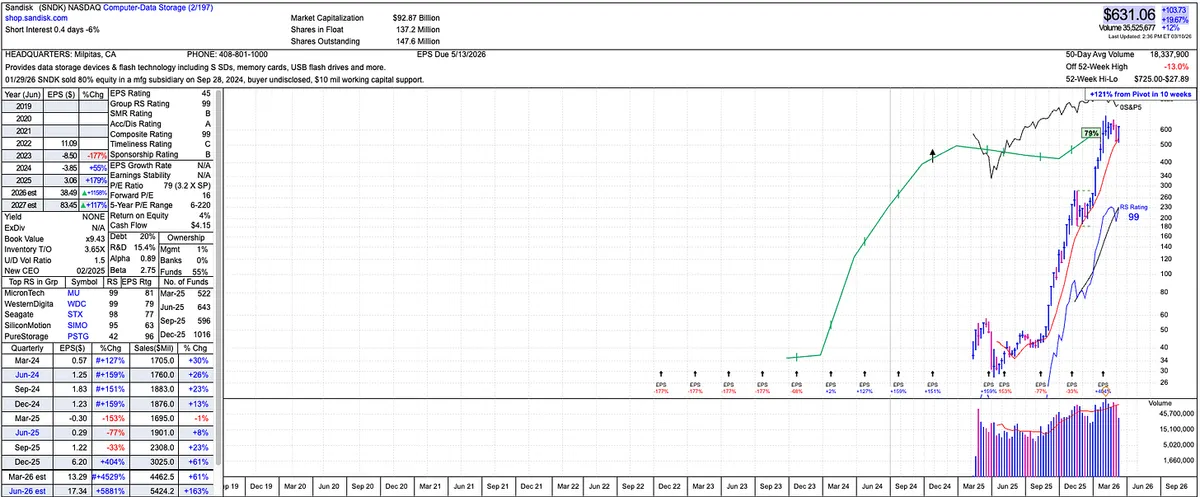
Over the past year SNDK has been a huge winner and it sits inside a very strong industry group: Computer Data Storage. When leadership groups are hot, the best strategy is usually simple.

Don’t argue with the trend. Trade with it.

Looking at the weekly chart, price has repeatedly respected the 10-week moving average, pulling back to support and then continuing higher. When a stock behaves like this, the playbook becomes straightforward:

Wait for the pullback.

Wait for support.

Then look for an entry trigger.

That’s exactly what happened here.

Before the open we saw the overall market approaching the 200-day moving average in futures. When the market found support at that level, strong stocks started to respond.

At the same time SNDK was sitting right on its 10-week support area.

That created the setup.

Instead of guessing, we waited for a tactical entry using an Opening Range Breakout, a strategy popularized by traders like Quallamaggie and Dan Zanger.

The trade was simple:

• Entry: Opening range breakout

• Risk: stop at opening range low ~3%

• Current move: ~18%

That’s roughly 5x the initial risk.

When you get a move like that, you now have choices.

You can:

• Take partial profits into strength

• Move stops higher

• Let the remaining position run

One approach is to sell some shares into strength and let the rest ride, effectively financing the remainder of the trade.

Another important lesson from this example is multi-timeframe analysis.

The weekly and daily charts provide the setup. The daily and intraday charts provide the execution.

This allows you to combine institutional trend structure with tactical entries, which is where many swing traders gain their edge.

And remember something important.

This is not a random small cap or pump-and-dump stock.

SNDK is a true growth name with strong fundamentals and massive forward estimates for earnings and sales growth. Just look at the earnings and sales on the chart!

When growth stocks in leading groups pull back to support, the goal isn’t to predict when the run will end.

It’s simply to take the setup while it works.

Because the truth is, the moment a hot sector pulls back, the commentary always starts:

“It’s extended.” “It’s overvalued.” “The run is over.”

Eventually that will be true.

But guessing when that happens costs traders enormous opportunity.

I was telling our members in the Substack Chat to keep an eye on SNDK and this is exactly why.

With setups like this we can be wrong 70% of the time and still come out ahead.

Instead, a better approach is simple:

Keep taking the setups until they stop working.

View on Substack ↗

The Hard Truth Most Traders Need to Hear

This might sound motivational.

Some people might call it woo-woo.

But after years in this business I can tell you something with certainty.

A huge part of success in trading has nothing to do with charts.

It has to do with what’s going on in your head.

This game will beat you up.

You will take losses.

You will doubt yourself.

You will feel like the market is punching you in the face over and over again.

That stage is normal.

What matters is what you do during it.

Here’s the hard truth many traders don’t want to hear.

A lot of people are sabotaging themselves.

You study.

You read the books.

You know what you should be doing.

But your actions don’t line up with what you’ve learned.

You break your rules.

You chase trades.

You ignore your risk management.

Then you blame the market.

I went through this phase too.

At some point you have to stop feeling sorry for yourself and take responsibility for your results.

Believe you can do this.

If other people have learned this skill, so can you.

But you have to give yourself time.

Most people try for a year, get frustrated, and quit.

There’s a saying that always stuck with me.

People overestimate what they can accomplish in a year.

But they underestimate what they can accomplish in five or ten.

Trading is a skill.

Like any difficult skill, it takes time, mistakes, and persistence.

If you stay disciplined, keep learning from your losses, and stop sabotaging your own progress, you give yourself a real chance.

The traders who make it are rarely the smartest.

They are the ones who simply refuse to quit on themselves.

View on Substack ↗

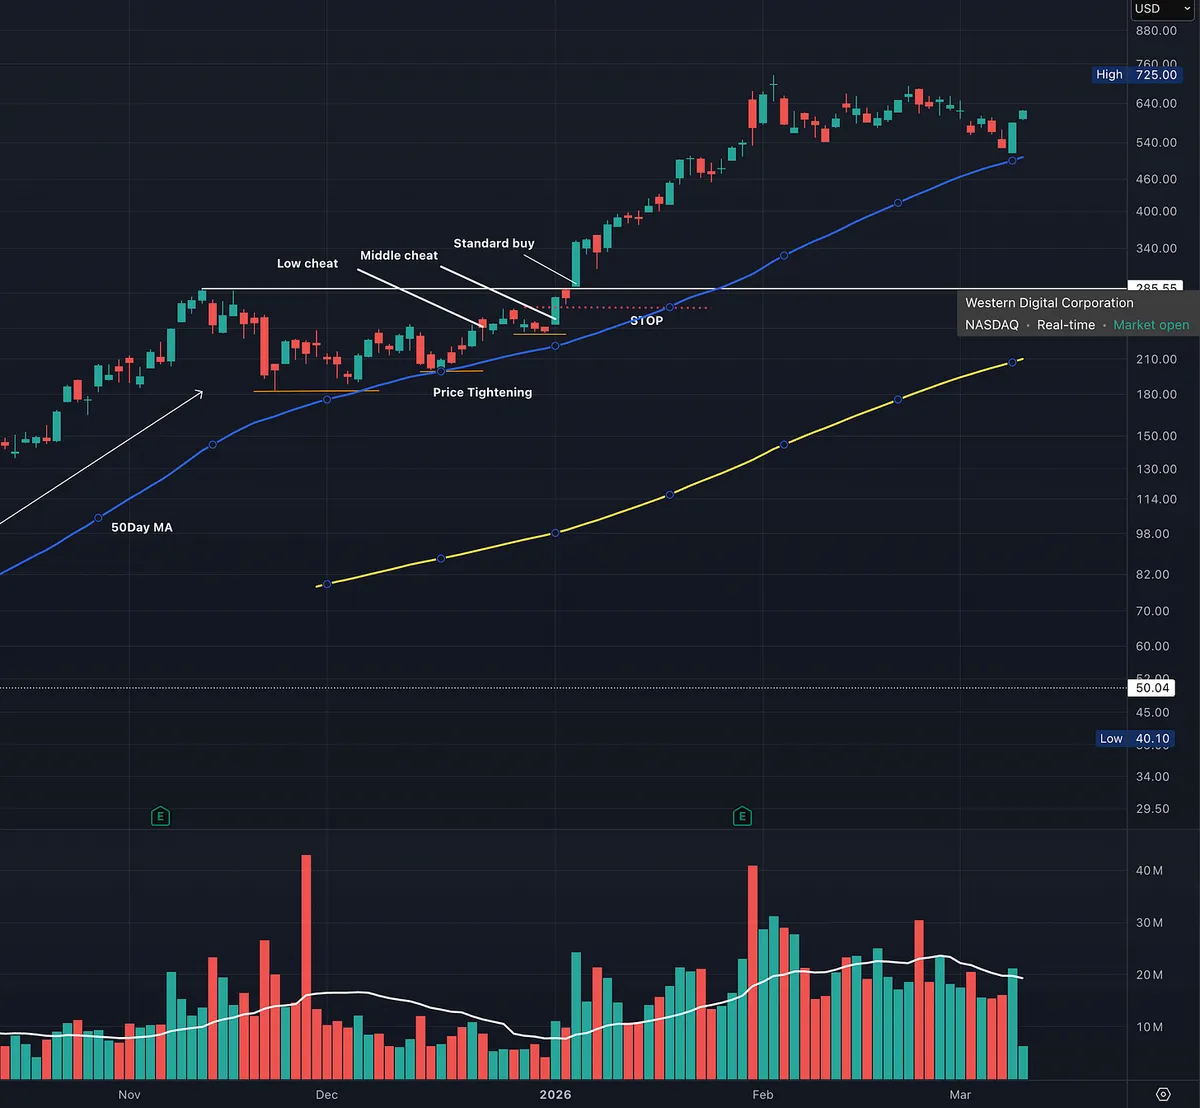
The Low Cheat Entry That Gets You In Before the Breakout

Most traders wait for the obvious breakout.

But some of the best entries happen before the breakout even forms.

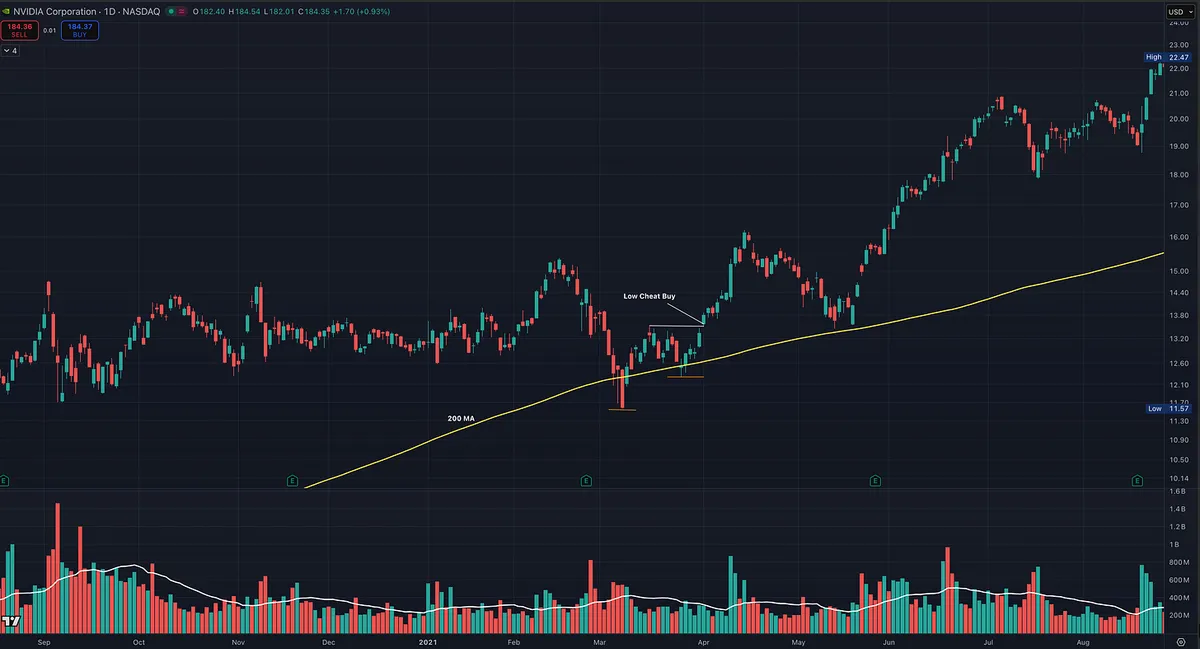
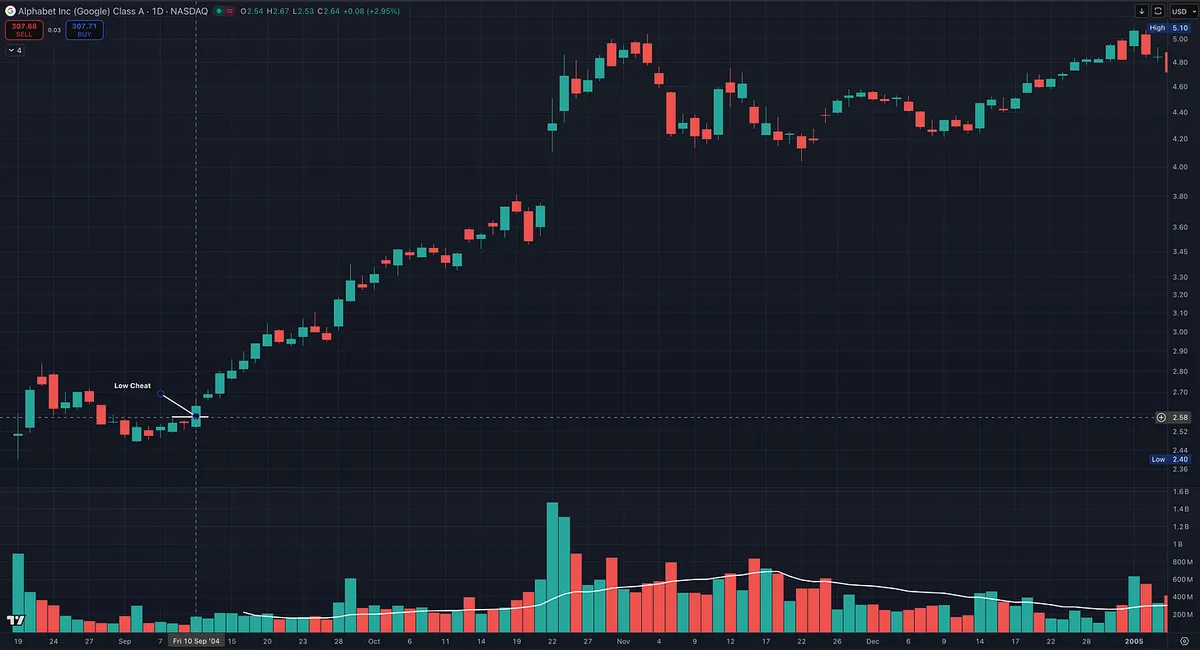
Mark Minervini calls one of these early entries the Low Cheat.

The setup forms in the lower third of a base, which makes it slightly riskier than buying a traditional pivot near the highs.

But the tradeoff is powerful.

You get earlier entry and better risk/reward.

Here’s what the pattern usually looks like:

1️⃣ A strong stock in a Stage 2 uptrend pulls back in an intermediate correction.

2️⃣ Price begins moving up the right side of the base but stalls due to overhead supply.

3️⃣ The stock forms a tight plateau area.

4️⃣ Volume dries up and price tightens. This indicates a selling vacuum, where supply has largely disappeared.

When price pushes above that tight area, the Low Cheat entry triggers.

Two important things about this setup:

• It fails more often than classic breakouts

• But when it works, the reward can be much larger

Why?

Because you are entering before the obvious breakout that everyone else sees.

Minervini often uses the Low Cheat to start a position early, then adds shares later as the stock forms additional pivot points at higher prices.

This allows you to scale into strength instead of chasing it.

The charts attached show examples:

• A Low Cheat during a base

• A Low Cheat after an IPO

• How traders often scale in: Low Cheat → Middle Cheat → Breakout

Notice the common ingredients:

tight price action volume drying up and small shakeouts that remove weak holders before the move begins.

Once you train your eye to see it, the Low Cheat becomes one of the most useful early entries in growth stock trading.

View on Substack ↗

The Best Traders Know When Not to Trade

Some of the greatest traders in history all share the same lesson.

You do not need to trade in every market environment.

“You don’t have to be in the market all the time.” William O’Neil

“Not trading when there was no market movement was, in fact, one of the most important rules of all. No trending market, no profit.” Richard Dennis

“Sometimes your best trades are the ones you don’t make.” Linda Bradford Raschke

“Most people will not wait for the environment to tip itself off. They will walk into the forest when it is still dark, while I wait until it gets light.” Mark Weinstein

“The general market direction is the most important factor in determining whether most stocks will rise or fall.” Stan Weinstein

Different strategies. Different timeframes. Different markets.

But the wisdom is the same.

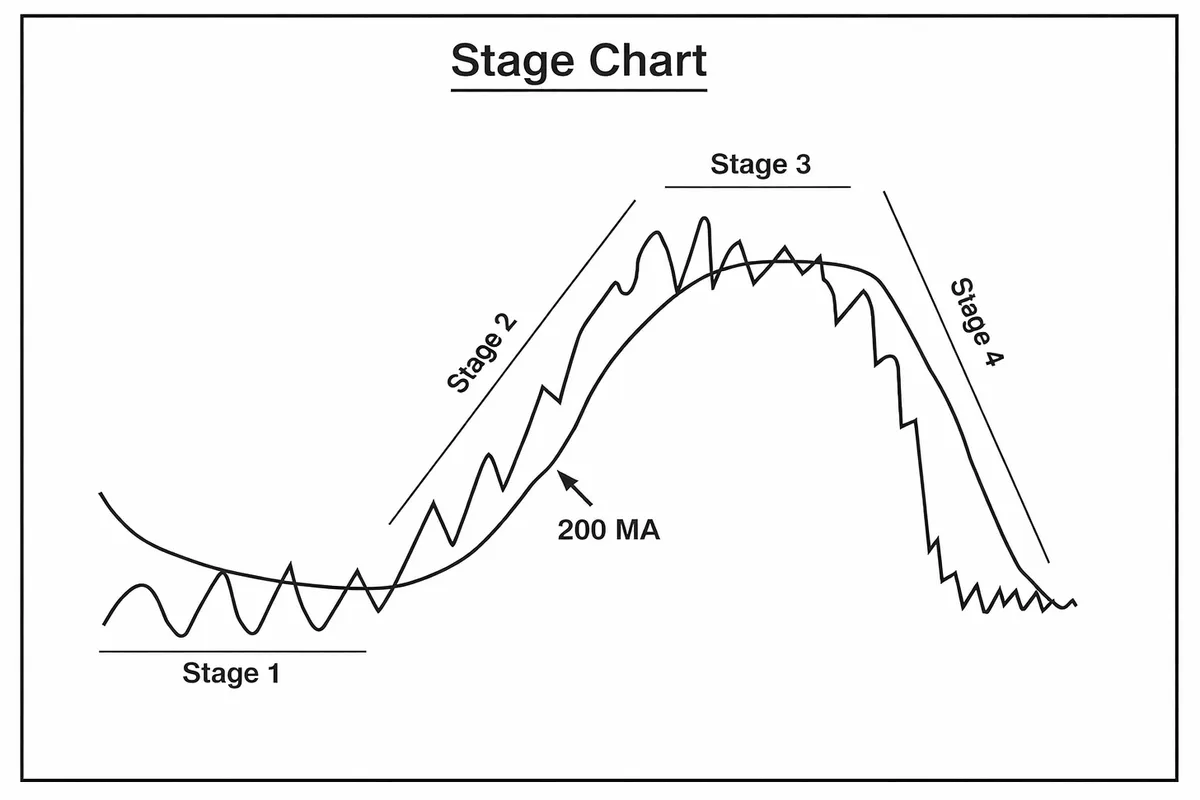
Successful traders understand that environment matters.

More traders lose money by forcing trades in the wrong market conditions than by having poor setups or bad stock selection.

An edge is not constant activity.

The edge comes from recognizing when conditions are favorable for your strategy and having the patience to wait until they are.

Are you trading when you should, or are you trading in the wrong conditions?

Chart below shows how market environments shift through the stages.

View on Substack ↗

You Do Not Need to Trade All Year to Have a Great Year

Many traders believe they need to be active in the market all the time.

In reality, some of the best years come from trading during relatively short windows when conditions are aligned.

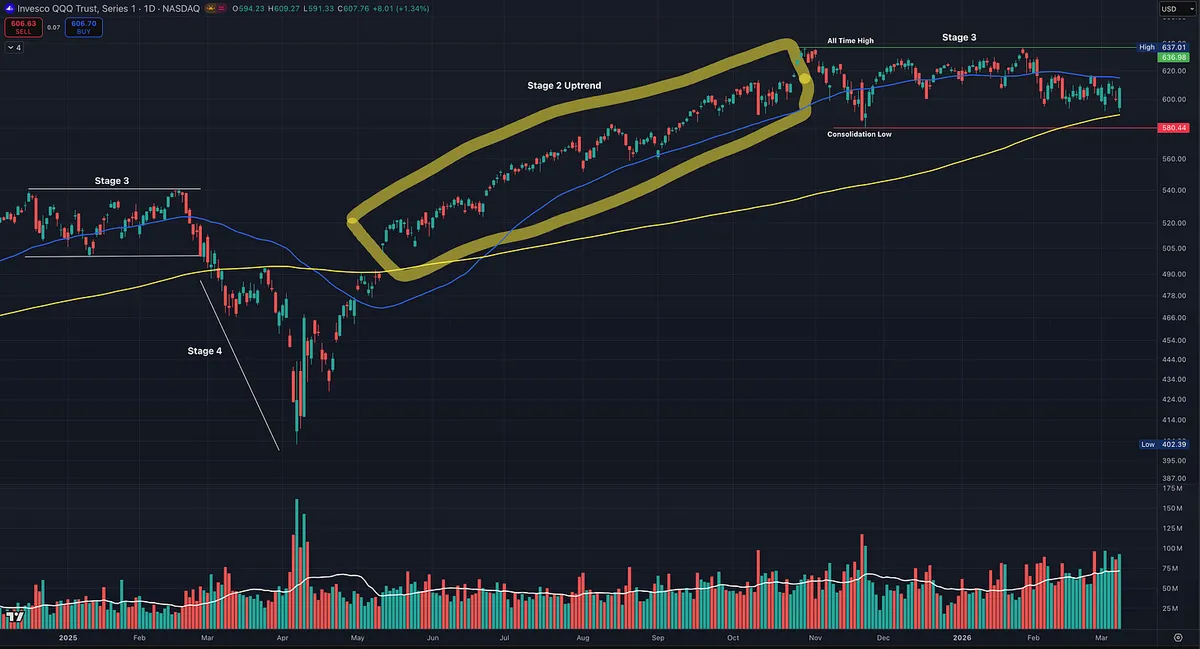
Take 2025 as an example.

At the start of the year, from January through February, the market was already coming off a long advance and entered a Stage 3 consolidation, chopping sideways.

Then in March and April, the market broke down into a Stage 4 decline, falling below the 200 day moving average as volatility spiked during the tariff scare.

But then something important happened.

By late April, the market began stabilizing and we started to see the first signs of a character change, with price forming a higher low and then a higher high.

By May, the market reclaimed both the 50 day and 200 day moving averages, confirming the transition back into a Stage 2 uptrend.

From roughly May through October, the market entered a much healthier environment. The trend was steady, volatility was contained, and pullbacks were relatively controlled. This is the type of environment where growth stock traders tend to perform best.

Then by late October, the market began stalling again and transitioned back into another Stage 3 consolidation.

So if you step back and look at the entire year, the most favorable window for momentum trading was really just May through October.

That means you could have avoided trading during the first several months of the year and stepped aside again once conditions deteriorated later in the year.

The key lesson is simple.

You do not need to trade all year to have a successful year.

As Jesse Livermore famously said:

“The big money is not in the buying and selling, but in the waiting.”

Many of the best traders generate the majority of their returns during relatively short periods when market conditions are aligned.

The edge is not constant activity.

The edge comes from deploying capital when the environment is supportive and stepping aside when it is not.

View on Substack ↗

Trading Strategies Do Not Work in Every Market Environment

Many traders struggle not because they cannot identify strong stocks or quality setups.

They struggle because they trade those setups in the wrong market environment.

In Module 2 of the Momentum Trading Strategy Course, we focus on developing a deeper understanding of market conditions. We discuss when the environment supports momentum and when it does not.

As Dr. Van Tharp explains:

“The common mistake most people make in designing systems is to try to find a system that works in all market conditions. That’s insane.”

Understanding the market environment helps traders align their strategy with conditions and avoid forcing trades when the odds are not in their favor.

Read the full lesson here: https://tradingmomentum.substack.com/p/momentum-trading-strategy-the-100-e6c

On SubstackMomentum Trading Strategy: The 100-Year Playbook Behind the Biggest Winning Stocks — Module 2
View on Substack ↗

The Market Just Hit the 200 Day. Now Comes the Real Test

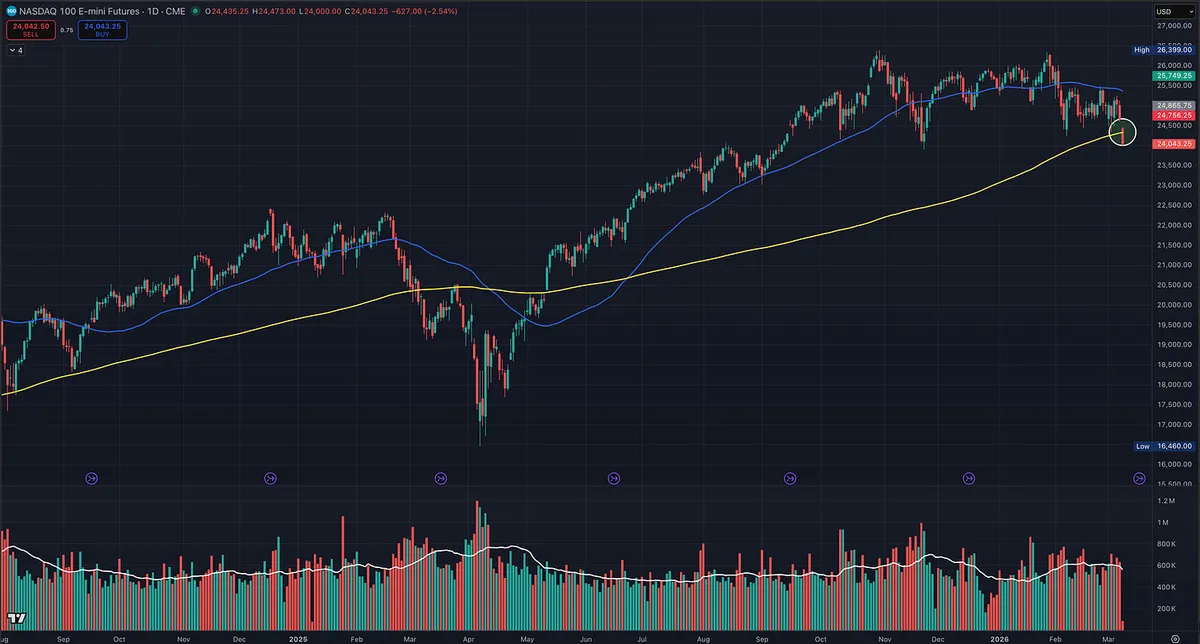
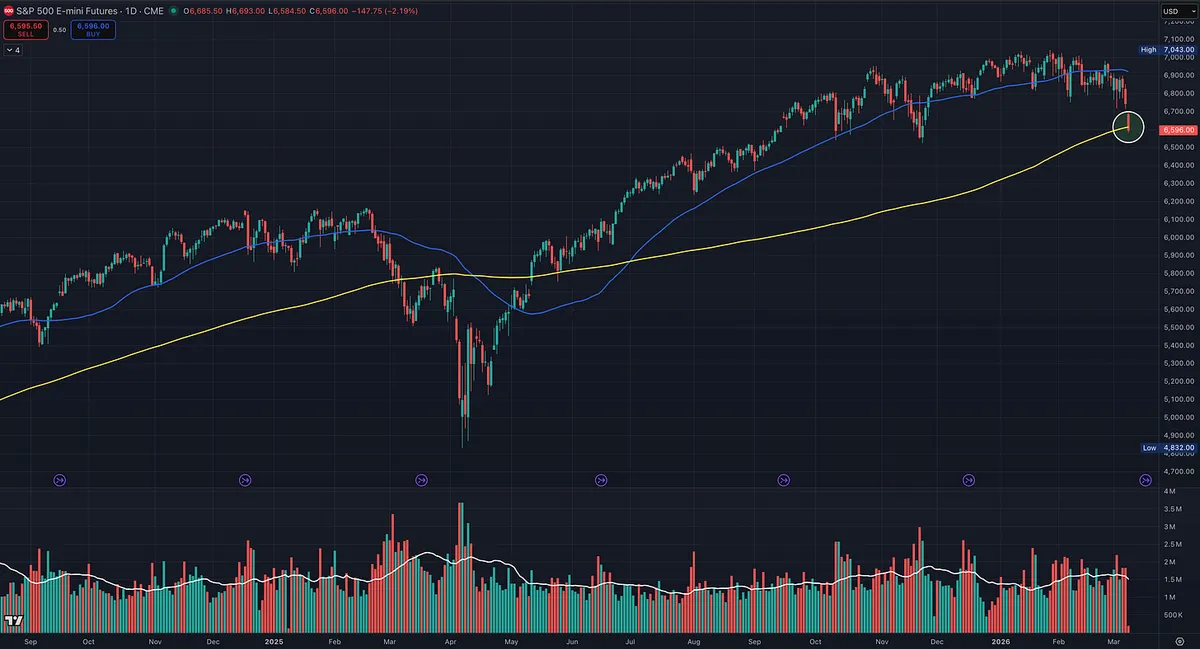
And just like that the market reached a key test

The Nasdaq 100 and S&P 500 futures have pulled back to their 200 day moving averages.

This level is widely watched because it reflects the long term trend institutions follow, but by itself the 200 day line is not a buy or sell signal.

What matters is the price and volume behavior around it.

Right now the market has been showing several caution signals investors should respect.

• A cluster of distribution days, which signals institutional selling

• Weakening market breadth

• Net new lows expanding

The 200 day moving average simply marks an area where the market must prove itself.

If buyers step in and the indexes regain strength, the longer term uptrend can remain intact.

If selling pressure continues and the indexes break lower on heavy volume, it would signal increased market risk and a time to become more defensive.

In other words, the key question is not whether the market touched the 200 day.

The real question is how the market reacts from here.

Historically this is where I have seen support and powerful rallies, and also where I have seen complete failures that led to sharp declines.

As Paul Tudor Jones once said,

“Nothing good happens below the 200 day moving average.”

View on Substack ↗

A Clean Example of an EP + Opening Range Breakout

Had a few people ask questions after the recent post about EP setups and Opening Range Breakouts, so here is another example using RCAT.

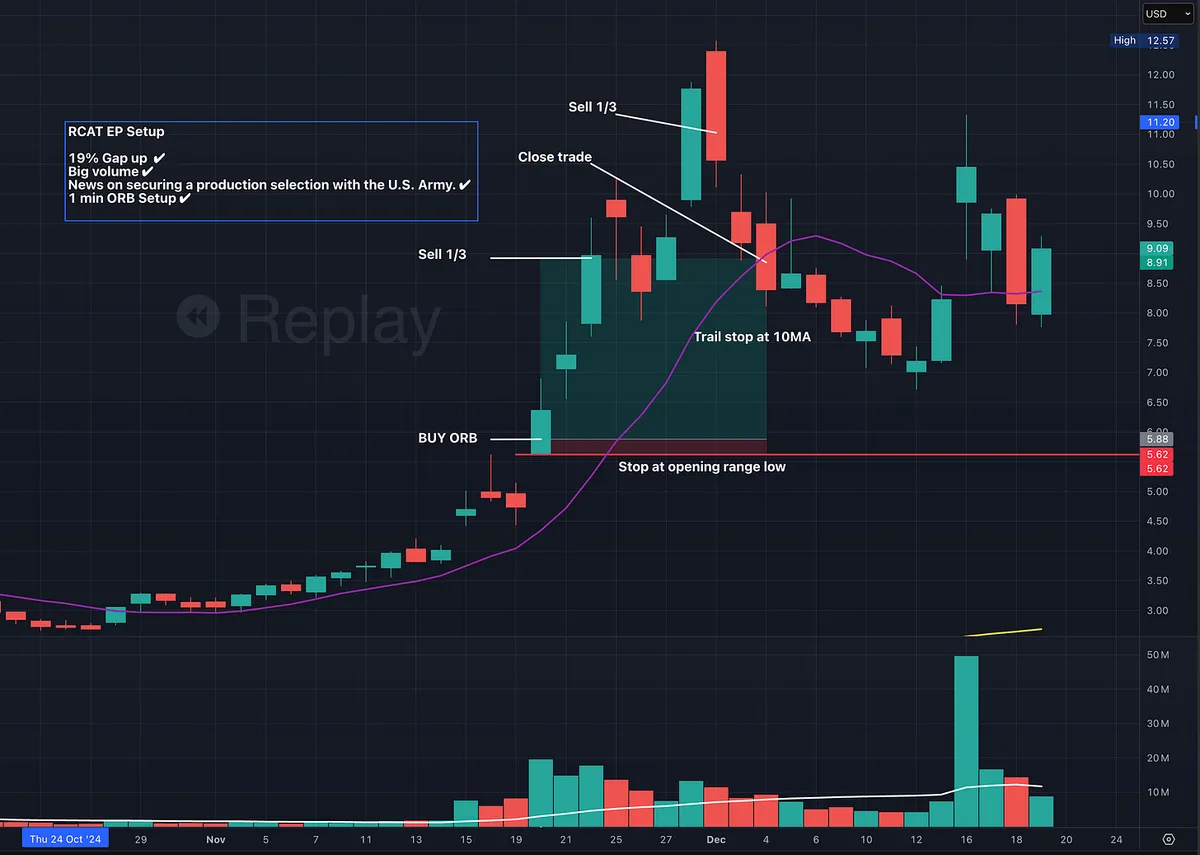
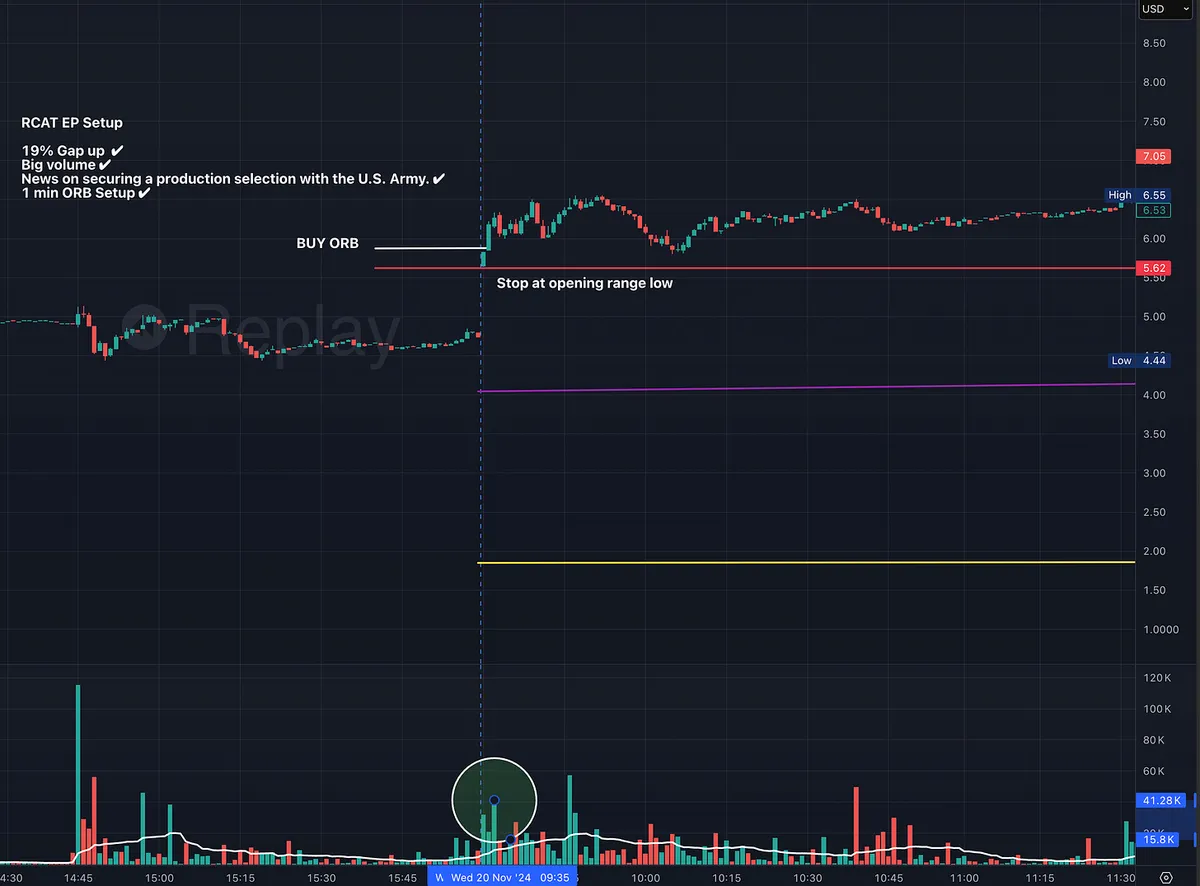
RCAT gapped up 19% after news the night before that the company had secured a production contract with the U.S. Army.

This is exactly the type of catalyst that creates an EP (Event/Earnings Play).

You would typically spot this during your premarket scan, then read the news and build a plan before the open.

The key criteria were all there:

✔ Gap of 10% or more

✔ Huge volume

✔ Major news catalyst

✔ Momentum moving into the open

Because of the massive volume coming in, this was a perfect candidate for a 1-minute Opening Range Breakout (ORB).

The plan is simple.

Enter on the break of the opening range high and place the stop at the opening range low.

From there, the goal is simply to manage the position as the move unfolds.

Both Kristjan Kullamägi and Mark Minervini talk about selling into strength on large momentum moves.

In this example the trade could be managed like this:

• Sell 1/3 into strength after the first strong push

• Sell another 1/3 on a major reversal bar after the extension

• Let the final 1/3 run and trail a stop using the 10 or 20-day moving average

For beginners, Kullamägi often suggests using the 10-day moving average and waiting for a close below it.

This keeps you in the trend while protecting the majority of the move.

In this example:

• First 1/3 captured roughly 11x the initial risk

• Second 1/3 captured roughly 20x the initial risk

• Final 1/3 exited on the 10-day moving average break

This is the power of high momentum EP setups combined with tight initial risk.

The initial stop is small.

But when the move works, the reward can be many multiples of that risk.

And that is exactly what professional momentum traders are trying to achieve.

If you haven’t read the full breakdown of these setups yet, you can read it here: https://tradingmomentum.substack.com/p/the-3-trading-setups-that-turned

ArticleThe 3 Trading Setups That Turned Kristjan Kullamägi From Security Guard to $100M Trader
View on Substack ↗

The Market Is Drifting Toward a Decision Point

Before the trading week begins, it’s important to step back and review the bigger picture.

Major indexes are now drifting toward key support levels near the 200-day moving averages, while last week saw a sharp spike in volatility and a significant deterioration in market breadth. These types of shifts often occur before the market makes its next meaningful move.

In this week’s Big Picture Market Pulse, we break down what the data is telling us right now and the key signals we’re watching for the week ahead.

Read the full report here: https://tradingmomentum.substack.com/p/big-picture-market-pulse-march-8

On SubstackBig Picture Market Pulse | March 8, 2026
View on Substack ↗

What a True Stock Market Winner Looks Like Before the Breakout (Apple 2004)

Just like William O’Neil, Mark Minervini provides countless examples of what we should be hunting for before a breakout and what a true big winner looks like.

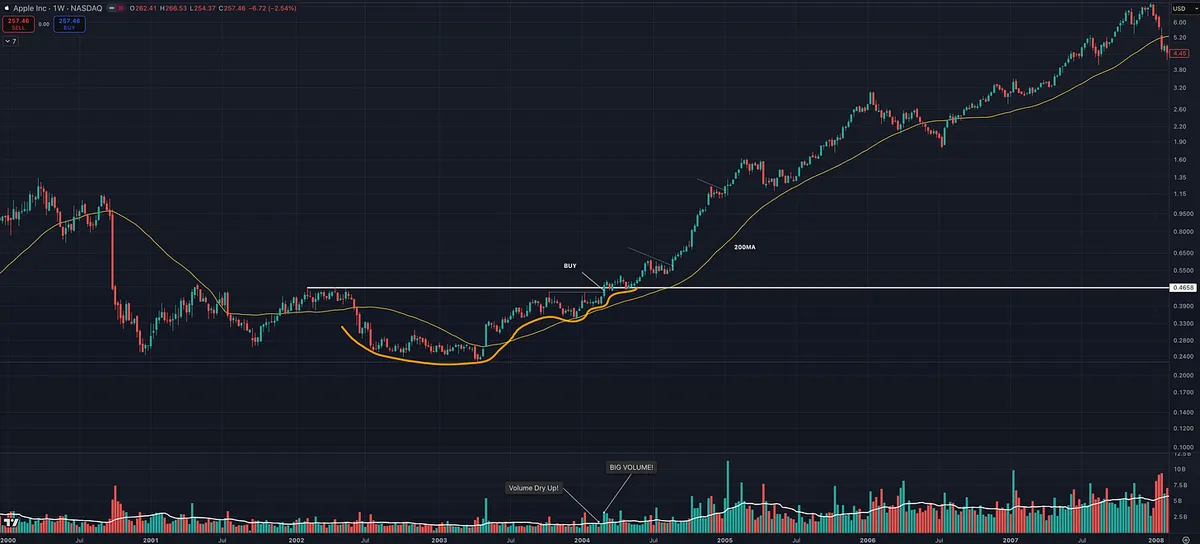
Apple in 2004 is a perfect example.

Coming out of the dot-com bust, Apple was reinventing itself with Steve Jobs driving new innovation, which represents the “N” in CAN SLIM. The company launched the iTunes Music Store in 2003, followed by the explosive success of the iPod, and then the iPod Mini in 2004.

Fundamentally, the story was improving quickly. Apple had returned to positive earnings, rising sales, and increasing future estimates, making it a clear turnaround story.

Now look at the chart.

We see explosive volume off the bottom in 2003, followed by the classic structure of higher highs and higher lows as the stock climbed the right side of the base.

Notice the key characteristics:

• Tight pullbacks on light volume

• Volume drying up near the lows

• Heavy accumulation on the advance

• Big volume expanding as the stock approaches new highs

This type of price and volume action signals institutional accumulation.

When Apple finally breaks out to new highs, it provides exactly what great traders are looking for:

A low-risk, high-reward entry into a potential big winner.

View on Substack ↗

The One Skill That Separates Pros From Amateurs

If you want to become a great trader, read this:

“Although the cheetah is the fastest animal in the world and can catch any animal on the plains, it will wait until it is absolutely sure it can catch its prey. It may hide in the bush for a week waiting for just the right moment. It will wait for a baby antelope, and not just any baby antelope, but preferably one that is also sick or lame. Only then, when there is no chance it can lose its prey, does it attack.

That, to me, is the epitome of professional trading.” -Mark Weinstein

If you’re not getting results, get more selective.

Wait for better market conditions.

Trade the best names, in the strongest industry groups, with the best setups.

Be patient.

Start acting like a cheetah.

View on Substack ↗

Under Trade, Under Trade, Under Trade

“First, I would say that risk management is the most important thing to be well understood. Under trade, under trade, under trade is my second piece of advice. Whatever you think your position ought to be, cut it at least in half. My experience with novice traders is that they trade three to five times too big. They are taking 5 to 10 percent risks on a trade when they should be taking 1 to 2 percent risks.”  -Bruce Kovner

View on Substack ↗

The Most Important Trading Skill Nobody Talks About: Position Sizing

Most traders obsess over finding the perfect entry.

But the truth is, position sizing is what determines whether you survive long enough to compound real gains.

I receive a lot of questions about this because it is rarely discussed in detail in most trading books. There are several ways to position size and manage risk, but here is a very basic example that should help illustrate the concept.

Below is a response I recently sent to a reader.

—

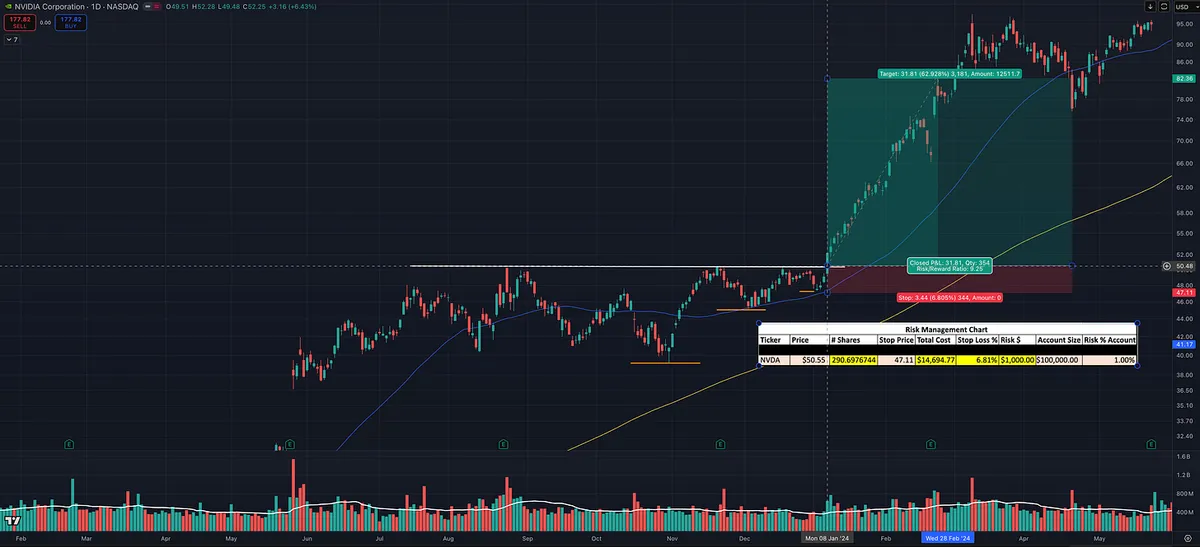
Here’s a simple method I use (see chart).

Let’s say I want to buy a breakout in NVDA at $50.55. I would place my stop at a technical level, right under the previous higher low and near the 50 day moving average at $47.11.

I always base my stop on technical level, not on the percentage I want to lose.

Bruce Kovner said it well in Market Wizards:

“Whenever I enter a position, I have a predetermined stop. That is the only way I can sleep. I know where I’m getting out before I get in. The position size on a trade is determined by the stop, and the stop is determined on a technical basis.”

In this example, the distance from entry ($50.55) to the stop ($47.11) is about 6.81%, which happens to be under the 8% rule that William O’Neil talks about, but that percentage alone does not determine your overall risk.

Once you know your entry and stop, then you determine position size based on how much of your portfolio you are willing to risk.

For example:

If you have a $100,000 account and you only want to risk 1% on the trade, that means you are risking $1,000 total.

With the stop distance in this example, that would equal about 290 shares ($14.6k worth).

Now let’s say you don’t want about $14,600 (14.6% of your account) tied up in this one trade. You could instead calculate position size based on portfolio exposure.

For example:

• If you only want 10% of your account in NVDA, you would buy about 197 shares, risking roughly 0.68% of the account if the stop is hit.

• If you’ve been doing well and want to press harder with 25% of your account, you could take about 494 shares, risking roughly 1.7% of the account if the stop gets hit.

Hopefully that helps.

A lot of people misunderstand the 8% rule from William O’Neil. That rule refers to the distance from entry to the stop, not necessarily the percentage of your total portfolio you are risking on the trade.

View on Substack ↗

The Small Loss Rule

“If you can’t take a small loss, sooner or later you will take the mother of all losses.” — Ed Seykota

This is one of the most important lessons in trading.

The market does not punish you for being wrong.

It punishes you for staying wrong too long.

Small losses are simply the cost of doing business. Every professional trader takes them.

The difference between successful traders and struggling ones is simple:

• Pros cut losses quickly

• Amateurs hope losses come back

Hope is not a strategy.

Capital preservation is.

Take the small loss.

Protect your capital so you can stay in the game long enough to catch the big winners.

View on Substack ↗

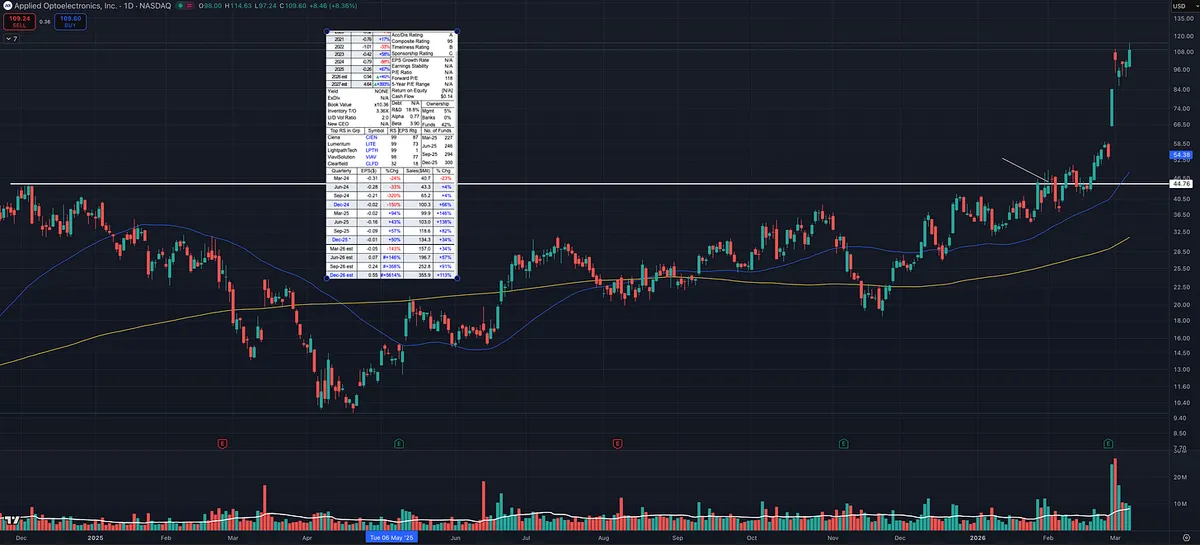
Why I Mentioned AAOI Before Earnings

Someone asked why I mentioned AAOI in early February with earnings coming up.

First, the stock checked several boxes I look for.

It was in a HOT group (telecom) showing strong relative strength across multiple timeframes. I had already seen success with LITE and CIEN, which are in the same space. It reminded me of past industry runs like the computer data storage group when SNDK, MU, WDC, and STX all moved together.

AAOI also had:

• Strong earnings and sales acceleration

• Rising forward estimates

• Accelerating fund ownership

• Tight price action on the right side of the chart

• Trading near new 52 week highs

Since that mention the stock has moved about 150%, but the trade management is the important part.

I normally do NOT buy a stock a few days before earnings. There is too much risk and no time to build a cushion.

I follow the advice from Paul Tudor Jones:

“Never trade in situations where you don’t have control. For example, I don’t risk significant amounts of money in front of key reports, since that is gambling, not trading.”

In this case there were about three weeks before the report, which gave the trade time to work.

From the original buy, the stock moved roughly 30% before earnings.

At that point the plan becomes simple:

• Trim a large portion before the report

• Lock in gains and reduce risk

• Hold a smaller position into earnings

Even great stocks can drop 15–20% overnight on earnings.

By trimming beforehand, the position already has a profit cushion, so the remaining shares carry much less risk.

This is something I learned studying the playbooks of William O’Neil, Mark Minervini, and David Ryan.

The goal isn’t predicting earnings.

The goal is managing risk while letting strong stocks work in your favor.

View on Substack ↗

Standing on the Shoulders of Giants

Isaac Newton once wrote:

"If I have seen further, it is by standing on the shoulders of giants."

Trading works the same way.

William O’Neil studied Jesse Livermore, Gerald Loeb, and the success of the Dreyfus Fund.

Mark Minervini studied O’Neil and Love.

Kristjan Kullamägi studied O’Neil.

Different generations. Different markets.

But the same core foundations.

Price. Volume. Momentum. Supply and demand. Risk management. Human psychology.

Maybe each trader adds their own twist.

But the core ideas are the same ones that have been around for decades.

Which is why the ego and hype in trading can be ridiculous.

Everyone wants to claim they discovered something revolutionary.

Those of us who have been doing this long enough know the truth.

Almost nobody is inventing anything new.

The best traders are simply executing timeless principles better than everyone else.

Study the giants.

Execute the principles.

And maybe, if you are lucky, you leave a small improvement for the next generation.

View on Substack ↗

The Leaders Bottom First

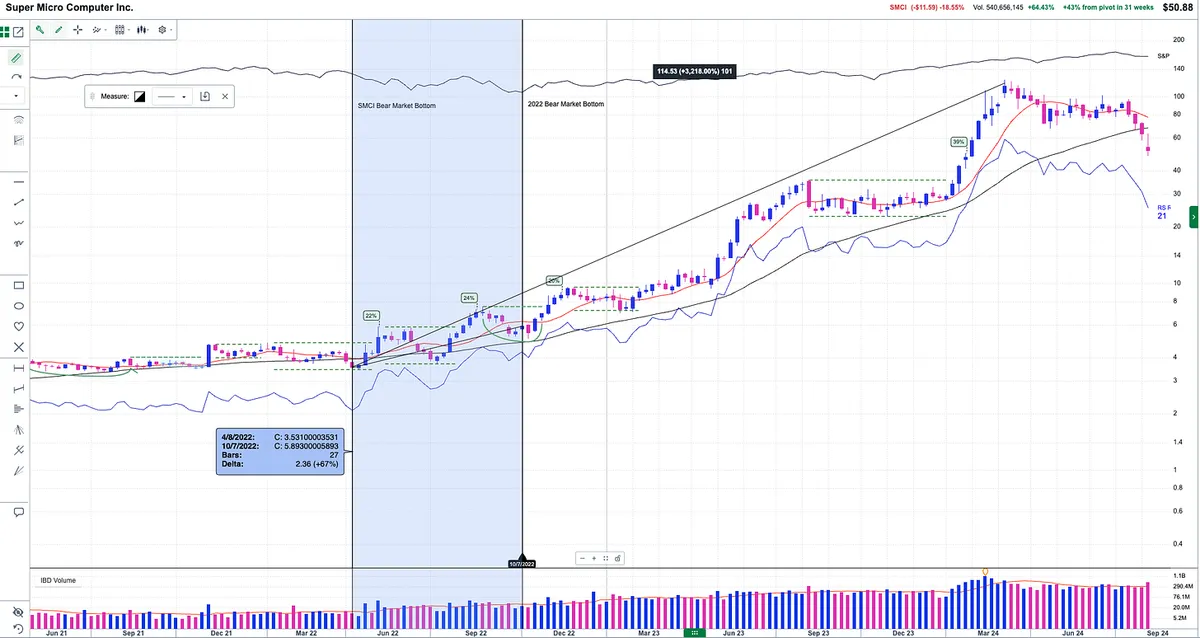
While the market was still falling in 2022, the biggest winner of the next cycle had already turned.

This is exactly what Mark Minervini talks about in Think & Trade Like a Champion. True leaders often bottom before the indexes and start building higher lows while everyone else is focused on the bear market.

Look at SMCI.

• April 2022 — SMCI bottoms

• October 2022 — S&P 500 finally bottoms

During that same period, SMCI had already rallied about 70%.

While the market was still weak, the stock began doing what leaders do:

• Forming higher highs and higher lows

• Holding key moving averages

• Building an ascending base

• Showing a rising relative strength line

By summer 2022, SMCI was already acting like a Stage 2 leader.

The market had not even bottomed yet.

From that early leadership signal to the peak in March 2024, SMCI went on to run over 3,200%.

The lesson is simple.

The next super performer can show itself while the market is still struggling. Pay attention to this. O’Neil highlighted the importance of this too!

Even if you waited until the market showed a clear character change in early 2023 with a confirmed higher low, higher high, and price back above the 200 day moving average, you still could have captured roughly 1,200% of the move from there.

Because the best stocks can tell you where the next bull market is going before the headlines do.