Momentum Trading Strategy

Notes

Short lessons on momentum trading, every day.

Every note from Substack, in one place: risk, setups, leading stocks, market conditions and the mindset behind them. Search them, browse by topic, or filter by stock.

Showing 781–800 of 1226 notes

View on Substack ↗

Most Traders Pick One Side of Market Analysis. The Best Traders Use Both.

I hear a lot of people talk about big-picture macro data, market cycles, interest rates, sentiment, and all the top-down market stuff. But when it comes time to actually pick individual stocks, they struggle.

Then I hear the opposite crowd.

They talk nonstop about stock selection. Breakouts. Chart patterns. Individual companies. But they completely ignore the broader market environment.

Both approaches miss something important.

The edge comes from combining both.

My philosophy is simple.

Top-down analysis plus bottom-up refinement.

Top-down analysis helps us understand the market environment. Every weekend I step back and analyze the market from a big-picture perspective. I want to understand what the overall environment looks like before focusing on individual opportunities.

This idea aligns with William O'Neil's concept of the M in CANSLIM, which emphasizes understanding the market direction before selecting stocks.

It also incorporates ideas from Martin Zweig, author of Winning on Wall Street. Zweig focused heavily on the larger forces that drive bull and bear markets.

Many legendary traders followed Zweig's work. Traders from very different styles including Richard Dennis, Paul Tudor Jones, Michael Marcus, Bruce Kovner, and even short-term momentum trader Marty "The Pit Bull" Schwartz referenced his research.

But top-down analysis alone is not enough.

Traders like Mark Minervini often point out that many times the individual stocks themselves begin to reveal changes in the market before the major indexes do.

Leadership stocks breaking down. Breakouts suddenly failing. Relative strength shifting across sectors.

These signals often show up before the broader indexes reveal what is happening.

That is why bottom-up analysis matters.

By studying individual stocks, sector leadership, and relative strength, we can often detect subtle shifts in the market's character.

Interestingly, this principle exists across every timeframe.

Many professional day trading firms conduct top-down market analysis, even though they trade on intraday charts. Understanding the environment improves their probabilities.

At the same time, swing traders and position traders zoom down into lower timeframes and analyze individual stocks to refine their entries.

In other words:

Day traders zoom out to understand the environment.

Swing traders zoom in to refine execution.

Both directions matter.

The real edge comes from combining both perspectives.

Top-down tells you where the wind is blowing.

Bottom-up helps you pick the fastest sailboat.

Ignore either side and you are trading with incomplete information.

Combine both and you dramatically improve your probabilities.

This is exactly what Module 3 and Module 4 of the Momentum Trading Strategy Course will cover and is free for paid subscribers.

Module 3 covers top-down analysis and the Big Picture Market Pulse.

Module 4 covers bottom-up stock level refinement and identifying the strongest leadership opportunities.

If you haven’t started the course yet, Modules 1 and 2 are already available.
View on Substack ↗

The Market Is Approaching a Critical Inflection Point

The S&P 500 and Nasdaq-100 are now approaching their 200-day moving averages while market breadth continues to deteriorate beneath the surface.

Several areas that had been holding up during this consolidation are now beginning to weaken, and leadership across the market has narrowed dramatically.

In this week’s Big Picture Market Pulse, we break down:

• The critical levels the major indexes are testing

• Why market internals have weakened so quickly

• Where the remaining pockets of strength still exist

• What the next move could mean for traders and investors

This framework follows the philosophy used by William O’Neil, who emphasized that the “M” in CANSLIM, the direction of the overall market, is one of the most important factors for individual stock success. It also incorporates the macro perspective popularized by Martin Zweig, whose work influenced several of the legendary traders featured in Market Wizards.

If you want to stay in tune with what the market is really doing beneath the surface, this report walks through the indexes, breadth, macro signals, and relative strength across sectors and industry groups.

https://tradingmomentum.substack.com/p/big-picture-market-pulse-march-15

On SubstackBig Picture Market Pulse | March 15, 2026
View on Substack ↗

Most traders are learning the market the wrong way.

They start with indicators.

Or tips.

Or someone else’s watchlist.

But if you spend enough time in markets, you eventually realize something important.

Nobody can trade for you.

No one can tell you exactly when to buy. No one can tell you when to sell. And no one can manage your risk except you.

That’s why most traders eventually fail when they rely on tips.

They never build a real process.

The traders who last in this business do something different.

They study the greats who came before them.

Jesse Livermore

William O’Neil

Nicolas Darvas

Mark Minervini

Different decades.

Different markets.

But they were all using variations of the same core momentum principles.

Why?

Because one thing has never changed.

Human behavior.

Fear. Greed. Crowd psychology. Supply and demand.

That’s the foundation of the Momentum Trading Strategy I teach.

A framework built from studying 100 years of the greatest stock market winners and the traders who captured them.

It’s the same system I’ve refined over 20 years in the market trading growth stocks and market leaders.

I finally decided to turn it into a full course.

Inside the course we cover:

  • How to identify true market leaders

  • Understanding market structure

  • The exact setups used by momentum traders

  • Risk management and position sizing

  • Managing winning trades

  • Building a complete trading plan

  • The psychology required to execute it

In other words…

The full playbook behind momentum trading.

Module 1 and Module 2 are already live. Modules 3 and 4 are coming shortly.

Each new module is released to paid subscribers as it’s completed.

If you want to learn the same principles used by the greatest traders over the past century, you can start the course below.

https://tradingmomentum.substack.com/p/momentum-trading-strategy-the-100

On SubstackMomentum Trading Strategy: The 100-Year Playbook Behind the Biggest Winning Stocks
View on Substack ↗

The 4 Rules That Quietly Protect the Best Traders in the World

Everyone wants to talk about how to make big money in stocks.

Almost nobody talks about how the best traders protect their profits.

Mark Minervini explains that the real difference between average traders and superperformers is how they control drawdowns.

One bad year can erase years of progress.

Example:

$100 → +50% = $150 $150 → +50% = $225 $225 → −50% = $112

Three years of work… almost gone.

That’s why great traders focus just as much on defense as offense.

Here are four rules Minervini uses to limit drawdowns.

1. Sell Into Strength

Amateurs get greedy when a stock runs.

Professionals sell when buyers are eager.

Waiting too long often means watching a 30% gain turn into nothing.

Selling into strength keeps your equity curve stair-stepping higher.

2. Trade Small Before You Trade Big

When things are working, increase size.

When things aren’t, scale down immediately.

Most traders do the opposite.

They revenge trade and double down after losses.

Professionals let profits finance larger trades.

3. Always Trade With the Trend

Never fight the market.

Minervini puts it simply:

He never buys falling stocks.

He waits for stocks to turn and move in his direction.

Trading with the trend dramatically increases the probability of success.

4. Protect Breakeven Once You Have a Gain

Once a trade works, protect your capital.

Move your stop up.

Remove the possibility of turning a good trade into a loss.

The goal is simple.

Keep losses small. Protect gains. Let winners do the heavy lifting.

Superperformance isn’t just about finding big winners.

It’s about making sure one mistake never destroys months of progress.

View on Substack ↗

The Real Secret to Winning Big in the Stock Market

Most traders think success comes from being right most of the time.

It doesn’t.

In fact, trying to be right all the time is what destroys many accounts.

William O’Neil said it best:

“The whole secret to winning big in the stock market is not to be right all the time, but to lose the least amount possible when you’re wrong.”

Great traders understand this.

They don’t try to avoid losses.

They control them.

Small losses are simply the cost of doing business.

Because when you keep losses small, something powerful happens.

Just a few big winners can more than make up for many small mistakes.

That’s the math behind superperformance.

Cut losses quickly.

Let winners grow.

And remember.

You don’t need to be right all the time.

You just need to make sure that when you’re wrong, it doesn’t hurt much.

View on Substack ↗

Stop Letting Big Winners Turn Into Small Winners

Minervini’s “Breakeven or Better” Rule

One of the biggest mistakes traders make is this.

They finally catch a big winner…

Then they watch half the profit disappear because they never adjusted their stop.

Mark Minervini teaches a simple rule to prevent this.

Breakeven or Better.

Here’s how it works.

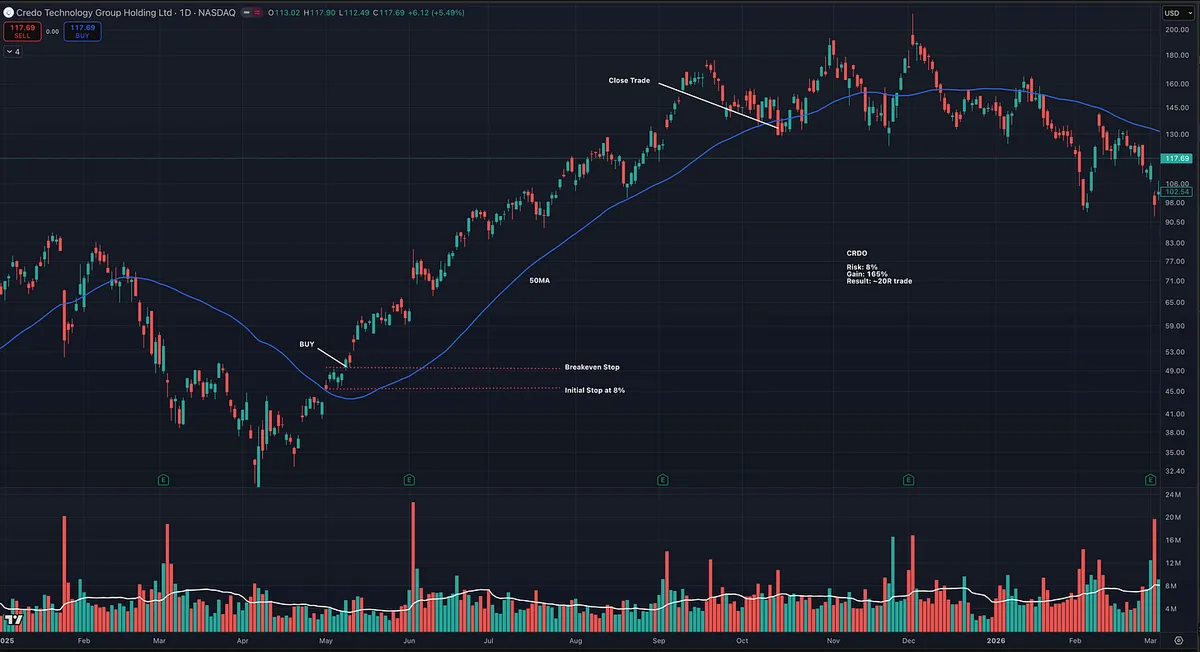
Let’s say you buy a stock at $50 coming out of a base.

You set your initial stop 8% lower at $46 to control risk.

Now the trade begins to work.

The stock moves 8%… then 16%… then 24% higher.

While price is rising, something important is happening behind the scenes.

The 50-day moving average is rising too.

Eventually the 50-day line catches up to your breakeven price of $50.

At that moment the trade changes.

Your stop is no longer the original stop.

Your stop now becomes the 50-day moving average.

From that point forward the rule becomes simple.

Breakeven or Better.

Many traders will wait for a close below the 50-day before exiting.

Some even watch how the stock closes by the end of the week to avoid getting shaken out.

The key idea is this.

The 50-day moving average becomes your trailing stop.

It rises with the trend and protects your profits while still giving the stock room to move.

The chart below shows an example using CRDO.

Initial risk: 8% Total gain captured: 165%

That’s roughly a 20R trade.

This is how traders stay in large multi-month winners without giving everything back.

The goal is not to sell the exact top.

The goal is simple.

Never let a good gain turn into a loss.

View on Substack ↗

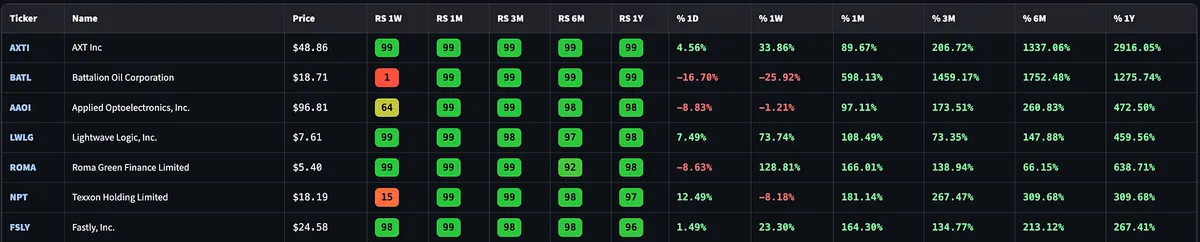
Sometimes the easiest way to find winning stocks is Relative Strength

One of the simplest things I do regularly is run a Relative Strength screener.

Not complicated.

Just looking for stocks that are outperforming the market across multiple timeframes.

When a stock shows up with RS near the top across the board, it’s usually telling you something important.

Institutions are accumulating it.

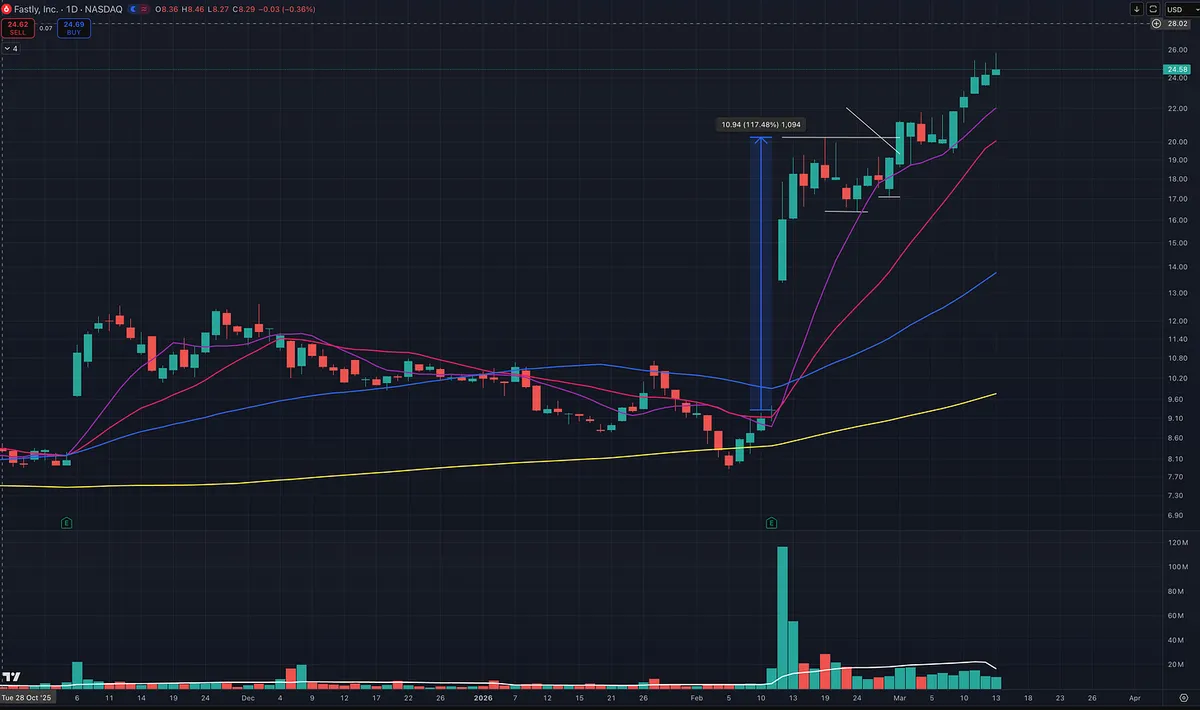
A recent example was FSLY.

After a big earnings gap on heavy volume, it immediately showed up on the RS screener and went on watch.

When you see a move like that, the playbook is pretty simple.

Wait for the stock to tighten up and look for a continuation move.

That’s exactly what happened.

The stock consolidated after the earnings gap and found support at the 10-day moving average, which is often where strong momentum names defend during powerful trends.

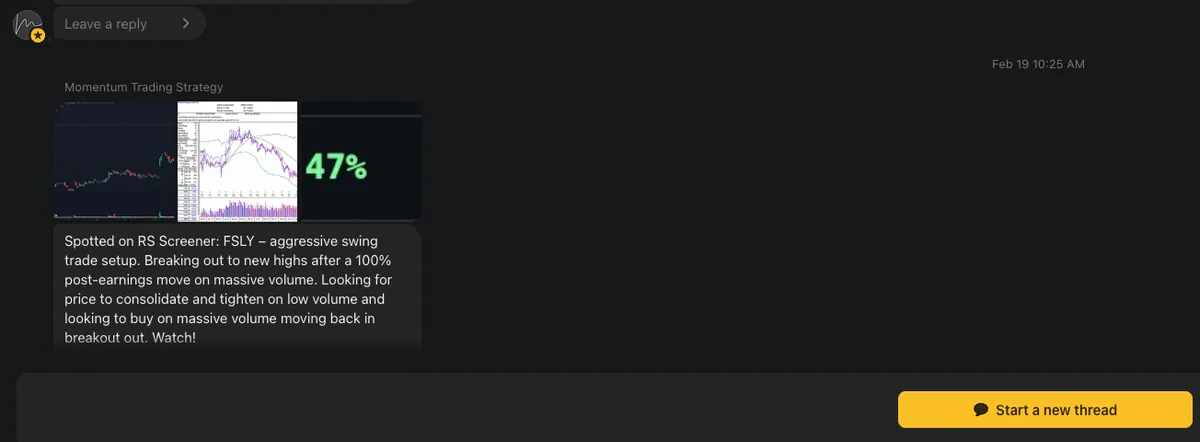
From the time it was mentioned in the subscriber chat back in February, the stock has continued to show strength and is now up more than 35%.

This type of move is very similar to what traders like Kristjan Kullamägi call an Episodic Pivot.

A major catalyst hits. The stock gaps up on huge volume. Then strong relative strength keeps it near highs.

Often the next opportunity comes when the stock tightens up and continues higher.

You don’t need complex indicators or screens.

Many times the big winners are simply the stocks already showing the most strength.

That’s exactly what Relative Strength helps you find.

View on Substack ↗

The Back StopHow to Protect Profits Without Killing a Big Winner

Most traders understand the first stop.

You enter a trade and define your risk.

Example.

You buy a stock at $100 and place a 5% stop at $95.

That protects you if the trade fails.

But what happens when the trade works?

Let’s say the stock suddenly gaps higher to $130.

Now you are sitting on a 30% gain.

At this point many traders make one of two mistakes.

They either sell too early.

Or they tighten their stop too much and get shaken out of a strong trend.

This is where the Back Stop comes in.

A back stop is a profit protection stop.

Instead of trailing the price tick by tick, you decide how much profit you are willing to give back.

You draw a line in the sand.

For example.

If the stock gaps from $100 to $130, you might place a back stop around $120.

Now several things are true.

You have locked in a 20% gain.

The stock still has room to fluctuate.

And if momentum continues, you stay in the move.

Of course, the stop location should also make sense technically.

In real trading you would usually place that stop under a key level, such as a higher low, support area, or important moving average.

So the exact price may not always match the example percentages.

The key idea is protecting a meaningful portion of the gain while still allowing the stock room to trend.

The key difference is this.

A trailing stop follows the price closely.

A back stop protects a meaningful profit level.

As the stock continues higher, you can move that line up.

Maybe the stock runs to $150.

Now you raise your back stop to $135 or $140.

Each adjustment protects more profit while still giving the stock room to trend.

This is one of the tools experienced traders use to stay in big winning stocks longer.

The goal is simple.

Protect the gains.

But do not suffocate the trade.

View on Substack ↗

One of the most powerful trading ideas I’ve ever seen comes from Ed Seykota.

He called it the “discrepancy report.”

Here’s the idea. 

You build a trading system with clear rules: 

• entries 

• position sizing 

• risk management 

• exits 

Then you compare two things every day. 

  1. What your system said to do.

  2. What you actually did.

The difference between those two is the discrepancy report.

And that report tells you everything you need to know about your trading. 

Did you skip valid trades? 

Did you chase something not in your system? 

Did you hold a loser longer than your rules allow? 

Did you size bigger than your plan? 

If there is no discrepancy, you followed your system. 

If there is a discrepancy, you didn’t. 

Ed Seykota’s point was simple: 

When traders see discrepancies, they have two options. 

  1. Improve the system. 

  2. Improve themselves. 

Most traders choose a third option. 

They ignore the discrepancy. 

But that gap between what you planned and what you actually did is where almost every trading problem lives. 

Not in the strategy. 

In the execution.

View on Substack ↗

The Free Roll StrategyHow Smart Traders Remove Risk While Keeping the Upside

One of the best feelings in trading is when a position becomes a free roll.

That’s the moment when the trade can still go much higher, but your downside risk is essentially gone.

Here’s how it works.

You enter a trade and set a stop.

Example.

You buy a stock with a 6% stop.

The trade works and the stock quickly moves 20% higher.

Now you have options.

A common strategy used by experienced traders is simple.

Sell half the position.

Then move your stop on the remaining shares to breakeven.

At that moment something powerful happens.

You are now free rolling the trade.

The worst case outcome on the remaining shares is break even.

But you already locked in a profit on the first half.

The psychological pressure disappears.

You are no longer defending the trade.

You are simply letting it work.

There is another variation some traders use.

Sell half of the position and keep the original stop on the remaining shares.

Now the profit from the first half is financing the risk on the second half.

The trade has effectively paid for itself.

This is why experienced traders love the free roll.

It allows you to stay in a potential big winner without the constant fear of giving everything back.

And sometimes…

The back half becomes the trade that makes your entire month, quarter or year.

View on Substack ↗

The 4 Rules That Separate Average Investors From Superperformers

Most people are taught the wrong things about the stock market.

Turn on financial TV and you will hear the same advice repeated over and over:

You cannot time the market. Diversify widely. Buy and hold. Trade less.

But traders who achieve true superperformance do something very different.

Mark Minervini laid out four key principles that helped him turn a small account into millions and win the U.S. Investing Championship.

Here they are.

1. Yes, You Can Time the Market

Most experts say market timing is impossible.

Yet every great trader times the market.

Not by predicting the future.

By waiting for specific conditions and precise setups.

When the odds are in your favor, you act.

When they are not, you stay out.

Timing is everything because asymmetric opportunities require precision.

2. Overdiversification Kills Performance

Owning too many stocks dilutes your results.

If you want broad diversification, you might as well just buy an index ETF like SPY or QQQ.

Great traders focus on a small number of high-conviction opportunities.

Concentration is what allows a big winner to actually move your portfolio.

3. Turnover Is an Advantage

Wall Street funds often hold positions for long periods.

Not because it is optimal.

Because they have billions to manage.

Individual traders have a massive advantage.

You can enter quickly. You can exit quickly. You can move capital to the best opportunities.

Flexibility is one of your greatest edges.

4. Always Demand Asymmetric Risk vs Reward

Superperformance comes from repeatedly taking trades where the potential reward greatly outweighs the risk.

Small losses are part of the process.

The goal is simple.

Lose small. Win big.

A trading system built around low risk entries and large upside potential allows a few big winners to drive your results.

Most investors try to be right most of the time.

Great traders focus on making sure their winners are much bigger than their losers.

That is how superperformance is built.

View on Substack ↗

One of the most brutally honest quotes ever said about trading

Ed Seykota once said:

“Win or lose, everybody gets what they want out of the market. Some people seem to like to lose, so they win by losing money.”

At first that sounds ridiculous.

Why would anyone want to lose?

But if you have spent enough time trading… you start to realize how true it is.

Some traders say they want to be profitable.

Yet their behavior says something very different.

They refuse to cut losses. They chase trades from FOMO. They oversize positions trying to get rich quickly. They abandon their system after a few losses. They break rules because they got away with it last time.

Consciously they want profits.

But subconsciously they want something else.

Excitement. Validation. Action. Being right. Hope.

The market gives people exactly what their behavior demands.

That is why this quote is so powerful.

It forces traders to ask a very uncomfortable question:

What do I actually want from the market?

Because if your behavior does not change…

Your results will not either.

And most traders do not need another strategy.

They need the discipline to execute the one they already have.

View on Substack ↗

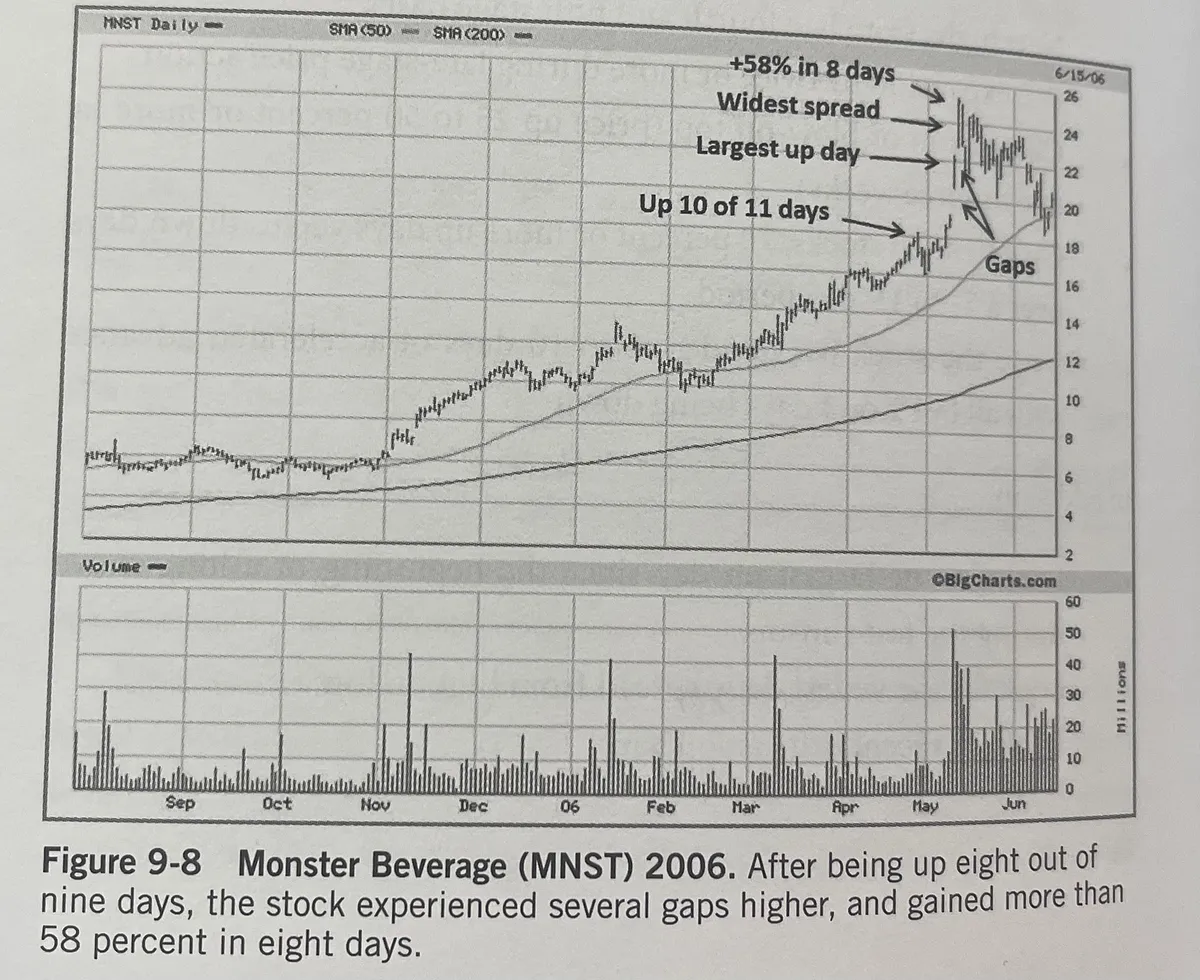
When a stock gets extended, start looking for signs of exhaustion.

Minervini talks about this when discussing selling into strength during late-stage runs.

Here’s a quick checklist I use when a stock has gone vertical:

Reversal / exhaustion signals

• 70% or more up days over a 7–15 day period

• 6–10 days of rapid advance with only 2–3 down days

• Climax move (price up 25–50% in 1–3 weeks)

• Largest up day of the entire move appears late

• Widest daily spread from high to low

• Multiple gap-ups during the run

Volume warnings

• Heaviest volume of the move on a down day

• High-volume reversal near highs

• Heavy volume but little price progress (churning)

The key idea: institutions usually distribute on the way up while everything still looks great.

By the time weakness is obvious, the move is often already over.

Example below from Minervini showing MNST running +58% in just 8 days before topping.

View on Substack ↗

The Easiest Edge Most Traders Ignore 

If you do not know what is making new highs, you do not know where money is flowing. 

It is that simple. 

William O’Neil built his entire career around this idea: 

The biggest winners were near new highs before they made their biggest moves. 

Not near 52 week lows.  Not “cheap.”  Not “oversold.” 

Near new highs. 

Why? 

Because strength is not random. 

Stocks making new highs are under accumulation. 

Institutions are stepping in.  Supply is being absorbed.  Demand is overwhelming resistance. 

The new high list is not a list of stocks that are extended. 

It is a list of leadership. 

When you screen properly and review new highs daily, three things happen: 

  1. You start to see themes before the crowd does. 

  2. You recognize which sectors are actually leading. 

  3. You train your eye to focus on strength instead of weakness. 

Most traders waste hours scanning broken charts. 

Professionals scan for relative strength. 

You do not need to predict the next leader. 

You need to study the current ones. 

In strong markets, the new highs list expands. 

In weak markets, it shrinks. This is why I track it every week on my Big Picture Market Pulse.

That alone tells you more about conditions than most headlines ever will. 

If you want to trade like a professional, make this a daily habit: 

Run your screens.  Study the new highs.  Mark the tight ones.  Build a watchlist. 

Leadership leaves footprints. 

Your job is to follow them.

View on Substack ↗

The Turkey Trap Every Investor Falls Into

Right after posting about the importance of having sell rules, it reminded me of a famous story told by William O’Neil in How to Make Money in Stocks.

It perfectly captures the psychology most investors experience when it’s time to sell.

O’Neil retells a story from Fred C. Kelly about an old man trying to catch wild turkeys.

He built a simple turkey trap.

A big wooden box with a door propped open by a stick. A string ran from the stick back to the trapper sitting far away. Corn was scattered along a path leading inside the box.

The turkeys would follow the trail of corn into the trap.

Once enough birds were inside, the trapper could pull the string and the door would slam shut.

One day he had twelve turkeys inside the trap.

But then one wandered out.

“Gosh,” the trapper said, “I wish I had pulled the string when all twelve were in there. I’ll wait a minute. Maybe that one will come back.”

While he waited… two more turkeys walked out.

“I should have been satisfied with eleven,” he said. “As soon as I get one more back, I’ll pull the string.”

But more turkeys kept leaving.

Soon there were only eight.

Then five.

Then two.

Finally, there was just one turkey left.

The trapper said, “I’ll wait until he walks out or another one walks in, and then I’ll quit.”

The last turkey walked out.

The trap was empty.

He went home with nothing.

O’Neil said the psychology of investors is not much different.

When we have a good profit, we often wait for just a little more.

Then the stock pulls back.

So we wait for it to recover.

Then it pulls back more.

And before long the big winner we once had… disappears.

This is exactly why sell rules matter so much.

It’s something Mark Minervini talks about as well in Think and Trade Like a Champion. Early in his career he spent years learning how to buy great stocks, but realized later there was a huge gap in his trading plan.

He had no clear rules for how to sell a profitable position.

And that gap is where a lot of traders lose their biggest opportunities.

Because the market doesn’t reward hope.

It rewards discipline and rules.

So here’s the question.

How many of you have experienced your own version of the turkey story?

View on Substack ↗

Why Most Traders Never Cash In on Big Winners

Scroll through trading social media for five minutes and you'll notice something.

Almost every post is about what to buy next.

The next AI stock. The next biotech breakout. The next “100x opportunity.”

Charts. Price targets. Long threads explaining why a company is about to explode.

I am guilty of this too.

But there’s one problem.

Almost nobody talks about how to sell.

And that’s exactly why most traders never capitalize on their biggest winners.

Mark Minervini wrote about this in Think and Trade Like a Champion when discussing profit taking. Early in his career he spent enormous time learning how to pick stocks and when to buy them.

Fundamental analysis.

Technical analysis.

Finding the right setups.

Eventually he developed real confidence in his stock selection.

Then he discovered a huge hole in his trading plan.

He had no real plan for how to sell profitable positions.

And that realization hits many traders the same way.

At first the focus is always:

How do I find the next big winner?

But once the trade works, a completely different problem appears.

• Should you take profits?

• Should you hold?

• Should you add?

• Should you scale out?

Most traders freeze in that moment.

They either:

• Sell too early and miss the big move

or

• Hold too long and give the gains back

Meanwhile the analysts who convinced them to buy are still posting price targets that rarely play out exactly as predicted.

That’s the reality of markets.

No analyst knows exactly how far a stock will go.

Which means trading is not just about finding winners.

It’s about knowing how to manage them once you have them.

Learning when to lock in profits.

Learning when to let a true leader run.

Learning how to scale out of strength without killing your upside.

Those are the skills that turn a good trade into a career-making one.

Finding a great stock is only half the battle.

Knowing how to sell is where the real money is made.

View on Substack ↗

Mark Minervini’s Position Sizing Guidelines

One of the biggest differences between amateur traders and professionals is how they manage risk and position size.

Many traders focus entirely on finding the right stock.

But traders like Mark Minervini emphasize that position sizing and risk control are just as important as stock selection.

In Think and Trade Like a Champion, Minervini outlines several practical guidelines for managing position size and portfolio risk.

Here are the key principles.

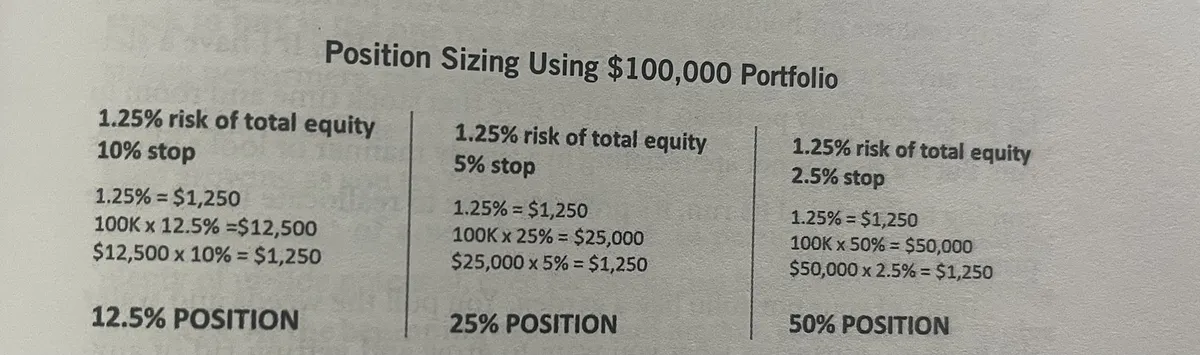
Risk Per Trade

Minervini typically risks about:

1.25% – 2.5% of total equity per trade

This means if a trade hits your stop, the total loss should only represent a small percentage of your overall portfolio.

This approach keeps a string of losing trades from doing serious damage to your capital.

Maximum Stop Size

Stops should generally not exceed about 10%.

However, in most cases Minervini notes that average losses should be closer to 5–6%.

Keeping losses small is critical because it allows you to stay in the game long enough to catch the big winners.

Position Size Limits

Even in strong conviction trades, Minervini avoids excessive concentration.

His guidelines include:

• Never take a position larger than 50% of the portfolio

• Ideal position size in top ideas: 20–25%

This allows a trader to press their best ideas while still maintaining diversification.

Number of Positions

Minervini also keeps the number of positions relatively focused.

Typical portfolio structure:

• 10–12 positions for individual traders

• 16–20 positions for larger professional portfolios

This ensures that the portfolio is concentrated enough to benefit from winners, but not so concentrated that one mistake causes major damage.

The Bigger Lesson

The real takeaway from these guidelines is simple.

Successful traders don’t just focus on what to buy.

They also focus heavily on:

• How much to buy

• How much to risk

• How many positions to hold

Because in the end, position sizing is how you survive long enough to generate super performance.

View on Substack ↗

The High Tight Flag: A Rare Pattern from O’Neil That Minervini Calls the Power Play

One of the most explosive setups in growth stock trading is the High Tight Flag.

This pattern was originally described by William O’Neil in How to Make Money in Stocks and is also studied by traders like Mark Minervini, who emphasizes similar explosive momentum patterns in his work.

O’Neil pointed out that the High Tight Flag is extremely rare, appearing in only a handful of stocks during an entire bull market.

But when it appears and works correctly, the results can be extraordinary.

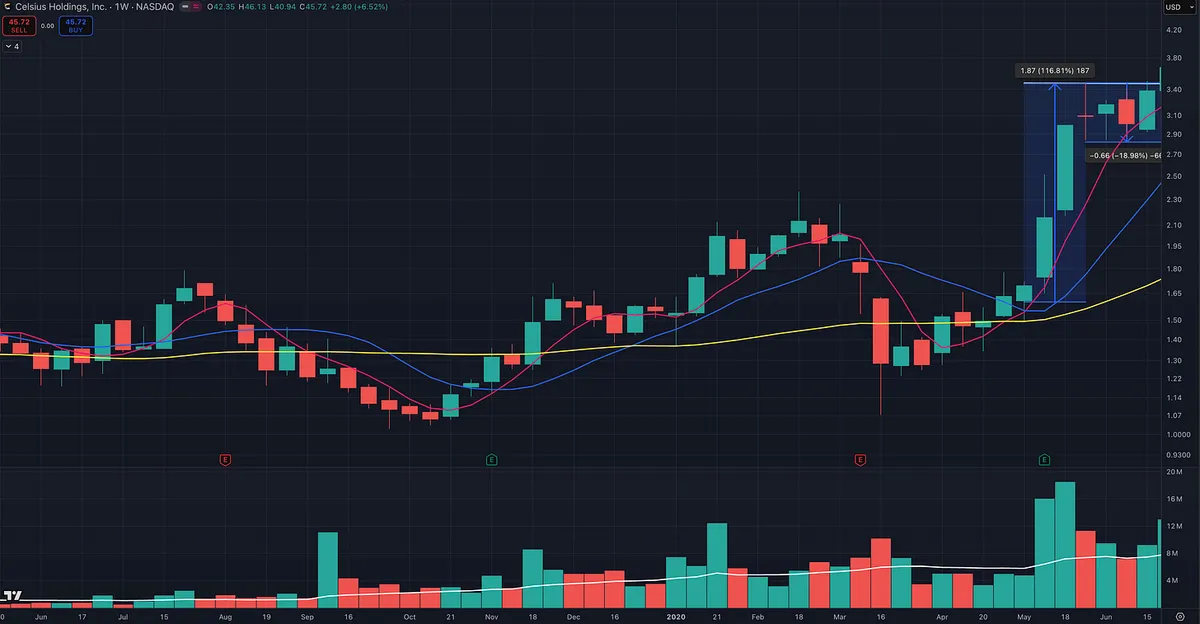
What Defines a High Tight Flag

The pattern begins with a massive price advance.

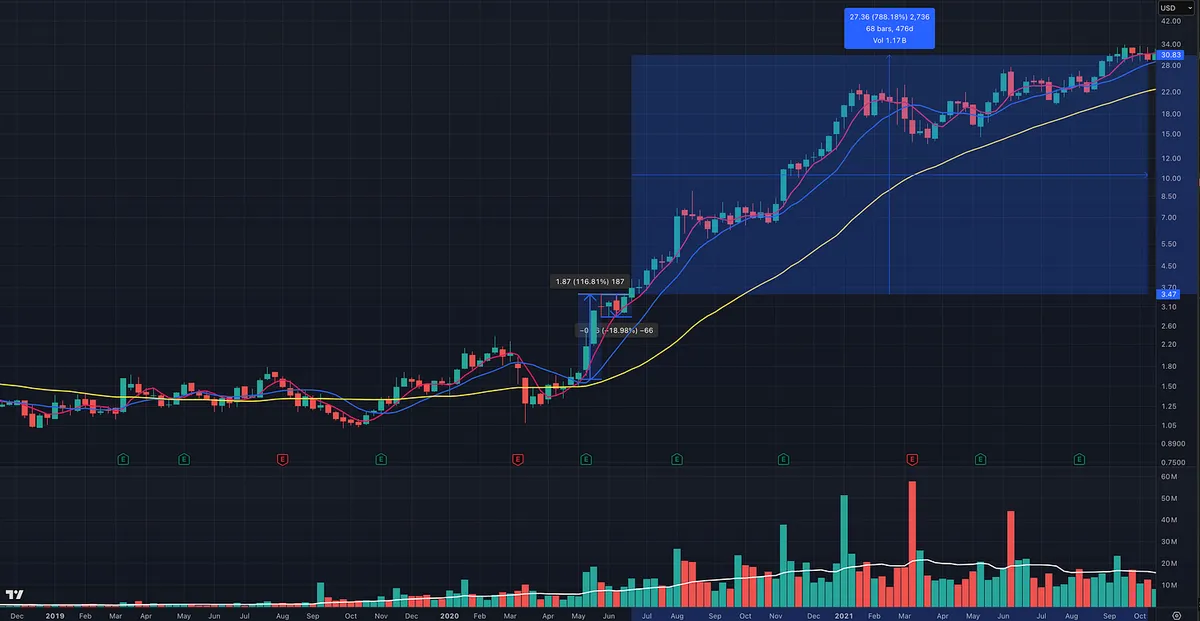
The stock typically rises about 100% to 120% within 4 to 8 weeks.

That type of move signals powerful institutional demand entering the stock.

After that explosive run, the stock does not collapse.

Instead, it moves sideways in a tight range, usually correcting only about 10% to 25%.

This consolidation typically lasts about 3 to 5 weeks.

That tight sideways action forms the “flag” portion of the pattern.

Why the Pattern Is Powerful

The High Tight Flag works because it reveals something unusual.

A stock that can double in a very short period of time and then refuse to give back those gains is showing that demand is overwhelming supply.

Institutions are often accumulating shares during the tight consolidation.

When the stock eventually breaks out of that sideways range, it can lead to another powerful advance.

O’Neil noted that some stocks have gone on to rise 200% or more after forming this pattern.

Why It’s Often Misinterpreted

Many traders believe they see High Tight Flags everywhere, but true High Tight Flags are very rare.

The move must be extremely fast. The consolidation must remain relatively tight and the pattern usually forms over a short time frame.

If the pullback is too deep or the consolidation drifts sideways for too long, it usually isn’t the real thing.

That rarity is exactly what makes the pattern so valuable.

When a true High Tight Flag appears, it often signals a powerful new market leader early in a major move.

View on Substack ↗

Why Knowing the Rules Isn’t Enough

Richard Dennis once said:

“I always say that you could publish trading rules in the newspaper and no one would follow them. The key is consistency and discipline. Almost anybody can make up a list of rules that are 80 percent as good as what we taught people. What they couldn’t do is give them the confidence to stick to those rules even when things are going bad.”

This explains one of the biggest misconceptions about trading.

The problem isn’t that traders don’t know the rules.

Most traders already know them.

Cut losses quickly. Let winners run. Control position size. Trade with the trend.

None of these ideas are secrets.

The real challenge is following those rules when emotions get involved.

It’s easy to follow a plan when everything is working.

It’s much harder to stick to that same plan during a drawdown, after a series of losses, or when a trade moves against you.

That’s where discipline separates successful traders from everyone else.

Winning traders don’t just have rules.

They have the consistency and confidence to follow them even when the market tests them.

Because in the end, trading success isn’t about knowing the right rules.

It’s about executing them over and over again, no matter what the market throws at you.

View on Substack ↗

What Actually Makes a True Market Leader

Many traders assume the biggest winners in the market are the largest companies or the most famous brands.

But that’s rarely how the market actually works.

William O'Neil explained it clearly:

“The number one market leader is not the largest company or the one with the most recognized brand name; it’s the one with the best quarterly and annual earnings growth, return on equity, profit margins, sales growth, and price action.”

In other words, the market rewards performance, not popularity.

The biggest stock winners usually share the same characteristics:

• Explosive earnings growth

• Strong sales growth

• High return on equity

• Expanding profit margins

• Powerful price momentum

When these fundamentals align with strong price action, that’s when institutional money begins flowing into a stock.

And when institutions accumulate shares, price trends can persist far longer than most people expect.

This is why many of the biggest market winners look “expensive” to the average investor.

But in reality, they’re simply companies with the strongest growth and leadership.

Instead of searching for the cheapest stocks in the market, professional traders focus on finding the true leaders.

Because historically, the biggest winners are almost always the companies with the strongest growth and the strongest price action.