Momentum Trading Strategy

Notes

Short lessons on momentum trading, every day.

Every note from Substack, in one place: risk, setups, leading stocks, market conditions and the mindset behind them. Search them, browse by topic, or filter by stock.

Showing 761–780 of 1226 notes

View on Substack ↗

The Market Just Flipped the Switch

Below the 200 Day, the Rules Change Whether You Like It or Not

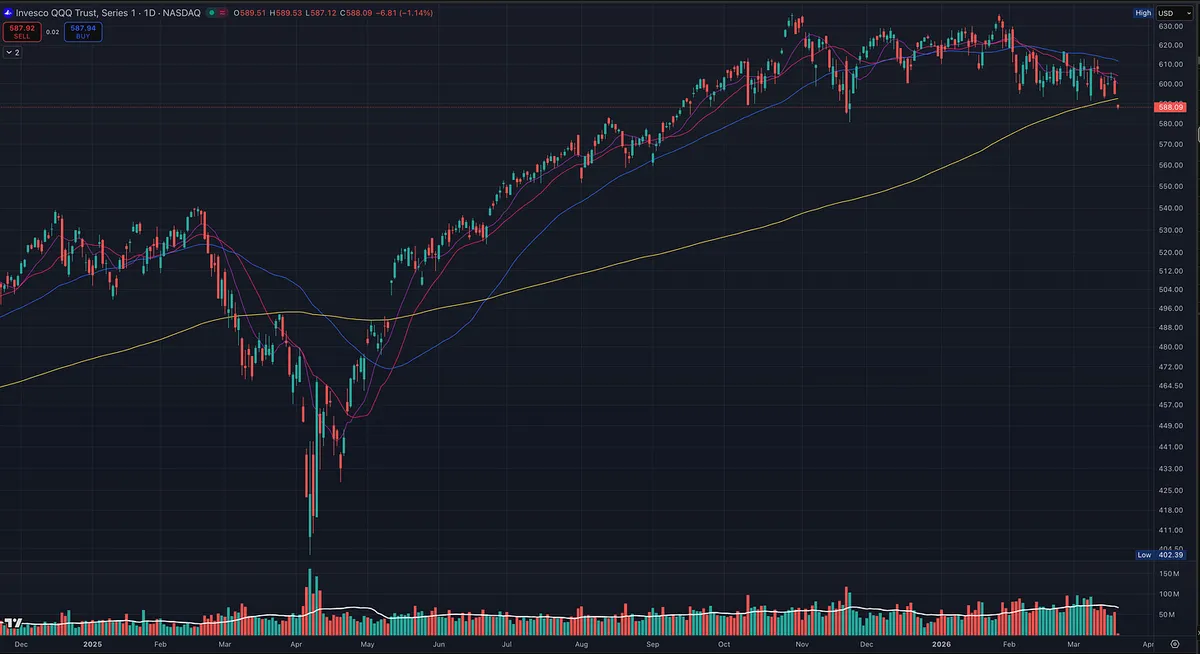
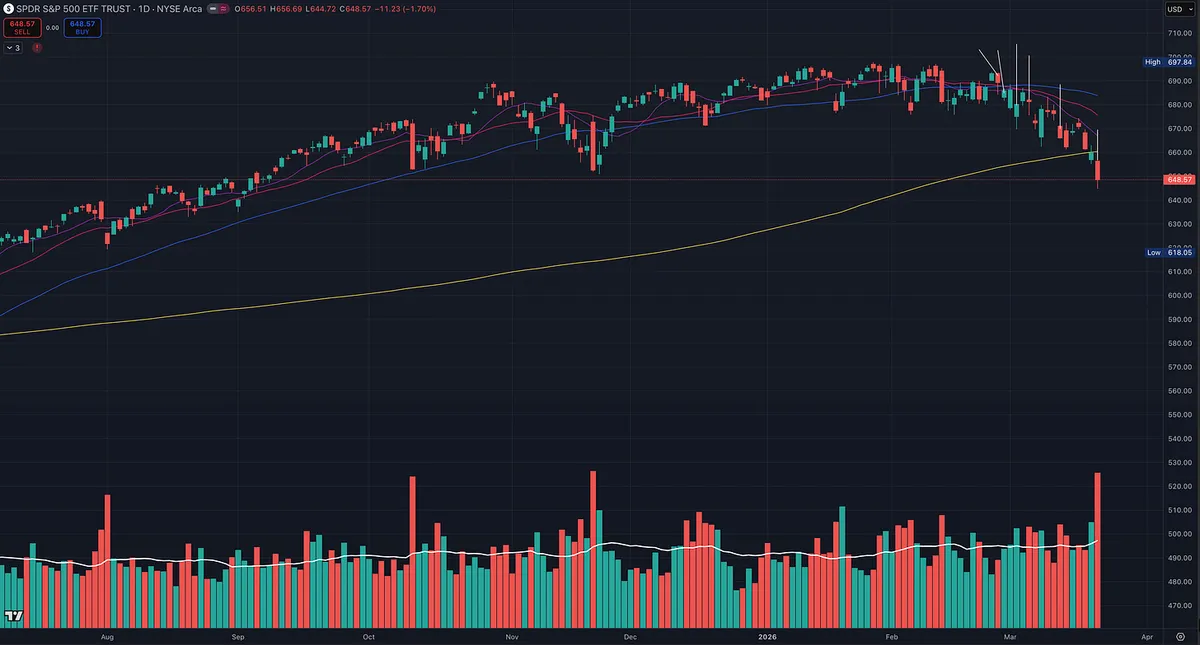
Look at the chart again.

Not casually. Not hopefully. Objectively.

Because deep down, you already know something is different.

Price is not debating anymore. It is communicating.

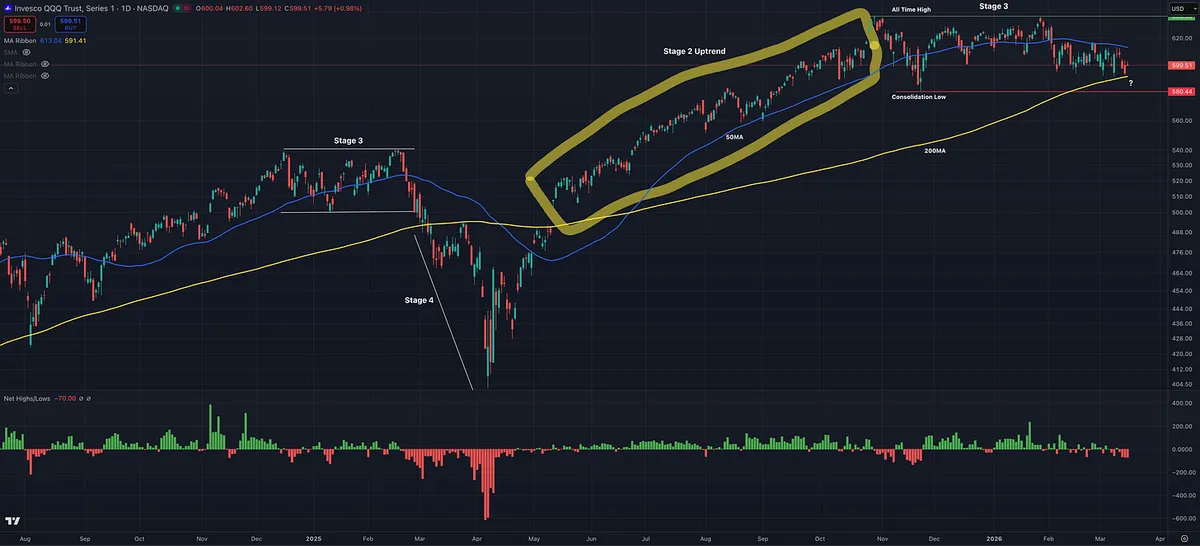
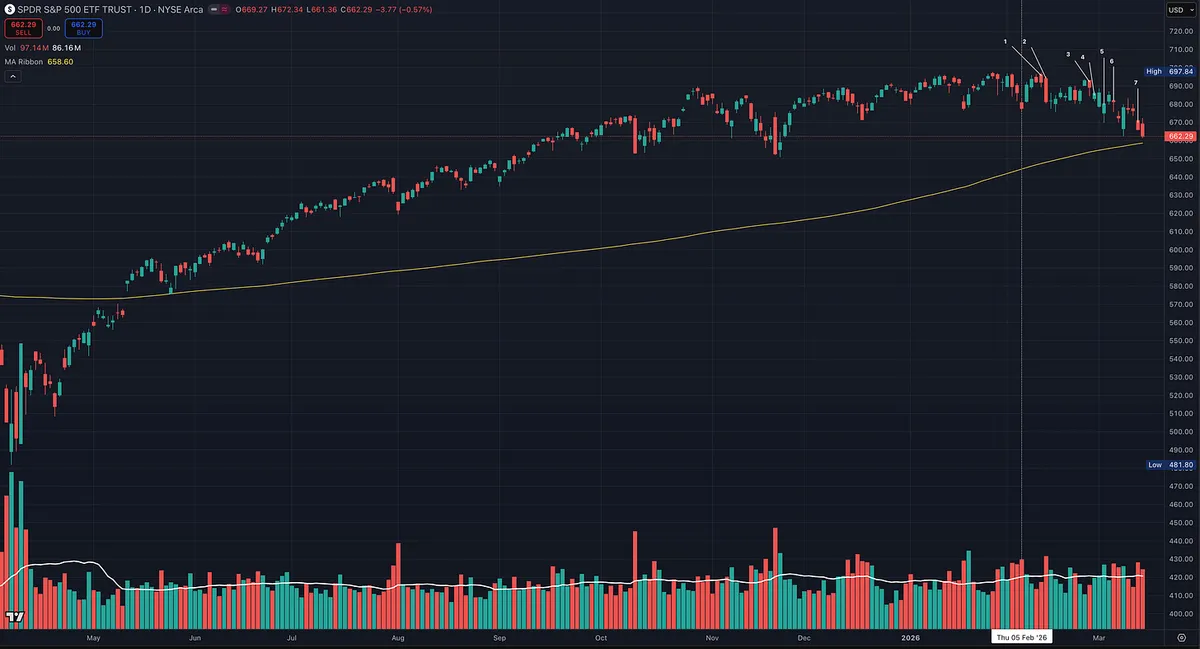
The S&P 500 and the NASDAQ 100 have both closed below the 200 day moving average. Not intraday. Not briefly. Closed below.

And as Paul Tudor Jones put it best, “Nothing good happens below the 200-day moving average.”

That statement is not dramatic. It is practical. It is survival.

Now layer in what just happened Friday.

A decisive break below the November 21 consolidation low. Heavy volume. Broad participation. Acceleration in Net 52 week lows. A 1.7% drop in the S&P 500 on BIG volume.

This is not random movement. This is distribution.

And when you zoom out, the message becomes even clearer.

The 10 day is declining. The 20 day is declining. The 50 day is declining.

That is alignment. Just not the kind bulls want.

This is exactly how a Stage 4 decline begins.

Stan Weinstein defined Stage 4 as the phase where institutions are no longer supporting price. They are exiting. Quietly at first. Then all at once.

And if you have studied William O’Neil, you already know what comes next.

He was very clear in that when the general market shows signs of distribution and begins to weaken, you must start raising cash and protecting capital. He repeatedly emphasized that the market itself determines your level of exposure, not your opinions.

You do not argue with it. You do not average down. You do not get creative.

You get defensive.

O’Neil also drilled home one of the most important truths in investing.

Three out of four stocks follow the general market trend.

That means even the strongest leaders will struggle when the indexes are under pressure. This is why he stressed the importance of interpreting market direction first before making any stock decisions.

This is where most traders lose money.

Not because they lack intelligence. Because they lack obedience to price.

Mark Minervini echoes the same principle in . When the market is not healthy, you reduce exposure aggressively. You do not force trades in poor conditions. You wait for alignment.

No hero trades. No predictions.

Just discipline.

Now here is the part most people will resist.

Could the market snap back this week? Yes.

Could we reclaim the range and move back into a sideways environment? Absolutely.

But that is not the current reality.

The current reality is what price just confirmed.

Break of support. Expansion in volume. Multiple distribution characteristics. Trend alignment to the downside.

That is Stage 4 behavior.

O’Neil specifically warned about clusters of distribution days and breaks of key support as signals that institutions are exiting. And when institutions sell, the path of least resistance is down.

And experienced traders understand something that newer traders do not want to accept.

Cash is a position.

Not a missed opportunity. Not fear. Not weakness.

Position.

In fact, during environments like this, O’Neil would often move heavily to cash and wait patiently for a confirmed uptrend to resume before redeploying capital.

Because capital preservation is what allows you to take advantage of the next real opportunity.

Right now, the goal is not to make money.

The goal is to not lose it.

But here is the part that matters most.

This is not the end of the world.

This is the process.

Every major opportunity in the market is born out of periods like this. Corrections reset leadership. They shake out weak hands. They build the foundation for the next true uptrend.

O’Neil made fortunes not by fighting these phases, but by respecting them and then stepping in aggressively when a new confirmed uptrend emerged.

If you protect your capital now, you are not falling behind.

You are positioning yourself.

Because when the next Stage 2 begins, the traders who stayed disciplined will not be trying to recover.

They will be ready to attack.

The market has already spoken.

The only question is whether you are listening.

One last note…

For those of you who have been reading my Big Picture Market Pulse and paying attention in the chat, you’ve noticed I’ve been reducing exposure and activity for weeks. So before we even got to this point, I had already reduced potential damage. This is not a sudden surprise.

Also, this is a great time to start the course. Modules 1 through 3 are complete, and Module 4 will be out soon.

Make sure to read this weekend’s post when it’s released in the next 24 hours.
View on Substack ↗

It Looks Extended… Then It Explodes

Most traders look for stocks breaking out of long bases. That’s not wrong.

Others chase extended names. That’s where they get trapped.

Some try to buy the dip… but end up catching a falling knife.

What many don’t realize is that some of the best opportunities come from stocks that already look extended.

The strongest names don’t pull back the way people expect.

They run up, pause, then run again.

Darvas wrote about this over 60 years ago. The best stocks move higher, tighten, and continue. This pattern repeats until the trend is over, and it usually lasts longer than most expect.

It pushes higher → tightens → then goes again.

Over and over.

That tight action near highs is where the opportunity is.

Not obvious. Not comfortable.

But repeatable and essential in strong Stage 2 uptrends.

This is the same structural behavior Darvas described, expressed on a shorter swing trading timeframe.

This is the Momentum Burst setup.

Add it to your trading toolkit.

Full breakdown here 👇

https://tradingmomentum.substack.com/p/the-momentum-burst-setup-how-to-capture

ArticleThe Momentum Burst Setup: How to Capture Explosive Moves Before They Happen
View on Substack ↗

Relative Strength Points You to the Leaders

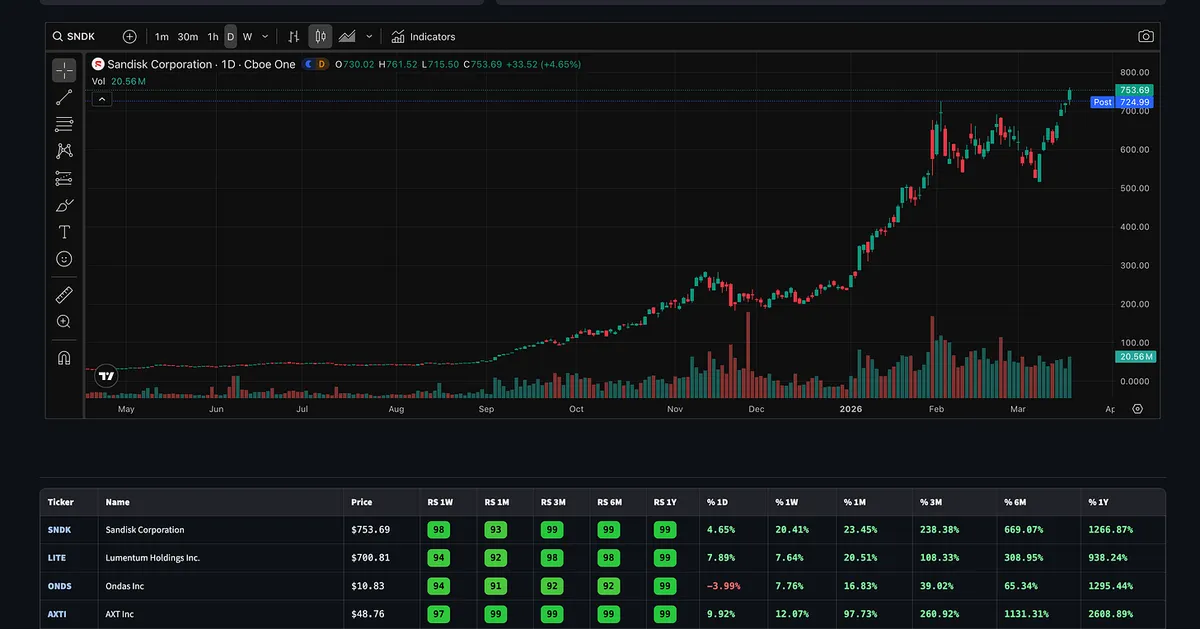
Sometimes the easiest way to find a stock is to start with relative strength.

What is already outperforming everything else?

Focus on the top 1 to 2 percent of the market.

These are the names institutions are already accumulating.

I have found more leading stocks using this simple approach than any complex scan or strategy.

But here is where most traders go wrong.

Not every strong stock is immediately actionable.

Many times you will find great names that are extended or not properly set up.

That is fine.

Add them to your watchlist and be patient.

Once you identify the leaders, wait for them to set up again.

Strong stocks will often give you another opportunity after a pullback.

Look for higher lows.

Look for price tightening.

Look for price to find support at key moving averages.

Look for volume drying up as selling pressure disappears.

Look for price to move higher and volume expands.

This is how true market leaders behave in strong Stage 2 uptrends.

They make powerful, explosive moves, pause, then move higher again.

This cycle can repeat multiple times before the trend is finally exhausted.

We often make this process more complicated than it needs to be.

Find strength. Wait for a proper low risk, high reward setup. Then execute.

View on Substack ↗

Why Earnings, Sales, Margins, and ROE Matter in Growth Stocks

Most traders focus on the story.

The best traders focus on the numbers behind the story.

Not all fundamentals matter equally.

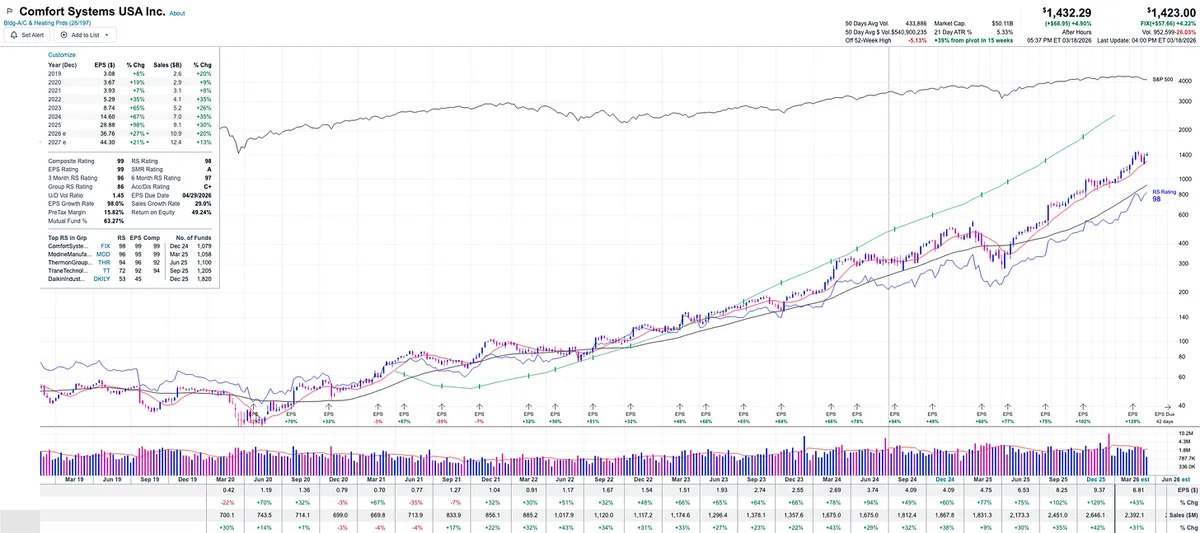
In growth stocks, four metrics consistently show up in the biggest winners:

Earnings growth

Sales growth

Margins

ROE

These are not random.

They tell you whether a company is truly scaling or just appearing strong on the surface.

Start with earnings.

Earnings growth is a clear signal that a company is becoming more profitable over time. It shows the business model is working.

But earnings alone are not enough.

They can be temporarily boosted through cost cutting or short term efficiency gains.

That can improve results for a period of time, but without real underlying demand, it does not last.

That is why sales growth matters.

Sales tells you if the growth is real.

It confirms that demand for the company’s product or service is expanding, not just that the company is managing expenses better.

When both earnings and sales are growing, you are looking at a company that is expanding and becoming more efficient at the same time.

That is a powerful combination.

You have real top line growth driving the business forward, combined with improving productivity that is fueling earnings.

Now look at margins.

Margins are a secondary confirmation of efficiency.

They show how well a company is converting revenue into profit as it scales.

Expanding margins tell you the company is gaining leverage as it grows.

But context matters.

Different industries operate with very different margin profiles.

The key is comparing margins to others within the same industry group.

The same applies to return on equity.

ROE measures how effectively management is using capital to generate returns.

High ROE within a peer group is often a sign of a superior business model.

This is exactly what institutions are looking for in growth companies.

There are many fundamental metrics in the market, but not all of them apply to growth investing.

For institutions focused on growth, these are the metrics that matter most.

Strong demand

Improving profitability

Operational efficiency

Effective capital allocation

When these align, and price confirms, you are often looking at a true leader.

View on Substack ↗

Why Growth Stocks Offer a Bigger Edge

Most people assume the market is fully efficient.

It is not.

And the inefficiency is not evenly distributed.

Large, mature value companies are heavily covered. They have predictable business models. Cash flows are stable. Analysts have years of data to work with.

That makes them easier to model.

Estimates tend to be tighter. Expectations are more accurate. There is less room for surprise.

That means less opportunity.

Growth companies are different.

They are earlier in their lifecycle. They are changing quickly. New products, new markets, shifting demand.

This makes them harder to predict.

Analysts are often behind. Estimates are frequently wrong. Revisions come late.

This is where the edge comes from.

When a company begins to accelerate earnings and sales, the market starts to recognize it before the models fully adjust.

Institutions move early. Price begins to trend. Then analysts catch up.

That gap between reality and expectations is where the biggest moves happen.

This is why the greatest winners are almost always growth stocks.

Not because they are “better” companies.

But because they are less efficiently priced.

And in markets, inefficiency is opportunity.

View on Substack ↗

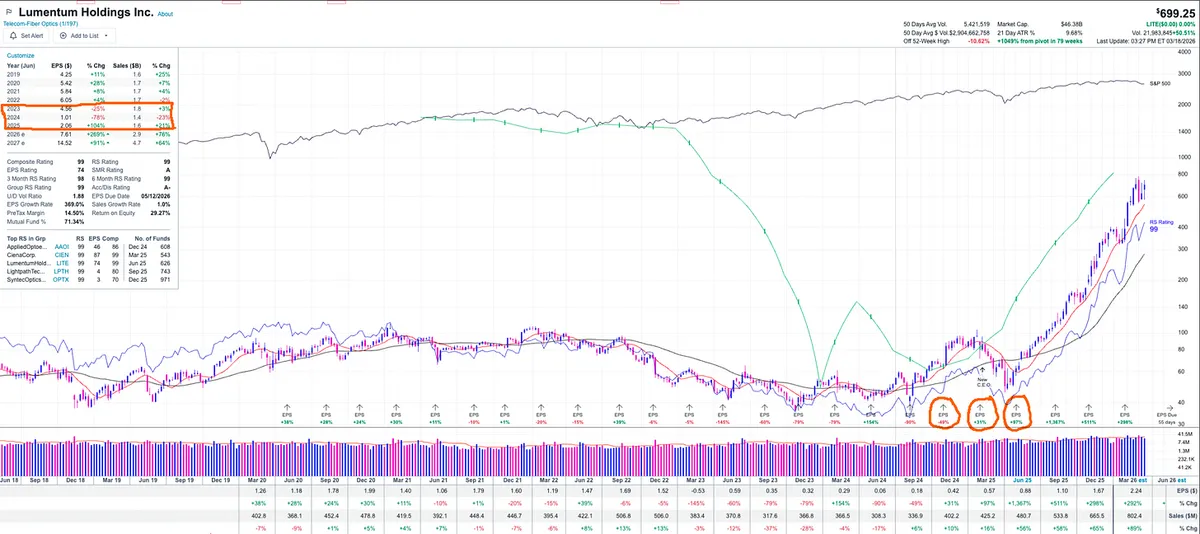
LITE Earnings Turnaround Before the Breakout

Most traders wait for perfect earnings. The market does not.

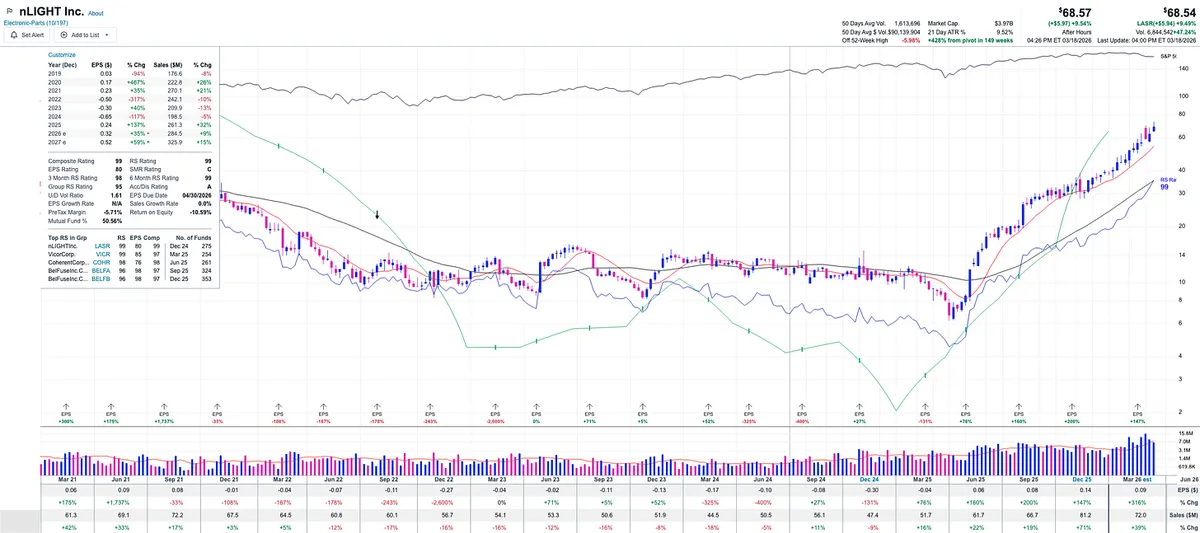
LITE spent two years with weak and declining earnings. Growth slowed. Some quarters turned negative. Nothing looked attractive.

Most people ignored it.

Then the shift happened.

Before the major move in 2025, earnings flipped. Negative quarters improved and turned positive. Then growth began to accelerate.

Annual earnings surged into triple digit growth.

But there is another layer most traders miss.

Both Mark Minervini and David Ryan have pointed out that during major turnarounds, analysts are often behind the curve. Their estimates tend to be too conservative.

Price begins to move as institutions recognize the change early, while analysts are still catching up or providing conservative estimates.

The stock did not wait for perfect fundamentals. It moved when the trend changed.

This is what matters.

Not just strong earnings, but improving and accelerating earnings.

Watch for earnings turnarounds.

View on Substack ↗

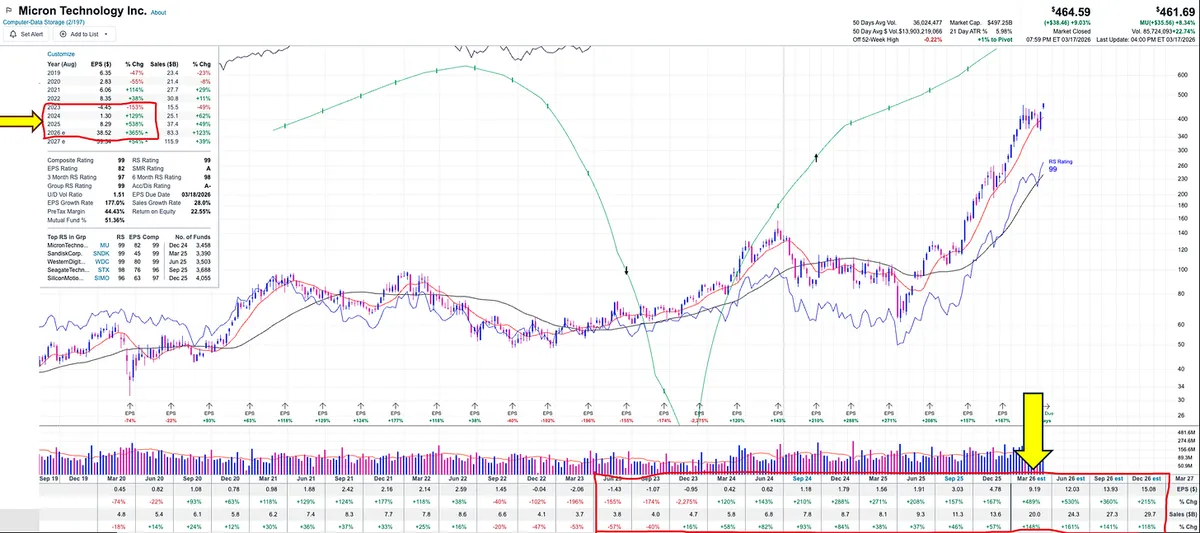
Why MU Keeps Showing Up

There is a reason I keep bringing up Micron in the Substack chat.

Look at what is happening under the surface.

Earnings and sales are not only strong, they are improving quarter after quarter. That is the key.

Now combine that with:

• A leading industry group, one of the strongest in the market

• Return on equity around 22%

• Expanding margins above 40%

• Relative Strength Rating of 99

• Increasing institutional ownership quarter over quarter

The stock continues to find support at the 50-day and 10-week moving averages and pushes higher.

This is what a true leader looks like.

View on Substack ↗

Earnings Acceleration Matters

Big earnings and sales growth can absolutely drive stocks higher.

You will see stocks with strong numbers move, even without perfect acceleration.

But this is where many traders get confused.

Sometimes a company reports:

• Big earnings

• Big sales

• Strong margins

And the stock drops or goes nowhere.

Why That Happens

Because the market is forward-looking.

It is not just about how big the numbers are.

It is about whether they are improving or slowing.

If growth is:

• Peaking

• Decelerating

• Already expected

Then it may already be priced in.

Institutions may even be selling into those strong reports.

What Acceleration Tells You

Acceleration is not required for every move.

But it is an important piece of the puzzle.

Minervini and David Ryan look for:

3 quarters of accelerating earnings and sales, along with 1–2 quarters of strong forward estimates

Especially early in a move.

Important Detail

Acceleration does not need to start from strong numbers.

It can begin from weakness.

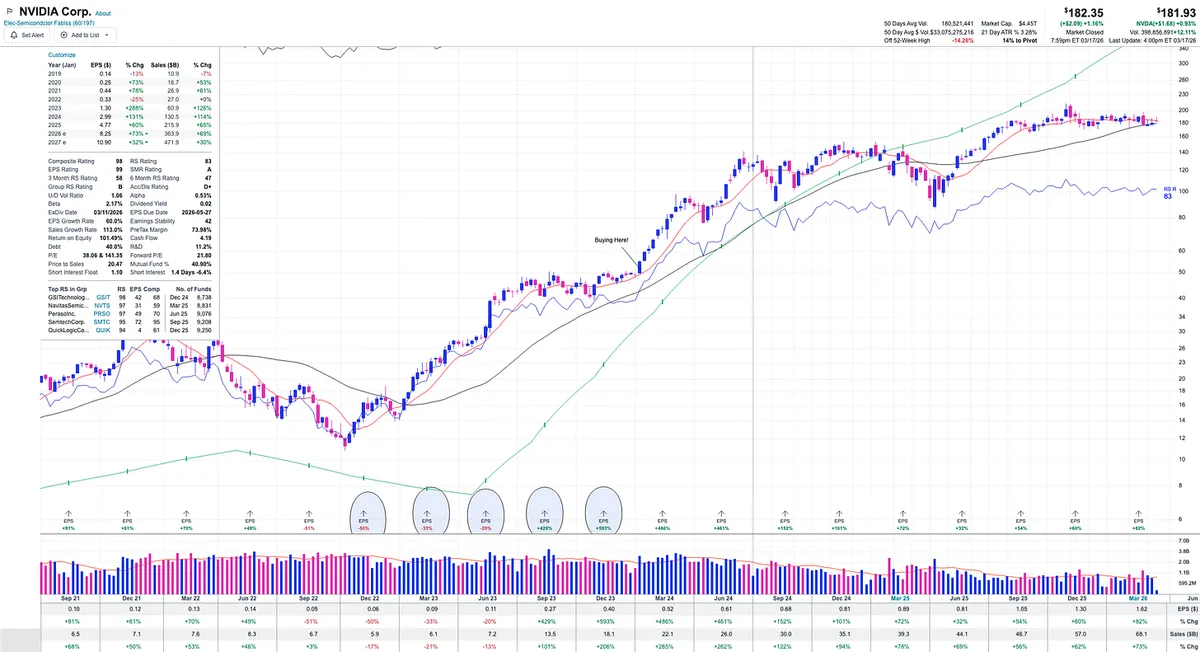
For example:

-50% → -33% → -20% → +429% → +593%

That is powerful acceleration.

Each quarter is improving, even before the numbers turn positive.

Then once they do, the growth expands rapidly.

This is often where institutions begin building positions.

The Sweet Spot

Acceleration in the first few quarters of a move can signal:

• The trend is building

• Demand is increasing

• Institutions are accumulating

This typically occurs before the major breakout.

Not too early

Not too late

NVDA Example

NVIDIA showed multiple quarters of improving earnings and sales before its major breakout.

The numbers did not start perfect.

They improved, then turned positive, then accelerated aggressively.

You can see on the chart that the stock began its move higher while earnings were still negative, but improving. The first two major positive earnings reports occurred during a period of tight consolidation. From there, the stock broke out and advanced roughly 50% before the third major earnings report.

Takeaway

Big earnings matter and strong numbers can move stocks.

But acceleration provides additional context.

Improving numbers, especially when growth is building and gaining momentum, often signal the move before it happens.

By the time the numbers look obvious, the move is usually already underway.

View on Substack ↗

Never Trust the Story. Trust the Price.

Years ago, I heard both David Ryan and Mark Minervini make a point that has stuck with me ever since.

Yes, they both place heavy emphasis on CANSLIM-style fundamentals

Big earnings

Big sales growth

Strong margins and ROE

But they also emphasized one rule that overrides everything else:

Never trust the story. Never trust the fundamental numbers unless they are confirmed by price action.

What does that mean in practice?

It means:

If the chart looks weak

If price is not acting right

If the stock is not behaving like a true leader

Then none of the rest matters.

Not the CEO narrative

Not the analyst upgrades

Not the media hype

Not even the strongest earnings report

There is no trade.

This is coming from two U.S. Investing Champions who built their careers on performance, not opinions.

And they are not alone.

You will hear this same principle repeated by many of the most successful traders:

Price is the final judge.

Fundamentals may tell you what should happen

The story may tell you what could happen

But price tells you what is actually happening

And in this game, that is all that matters.

If price and volume do not confirm the fundamentals and story, the market is telling you something is off.

Listen to it.

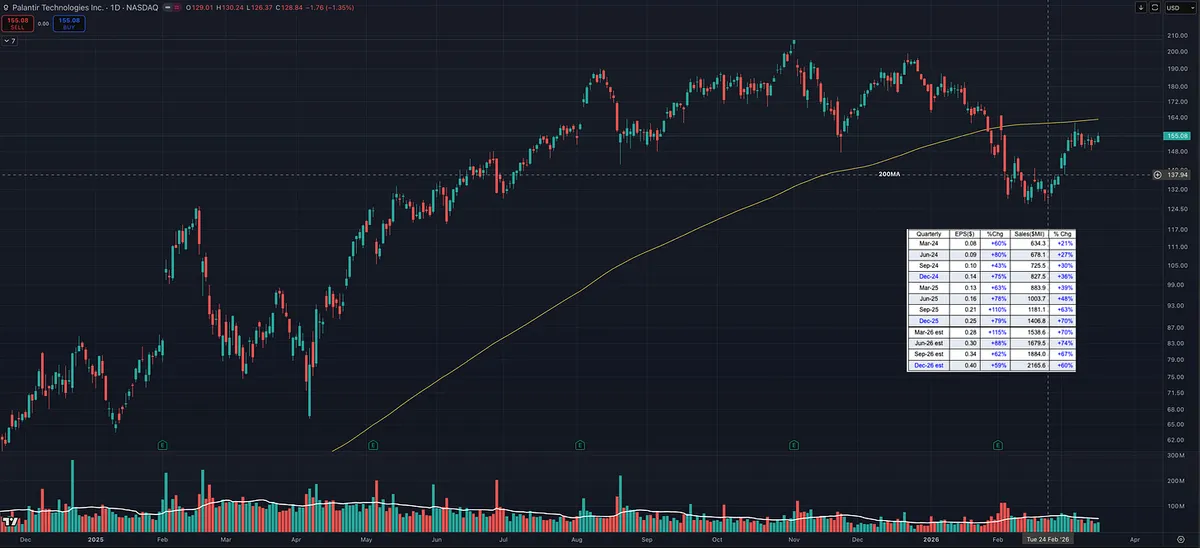
Need an example….. look at PLTR and CRDO.

View on Substack ↗

Wide and Loose = Low Probability

Most Breakouts Fail for One Simple Reason

And almost nobody studies it.

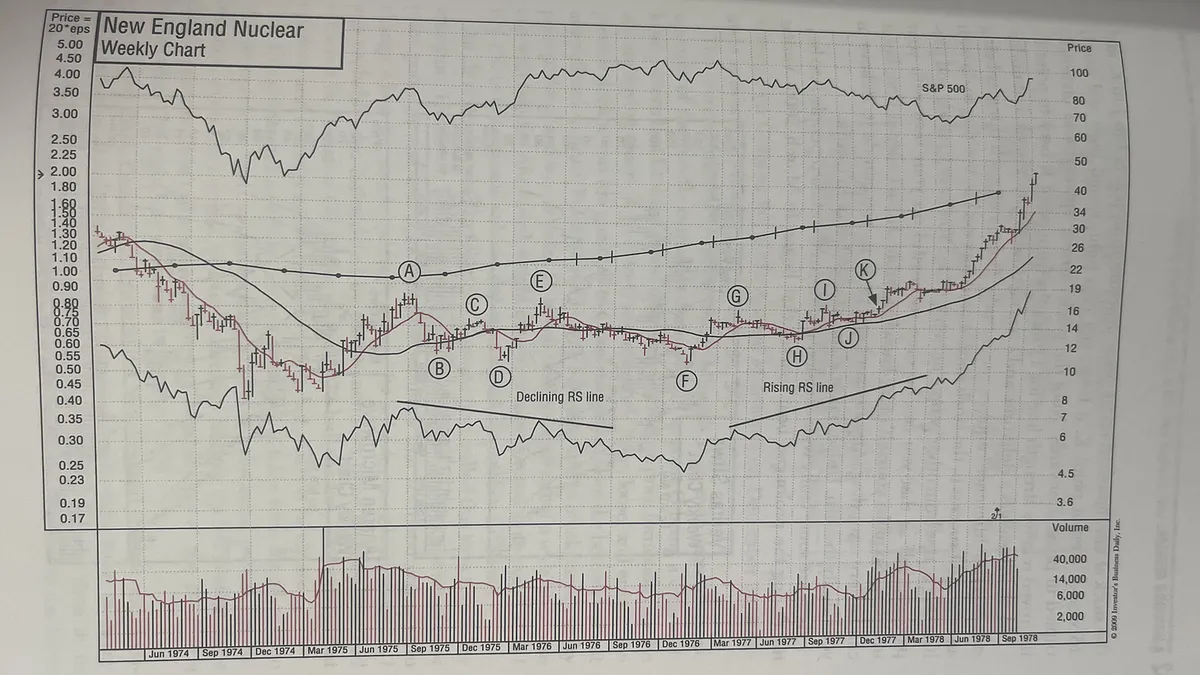
New England Nuclear looked ready three separate times.

Each time, it failed.

Not bad luck.

Not news.

Structure.

From A to E:

  • 40% correction

  • wide, erratic price swings

  • declining relative strength

This is what O’Neil called wide and loose.

And wide and loose patterns fail.

But here’s where traders get trapped:

It looks like a base.

It feels like it’s ready.

So they buy.

At E → breakout attempt → fails

At G → breakout attempt → fails again

At I → breakout attempt → fails again

Same mistake every time:

Buying before the stock proves itself.

Here’s what changed everything:

From I to K:

  • volatility dried up

  • price tightened

  • structure became orderly

  • relative strength turned up

Now demand is in control.

Now institutions are accumulating.

At K, it breaks out.

And nearly triples.

Same stock.

Different structure.

Different outcome.

The lesson most people miss:

  • Wide and loose = low probability

  • Tight and controlled = higher probability

  • Strength must prove itself over time

You don’t get paid for spotting setups early.

You get paid for waiting until they’re right.

View on Substack ↗

AI Won’t Make You a Better Trader (This Will)

Everyone is excited about AI in trading right now. New tools, better scanners, faster data. It feels like this is the edge everyone has been waiting for.

But let me ask you something…

If AI was the answer, why hasn’t the average trader improved?

The truth is simple.

AI does not replace understanding.

It amplifies it.

If you don’t understand how markets actually work… If you don’t understand your strategy… If you don’t know what a high-quality setup looks like…

Then AI just gives you more noise, faster.

And that’s exactly what’s happening.

More tools. More data. More confusion.

No better results.

Now flip it the other way.

A trader who understands price, structure, and leadership can take those same tools and suddenly become more precise, faster, and more efficient.

Same tools. Different outcome.

That’s the difference.

This is exactly why I’ve been building out a trading course here.

Because the real edge has never been the tool.

It’s the knowledge and experience behind how to use it.

Once you have that, everything changes.

View on Substack ↗

Every Trader Knows This. But Most Don’t Act On It.

Every trader would agree with this:

No single strategy works in every market environment.

Momentum strategies struggle in choppy markets.

Mean reversion struggles during strong trends.

Yet most traders never stop to ask a critical question:

What kind of market environment are we actually in right now?

Instead, they keep applying the same strategy regardless of conditions.

If you fail to analyze the broader market environment, you may end up trading in conditions that are completely misaligned with your strategy.

This principle doesn’t just apply to momentum or trend-following systems.

It applies to every trading style.

As Dr. Van Tharp explains:

“You need to understand how your system works in various market types and use it only in the types of markets for which it was designed. The common mistake most people make is trying to find a system that works in all market conditions. That’s insane.”

In other words:

Success in trading isn’t just about finding the right strategy.

It’s about using the right strategy in the right environment.

Module 2 and Module 3 of the Momentum Trading Course walk through how to evaluate and frame the market environment.

Start here: https://tradingmomentum.substack.com/p/momentum-trading-strategy-the-100-56a

On SubstackMomentum Trading Strategy: The 100-Year Playbook Behind the Biggest Winning Stocks — Module 3
View on Substack ↗

Mental Rehearsal: The Edge Most Traders Ignore

Most traders prepare for the market by scanning charts and planning for the trade technically.

Elite traders prepare their mind.

One of the most powerful tools for this is mental rehearsal.

Not positive visualization.

That’s where many people go wrong.

Positive visualization imagines the best possible outcome. Every trade works. Everything goes your way.

But that’s not reality.

When the first loss hits, your nervous system panics.

Mental rehearsal is different.

You mentally walk through the entire process of trading.

You see yourself identifying the setup. You see yourself executing your plan.

But you also rehearse the other scenario.

The trade fails.

You get stopped out for a small loss.

You accept it, take a breath, and move on to the next opportunity.

No frustration. No revenge trading. Just execution.

Muhammad Ali used this same concept before every fight.

He didn’t just visualize knocking someone out.

He mentally prepared to take punches, feel the pain, and keep fighting.

So when the punch came in the ring, he had already experienced it in his mind.

Great traders do the same thing.

They rehearse the wins.

They rehearse the losses.

And most importantly…

They rehearse sticking to the plan.

View on Substack ↗

Stop Scanning Random Stocks. Do This Instead.

Stan Weinstein’s “Forest to the Trees” method that quietly finds the highest-probability breakout stocks.

Most traders open their charts and start here:

Stocks.

They scroll… scan… and hope something “looks good.”

But the traders who consistently catch monster breakouts follow a completely different process.

Stan Weinstein called it:

The “Forest to the Trees” approach.

And once you see it, your brain immediately goes:

Yeah… that actually makes way more sense.

Because it aligns with how probability actually works in markets.

Step 1 — Start With the Forest (The Market)

Before looking at a single stock, ask one question:

Is the market healthy?

The best traders want the market wind at their back.

Most stocks follow the general market direction, which is why market trend analysis is foundational to successful stock selection.

If the environment is hostile, even great stocks struggle.

Step 2 — Find the Strongest Groups

Money does not move randomly.

It moves in themes.

When institutions accumulate stocks, they often accumulate entire sectors.

That is why the biggest winners tend to emerge from leading industry groups, not isolated names.

So the next filter becomes simple:

Where is the money flowing?

Step 3 — Find the Best Stock in That Group

Only now do you zoom into individual stocks.

Inside the strongest groups, you look for:

• Tight consolidations

• Strong relative strength

• Institutional accumulation

• Clean breakout levels

• Asymmetric risk vs reward setups

At this point you are not randomly scanning anymore.

You are selecting from the strongest part of the market.

Step 4 — Remember: This Is a Probability Game

Even with perfect analysis…

You will still be wrong.

Markets are not about certainty.

They are about probabilities.

The edge comes from two simple rules:

Cut losers fast. Let winners run.

One Idea That Changes How You Find Big Winners

Most traders start with a stock.

Professionals start with the market.

Market → Sector → Stock → Breakout.

The forest leads you to the trees.

View on Substack ↗

Most Traders Skip This Step Before Picking Stocks

Most traders jump straight to stock charts.

Professionals start with the market environment.

Before I analyze a single stock each week, I run through a structured Big Picture Market Pulse framework that looks at:

• Market trend and stage

• Breadth and participation

• Institutional buying and selling

• Sentiment and volatility

• Credit markets and macro signals

• Sector and industry leadership

• And more

Because the reality is simple:

No trading strategy works in every market environment.

If you're trading momentum stocks in a weak market, even great setups can fail.

In this new lesson, I walk through the entire framework I use every weekend before selecting stocks.

If you want to improve your probabilities as a trader, this step is essential.

Full breakdown:https://tradingmomentum.substack.com/p/momentum-trading-strategy-the-100-56a

On SubstackMomentum Trading Strategy: The 100-Year Playbook Behind the Biggest Winning Stocks — Module 3
View on Substack ↗

Want to know one of the fastest ways to spot market deterioration?

Watch the 52 week new highs and new lows list.

Many people ask why I track it.

Simple.

Because many of the greatest traders did.

William J. O'Neil wrote extensively about this in How to Make Money in Stocks.

The new highs and new lows list often reveals deceleration and deterioration in the market before most people notice it.

But there is an important nuance that many traders miss.

It is not just about seeing stocks make new highs.

You have to ask:

What kind of stocks are making those highs?

If leadership stocks with strong earnings and sales growth are breaking out, that is constructive.

But if the list is dominated by defensive or laggard type stocks, that is a warning sign.

Utilities. Staples. Preferred shares. Slow movers.

In past market cycles, some technicians ignored weakness because “stocks were still making new highs.”

But a deeper look often showed those highs were coming from defensive names.

That is not healthy leadership.

That is capital hiding.

This is why superficial knowledge can hurt you in the stock market.

It is not enough to look at the data.

You have to understand what the data is actually telling you.

View on Substack ↗

Trading Is Not One Skill. It Is Many.

People say you should specialize in trading.

They are right.

But you still need to be good in many different areas as well.

Yes, you might specialize in growth stocks or setups like VCPs, episodic pivots, or high tight flags.

But even inside that specialization, surviving in the market requires competence across multiple skills.

You still need to be a bit of a jack of all trades, even if you master one specific area.

You must be good at many different skills at the same time.

For example.

You could be the best stock picker in the room.

You scan relentlessly. You read charts perfectly. You identify catalysts like new products, new services, or accelerating fundamentals before the crowd.

But if you cannot control risk… If you oversize positions… If your emotions cause you to break your risk plan…

You will not make it.

On the other hand, you might have incredible discipline.

You cut losses fast. You size positions correctly. You follow your rules.

But if you cannot consistently find A+ setups, then you have no real edge.

You might survive.

But you will not thrive.

Great traders understand something most people miss.

Trading is a combination of skills.

You must be strong in several areas at once:

• Finding stocks in play

• Identifying A+ setups within your strategy

• Developing a process and system with positive expectancy

• Managing risk and position sizing

• Controlling emotions and staying disciplined

You do not need to be perfect at any one of them.

But if you are weak in just one, the market will find it.

And eventually it will cost you.

That is why trading is so difficult.

It is not mastery of one skill.

It is competence across many.

View on Substack ↗

Just Because You Can Trade It Doesn’t Mean You Should

If you scan enough charts, you will always find something to trade.

A breakout forming.

A pivot setting up.

A stock sitting in a buyable zone.

But look a little deeper.

Weak sales.

Not in a leading group.

A slower mover that does not offer the risk reward your strategy is built for.

A market environment that is not supportive.

Yet traders convince themselves to take it anyway.

Why?

Because it’s there.

During consolidations like this, I’ve even caught myself throwing names out that aren’t really what we do. For most traders, this is a bad move.

Yes, those trades can work sometimes.

But they are usually lower probability than waiting for true A+ setups in strong groups when the market is supportive.

Another factor most traders ignore is where they stand for the year.

If you’ve had a huge year and are comfortable risking a small amount to probe weaker conditions, that’s one thing.

But if you’re just starting out, or the year hasn’t been great, forcing trades in mediocre names can do real damage.

Many traders believe their strategy stopped working.

Often the reality is simpler.

The environment changed, and they stopped following their own playbook.

The market will always show you something to buy.

The real edge is having the discipline to wait.

View on Substack ↗

How William O’Neil Spotted Institutional Selling Before Market Corrections

One of the simplest but most powerful concepts from William O’Neil’s How to Make Money in Stocks is something called distribution days.

A distribution day occurs when a major market index closes lower than the previous day on higher volume.

Price down + volume up.

Why does that matter?

Because volume reveals institutional activity.

Large mutual funds, hedge funds, and pension funds cannot quietly sell billions of dollars worth of stock. When they begin exiting positions, it often shows up as market declines on heavier volume.

That’s what distribution days are designed to detect.

O’Neil tracked these over roughly 20–25 trading days. When they begin to cluster, it can signal that institutional selling pressure is building beneath the surface of the market.

A simple way to think about it:

0–2 distribution days Healthy uptrend

3–4 distribution days Early warning

5–6 distribution days Institutional selling showing up

7+ distribution days Market under pressure

O’Neil typically monitored distribution days on the Nasdaq Composite and the S&P 500.

In my own process, I also include the Nasdaq 100 to capture what the large-cap growth leaders are doing.

When distribution begins appearing across multiple indexes at the same time, it often tells you something important:

Institutions may be selling.

And when institutions sell, the market eventually feels it.