Momentum Trading Strategy

Notes

Short lessons on momentum trading, every day.

Every note from Substack, in one place: risk, setups, leading stocks, market conditions and the mindset behind them. Search them, browse by topic, or filter by stock.

Showing 961–980 of 1230 notes

View on Substack ↗

Do We Need Lighter Volume on Pullbacks for Index ETFs to Move Higher?

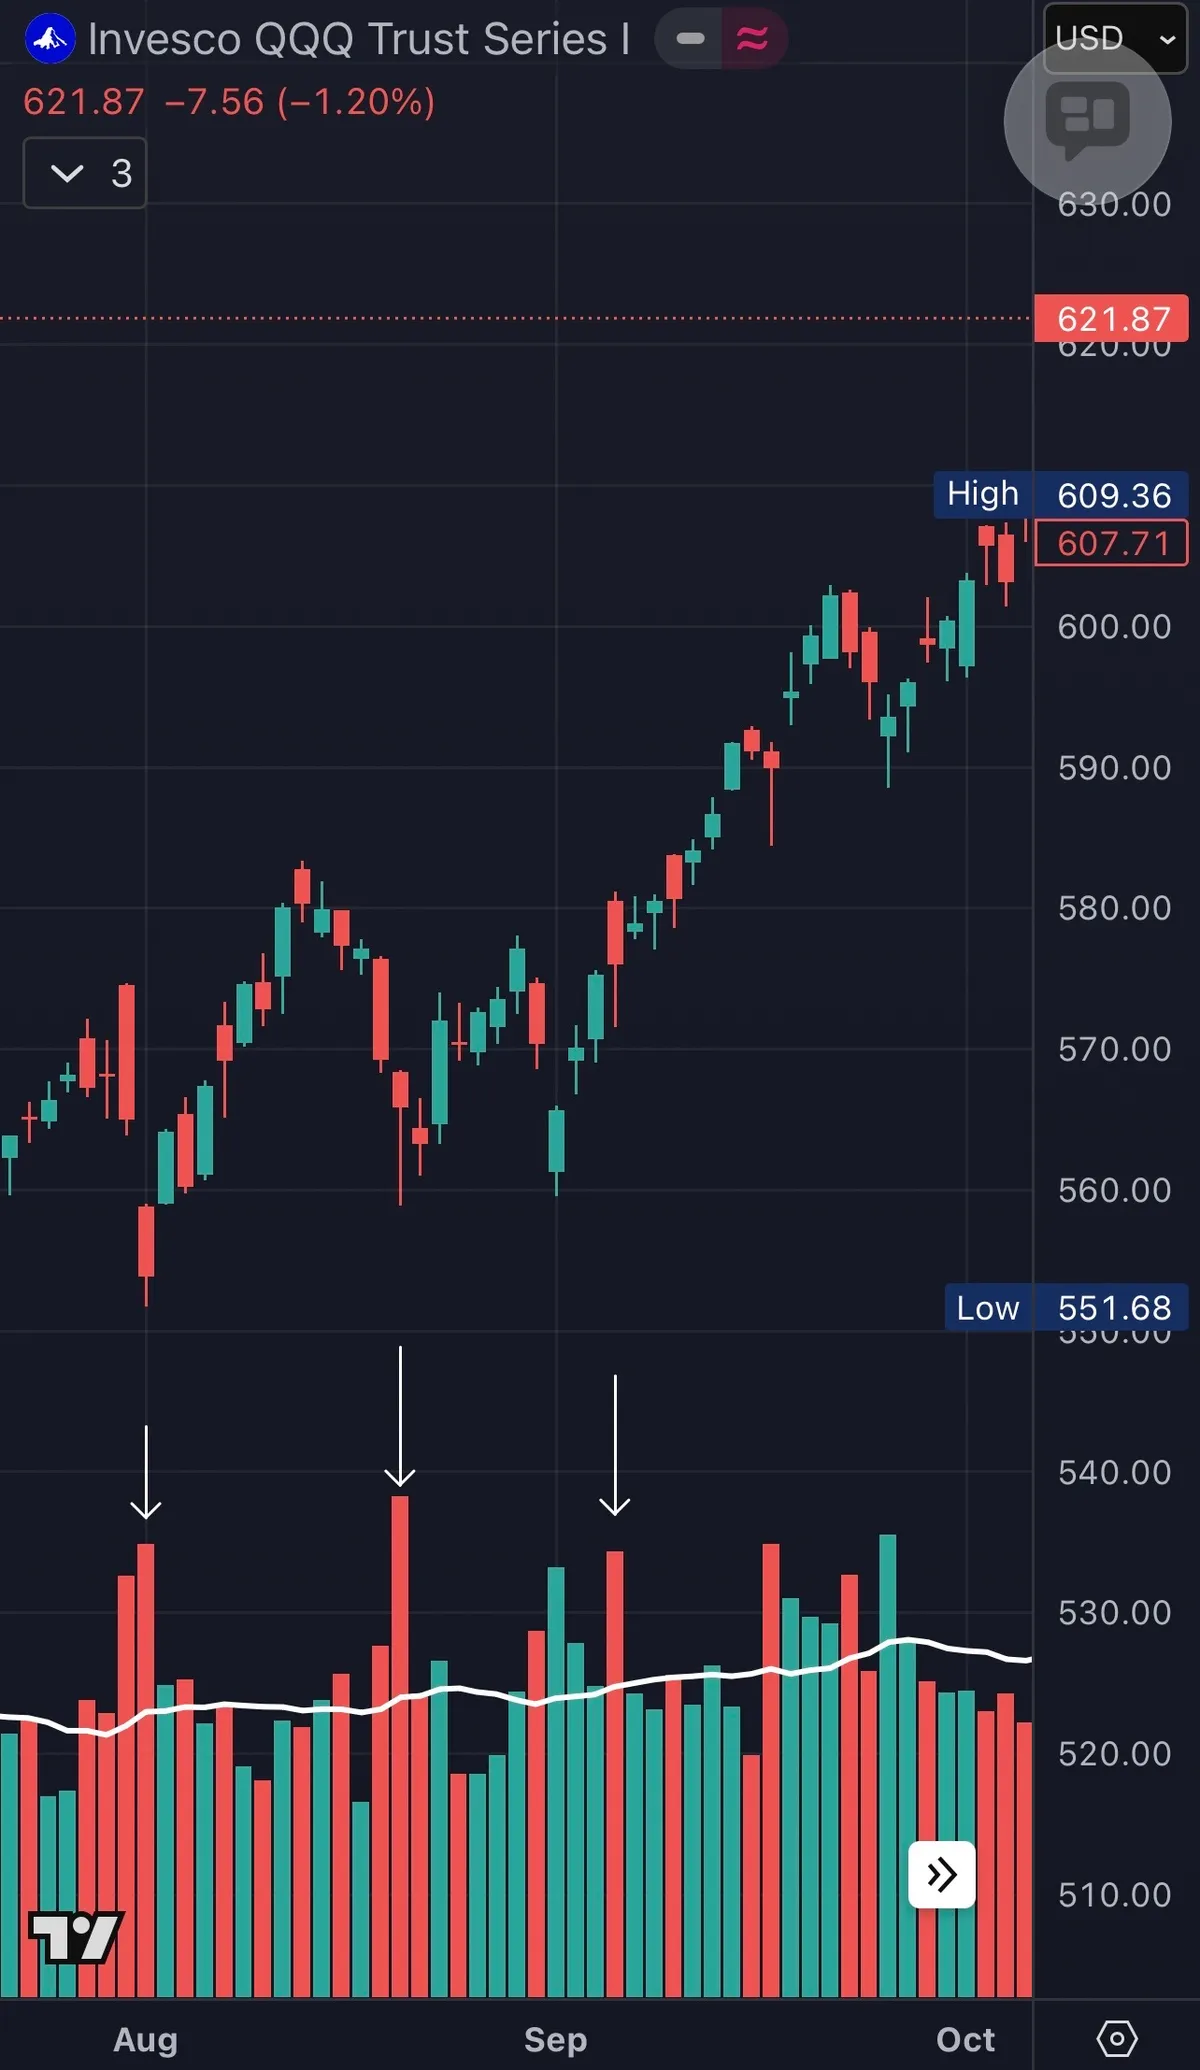
No, lighter volume on pullbacks would be ideal, but it is not required for index ETFs to continue higher.

Throughout this bull market, there have been many instances where volume expanded on pullbacks and price still resolved higher. Over the last couple of years, we have also seen consolidations where volume on down days was larger than volume on the breakout itself, yet price still moved higher. In many of those cases, volume increased as price advanced, just not to the same degree as it did on the pullbacks.

This is why volume must always be viewed in context. Index ETF volume is influenced by ETF flows, options hedging, rebalancing, and systematic strategies, which makes it noisier than volume in individual stocks.

The classic pattern of lighter volume on pullbacks and heavier volume on advances tends to appear more consistently in leading individual stocks, or when trading instruments like NQ futures on lower timeframes. On higher timeframes in strong index uptrends, price behavior and trend structure carry more weight than volume patterns viewed in isolation.

What matters most is when price begins to break character. That happens when price violates key support and fails to recover on heavy volume. In that scenario, selling pressure is gaining control and risk should be reduced or avoided.

During consolidations that are choppy and whipsawing, where down days show higher volume, it is important to remember that volume is only one input. Price remains the primary guide. How to handle these periods is personal and depends on where you are in your trading process. There are multiple valid approaches. Some traders may choose to stay in cash if the action feels uncomfortable. Others may hold due to a solid profit cushion and having already taken partial profits. Some will continue buying pullbacks and selling some into strength until the market ultimately decides direction.

The goal is not to predict outcomes. The goal is to align with price, manage risk, and let the market confirm when conditions change.
View on Substack ↗

You Don’t Lose Money From Bad Analysis. You Lose Money From Needing to Be Right.

Marty Schwartz turned $40,000 into over $20 million trading futures while never experiencing more than a 3% drawdown.

Let that sink in.

In Market Wizards, he said something that should make every over-analytical trader uncomfortable:

“I used fundamentals for nine years and got rich as a technician.”

Before that transformation, Schwartz was an analyst. And he openly admitted that his obsession with analysis and being right is exactly what held him back.

That lesson matters.

Yes, I personally conduct top-down and bottom-up analysis to understand the broader environment (the M in CANSLIM). After 20 years in the market, that context helps me, but here’s the honest truth:

It’s not required to be successful.

For beginners, individual stocks will guide you far more than macro forecasts ever will. Strong price action, relative strength, earnings momentum, and clean technical structures do most of the heavy lifting.

Most traders don’t struggle because they lack information. They struggle because of emotion and overanalysis.

They spend weeks researching a name. They build a narrative. They fall in love with their thesis and when price moves against them, they can’t cut the loss because doing so would mean admitting they were wrong.

That’s how small losses turn into big ones.

You don’t need to be an economist. You don’t need to predict markets. You don’t need to be right.

You need low-risk, high-reward setups, disciplined execution, and the humility to step aside when conditions aren’t favorable.

When in doubt, there is absolutely nothing wrong with being in cash.

The number one rule has never changed:

Don’t lose money.

Everything else is secondary.

View on Substack ↗

This Is What a Stage 4 Decline Looks Like – A Bitcoin Example

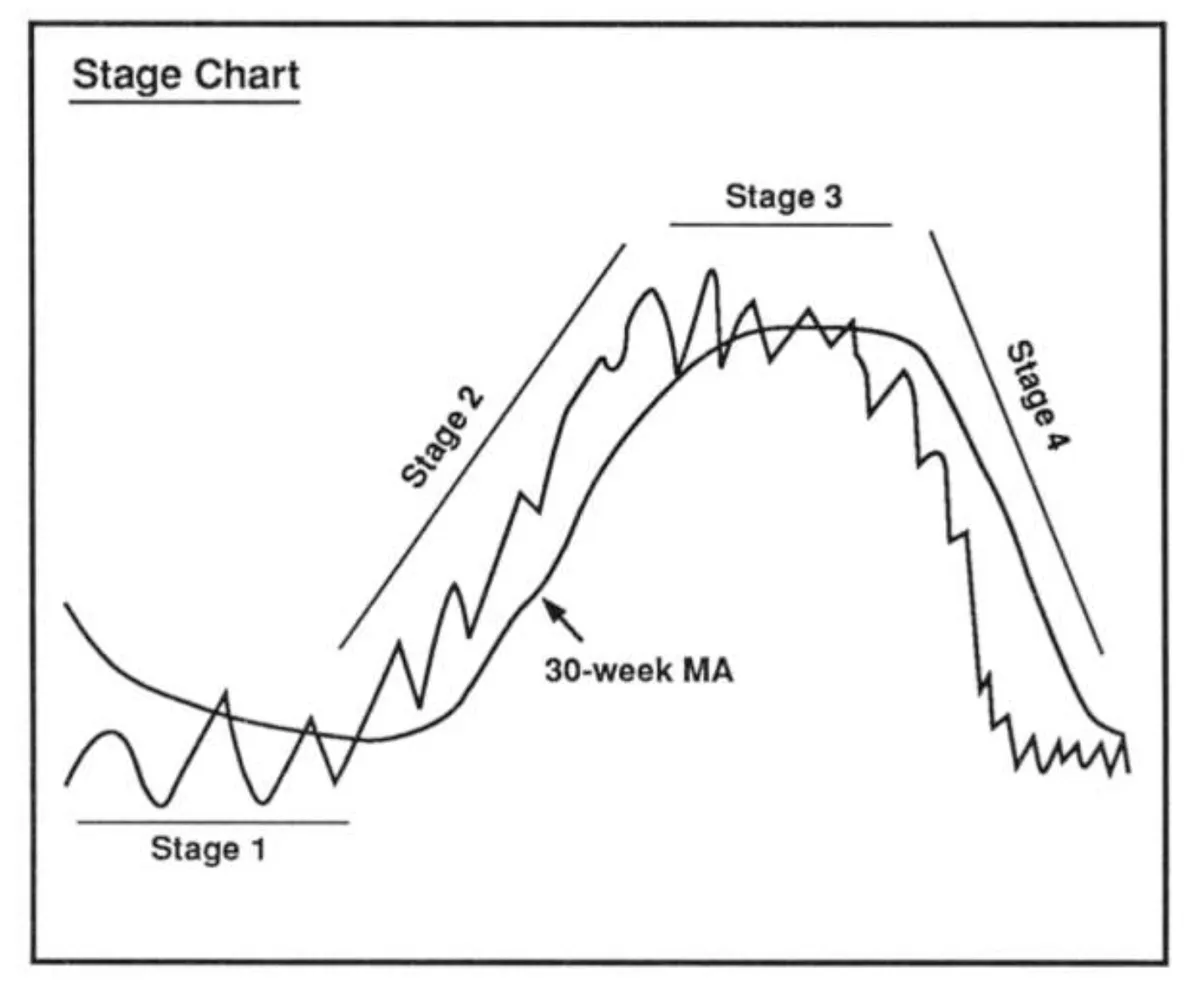
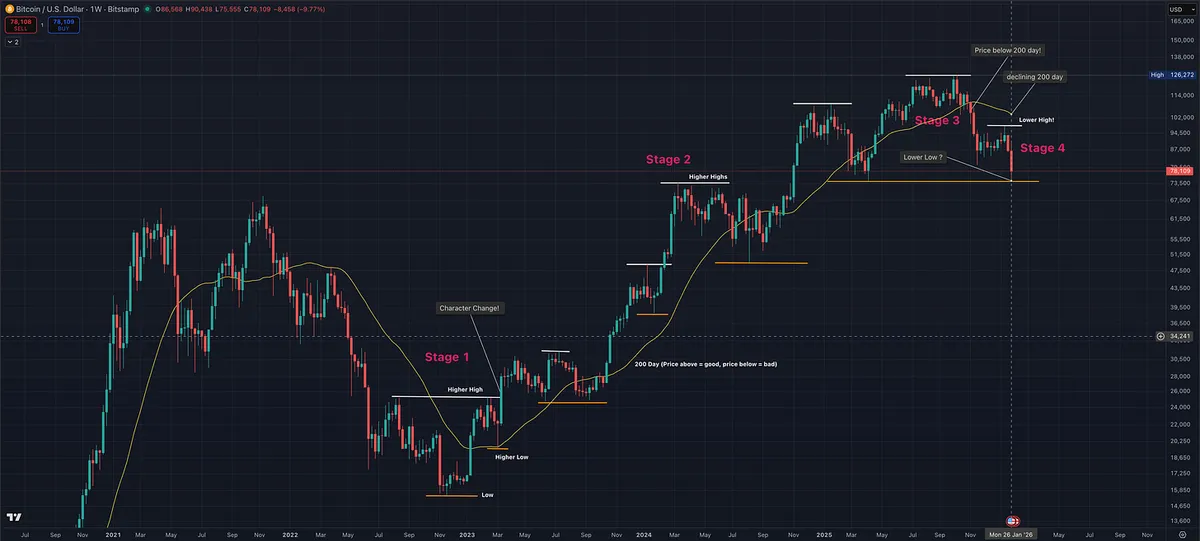
This chart is a textbook example of Stan Weinstein’s Stage Analysis in action.

Despite continued dip buying, the crypto market structure has clearly deteriorated.

Here’s what matters, not the narrative:

  • Price is below the 200-day moving average

  • The 200-day moving average is declining

  • A lower high has already formed

  • Lower lows are now developing

That combination defines a Stage 4 environment.

Stage 4 is not where leadership forms. It is where downside risk expands, rallies fail, and “cheap” prices often continue to get cheaper. This is not what we buy.

What makes this a powerful teaching example is the psychology. Even as structure breaks down, many participants continue to buy dips, anchored to prior highs rather than current trend. Price does not care about narratives. Structure tells the truth.

This is exactly why stage, trend, and long-term moving averages matter. They help keep you aligned with probability instead of emotion.

If price can reclaim the 200-day and the trend begins to repair, the conversation changes. Until then, this remains a Stage 4 decline, and risk should be treated accordingly.

View on Substack ↗

How to Use Relative Strength to See Where Institutions Are Moving

One mistake I see often is focusing only on what already has high relative strength.

That’s useful, but it’s not enough.

What matters just as much is acceleration and deceleration.

When an area shows improving relative strength across multiple timeframes, that often signals new capital flowing in, not just a crowded trade. By contrast, groups that still rank high but begin to lose momentum across shorter timeframes are often early signs that leadership is tiring.

Relative strength is most powerful when used as a trend-of-a-trend tool, not a scoreboard.

Instead of asking, “What’s at the top right now?” A better question is, “Where is money starting to flow?”

That shift in perspective can help you:

  • Find emerging leadership earlier

  • Avoid overstaying extended themes

  • Align with institutional rotation rather than chasing headlines

This is exactly how I use the Relative Strength Dashboard when building and refining the watchlist.

View on Substack ↗

This week’s Big Picture Market Pulse is live.

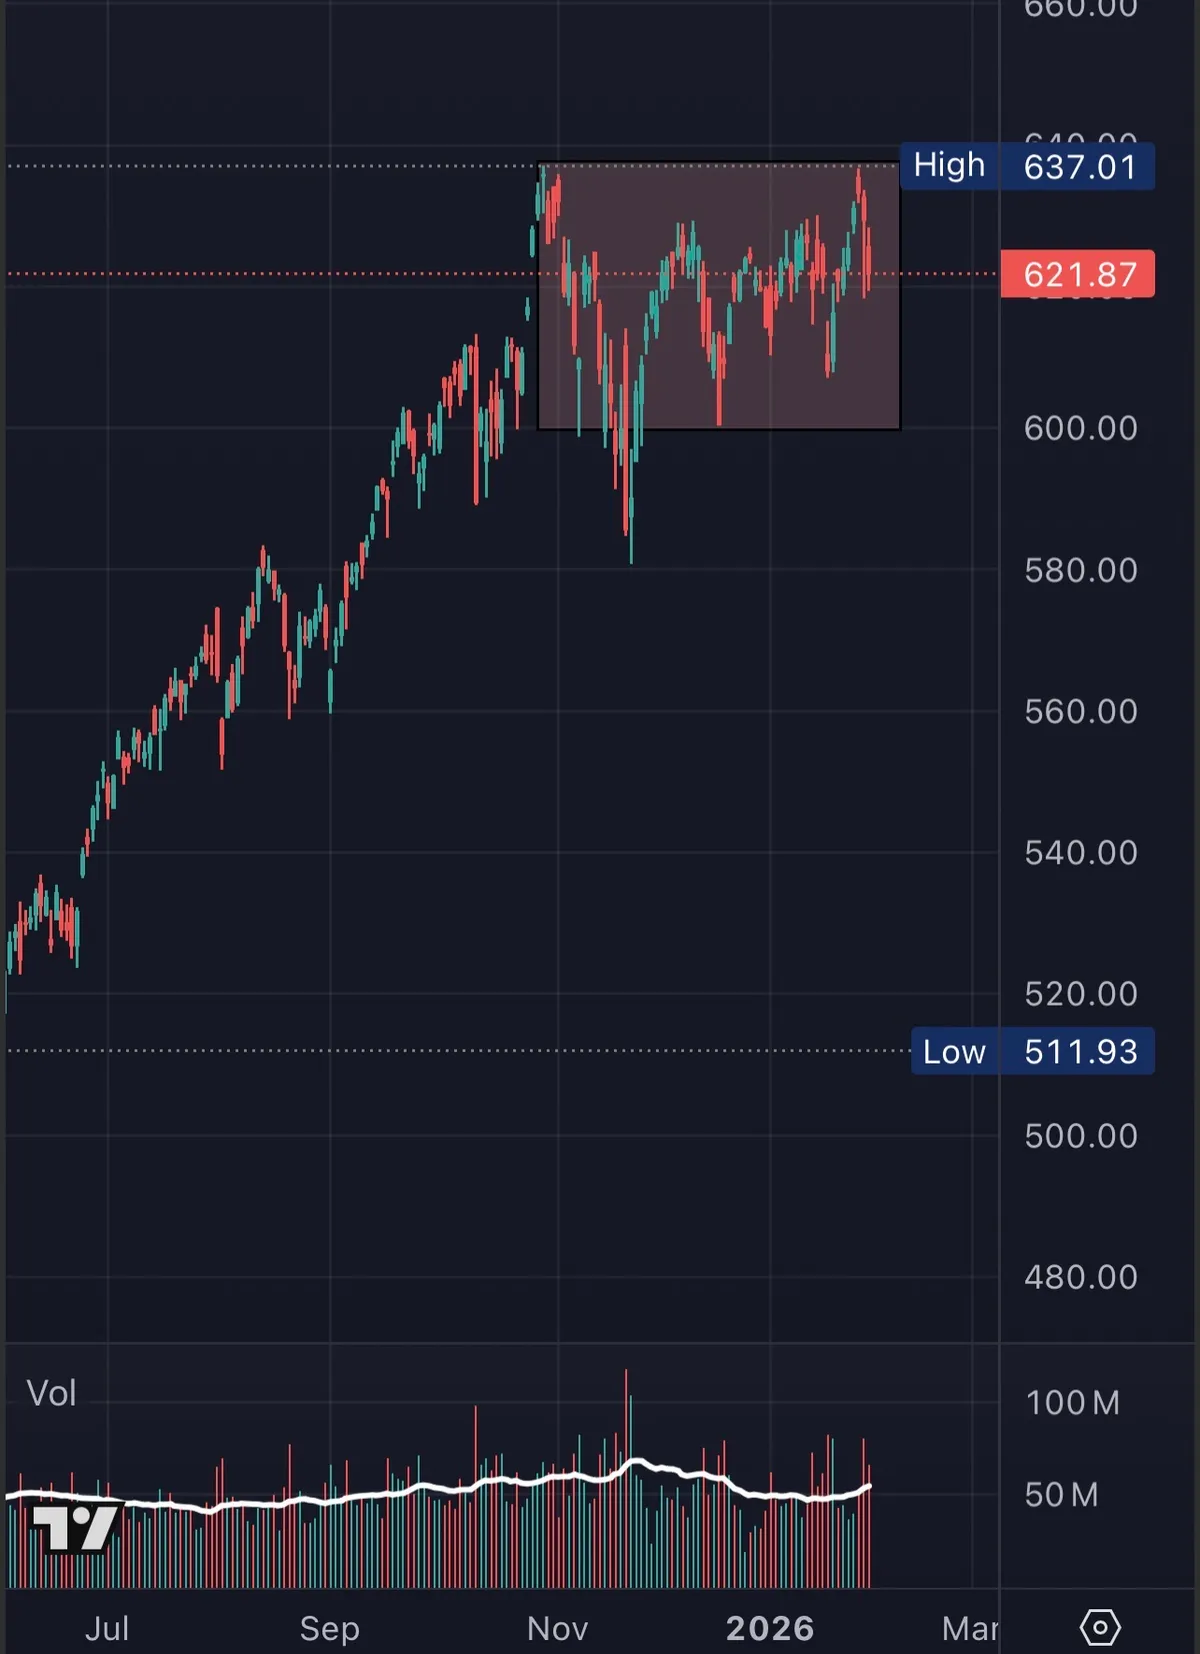
Indexes remain near highs, but conditions under the surface continue to frustrate traders. Failed breakouts, rapid rotation, and a classic digestion phase have made patience more valuable than activity.

In this update, I break down:

  • What the index structure is really telling us

  • Why this is still a constructive but selective environment

  • How to think about exposure, risk, and cash right now

  • What this means going into stock selection and watchlist building

This is not about predictions. It’s about aligning process with the current market regime and avoiding death-by-a-thousand-cuts trading.

Paid subscribers can read the full weekly update below 👇

https://tradingmomentum.substack.com/p/big-picture-market-pulse-february

On SubstackBig Picture Market Pulse | February 1, 2026
View on Substack ↗

Funny What People Are Afraid to Invest In

I find it interesting how hesitant people are to spend money on trading education, yet they’ll think nothing of spending $100,000 on an MBA.

I say this as someone who actually has one.

I earned my MBA, and it absolutely had some value, but if I’m being honest about return on investment, it doesn’t come close to what I’ve made from the roughly $5,000 I spent on Mark Minervini’s Master Trader Program.

That program taught me practical, market-tested skills. Risk management. Process. Discipline. How price and volume actually work in real time. Things you can apply immediately and compound over years.

Most people aren’t afraid of spending money. They’re afraid of accountability.

An MBA feels safe. It comes with structure, credentials, and a clear path. Trading education is uncomfortable because results are personal. There’s no diploma to hide behind. Either your decisions improve or they don’t.

To be clear, there’s no affiliate link, no referral, and nothing for me to gain by saying this. I’m just stating what’s been true in my own experience.

Markets don’t reward titles.

They reward skill, discipline, and execution.

Education that sharpens decision making and risk management often delivers far higher returns than most traditional degrees, if you’re willing to do the work.

The real risk isn’t investing in yourself.

It’s avoiding it.

View on Substack ↗

You Don’t Need a Lottery Ticket to Get Rich in the Market

A lot of people are chasing parabolic moves, hoping to strike it rich on one or two big bets.

That’s not how professionals do it.

They’re willing to gamble large chunks of capital on a single idea. Bitcoin. Silver. A speculative biotech. The next hot AI name. If it works, they feel like a genius. If it doesn’t, the account takes real damage.

This is not a professional approach.

William O’Neil studied the biggest winners in history, but what often gets overlooked is that he didn’t build his fortune on home runs alone. He had plenty of base hits and doubles along the way.

The big winners get written about.

The consistency is what built the wealth.

You can get extremely wealthy compounding many trades where you risk 5% to make 15–20%. You don’t need to be in the parabolic phase. You don’t need to go all in. You don’t need to swing for the fences.

Consistency plus asymmetric risk-reward does the heavy lifting.

Study the great traders and you’ll notice something important. None of them made it from one or two trades. They stacked wins over time. They accepted drawdowns. They stayed disciplined. And yes, the big winners showed up occasionally too.

But they never relied on them.

Treating the market like an easy lottery ticket isn’t just lazy, it’s expensive. This game rewards patience, process, and compounding. Not hope.

The goal isn’t one life-changing trade.

The goal is a repeatable edge that compounds.

That’s how real wealth is built.

View on Substack ↗

Never Argue With Price

William O'Neil studied the biggest winning stocks going back to the 1880s and built the CANSLIM framework from that research.

What most people miss is this:

those stocks met the criteria before their big runs, not after.

Even then, many stocks that look perfect on fundamentals still fail.

In strong markets, even elite CANSLIM traders might win 60% of the time. More often it’s 40–50%. In poor markets, it’s even less. And yet, fortunes have been made winning just 35–40% of trades.

So why does the system fail for so many?

Because they don’t cut losses fast.

O’Neil understood that price action is truth. Fundamentals help guide you toward potential winners, but they guarantee nothing. Price is the final judge.

As he said:

“There are no good stocks unless they go up in price. If they go down instead, you have to cut your losses fast.”

That’s why charts and price action always come first.

Another legendary trader with a very different style came to the exact same conclusion. Ed Seykota built his success around trends and risk control, not prediction.

He said:

“In order of importance to me are:

(1) the long-term trend,

(2) the current chart pattern, and

(3) picking a good spot to buy or sell.

Those are the three primary components of my trading. Way down in very distant fourth place are my fundamental ideas, and quite likely, on balance, they have cost me money.”

Different styles. Same truth.

Price is the most important factor because it reflects reality.

Charts tell you what institutions are actually doing.

Fundamentals explain stories. Price tells you whether they’re right.

Never argue with price.

Respect the trend.

Cut losses fast.

That’s how traders survive long enough to win big.

View on Substack ↗

How Professional Traders Handle Earnings Season

It’s earnings season, and you’ll see plenty of stocks setting up just days before their reports.

The chart looks great.

Price action is tight.

Earnings and sales estimates look strong.

And yet, most professional traders will pass. I do too.

Why? Because risk comes first.

Earnings are not a normal trading environment. They are a news event. Price can gap sharply higher, or it can gap down far beyond any logical stop. Once the report hits, you lose control of risk.

Yes, big gains are possible when earnings surprise to the upside. But large, instant losses are just as possible, and they have nothing to do with your setup or discipline.

That’s not trading. That’s gambling.

If you are already in a position heading into earnings, the smart move is risk reduction. Sell enough to lock in profit so a bad reaction cannot hurt you. If the stock reacts well, you still participate. If it doesn’t, you survive.

If you are not already in the stock, patience is usually the best decision.

This is how many top traders handle it. William O’Neil, Mark Minervini, David Ryan, and Dan Zanger don’t try to predict earnings. They let the report hit and then watch how institutions react.

What they look for is confirmation. A strong post-earnings move higher on heavy volume. Then a controlled pullback on lighter volume. That’s where risk comes back into your hands and where high-probability entries are found.

As Paul Tudor Jones said, “Never trade in situations where you don’t have control. I don’t risk significant amounts of money in front of key reports, since that is gambling, not trading.”

Risk first.

Let price confirm.

Opportunities always come back.

View on Substack ↗

Death by a Thousand Cuts

A lot of traders are getting chopped up trying to buy breakouts in this market.

Just look at the Nasdaq.

We’re not far from all-time highs, but the price action has been brutal. Tight ranges, failed moves, and constant reversals. That kind of environment is a killer for clean setups.

When breakouts stop working, forcing trades only makes it worse.

If you don’t have high-quality setups, the best position is cash. Patience is a position.

Listen to your trading. The market gives feedback every day. If your trades aren’t working, cut your size. If they keep failing, cut it again. Eventually, you may need to step aside completely.

When conditions improve, start back small. Let the market prove it’s ready. As setups begin to work again, then you gradually increase size.

Survival comes first. Opportunities always come back.

View on Substack ↗

How Most Traders Manage to Buy the Top and Sell the Bottom

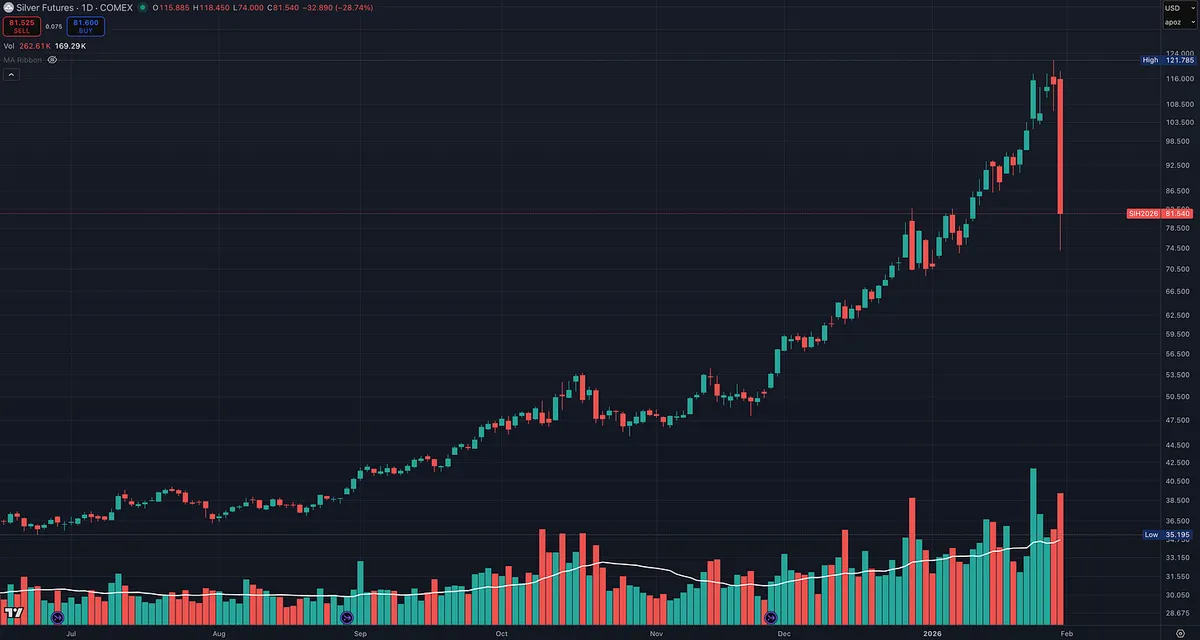
One of the most painful stories in markets plays out the same way every cycle, and silver is no exception.

Some traders sat on the sidelines for months. They watched price grind higher day after day. Eventually the move felt unbearable to miss, so they finally jumped in, usually near the highs.

Now price crashes down.

Instead of cutting the loss, they convince themselves it will come back. They tell themselves they’ll just wait it out. Maybe even add more lower to “get a better average.”

But this is how tops and bottoms are made.

Buying late strength turns into holding weakness. Hope replaces discipline. Rallies feel like confirmation, but they’re often just pauses before more downside.

Eventually, after weeks or months of frustration, the position is dumped near the lows. Not because the trader planned it, but because they’re exhausted. And that’s when the promise gets made: “I’m never trading silver again.”

This pattern shows up in every major market cycle.

It always has.

And it always will.

The lesson isn’t about silver.

It’s about respecting price, managing risk, and never letting emotion decide when you enter or exit.

View on Substack ↗

A Lesson From Silver

A good reminder on the dangers of buying blindly into parabolic moves.

Silver is down nearly 30% today.

Markets rarely go straight up forever. They usually climb the stairs on the way up and fall out a window on the way down.

Parabolic moves feel safest at the top because everyone agrees. That’s usually when risk is highest.

This is why cutting losses quickly matters. This is why chasing extended price action rarely ends well.

Strong trends reward patience on the way up. They punish complacency on the way down.

Respect risk. Always.

View on Substack ↗

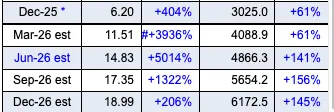
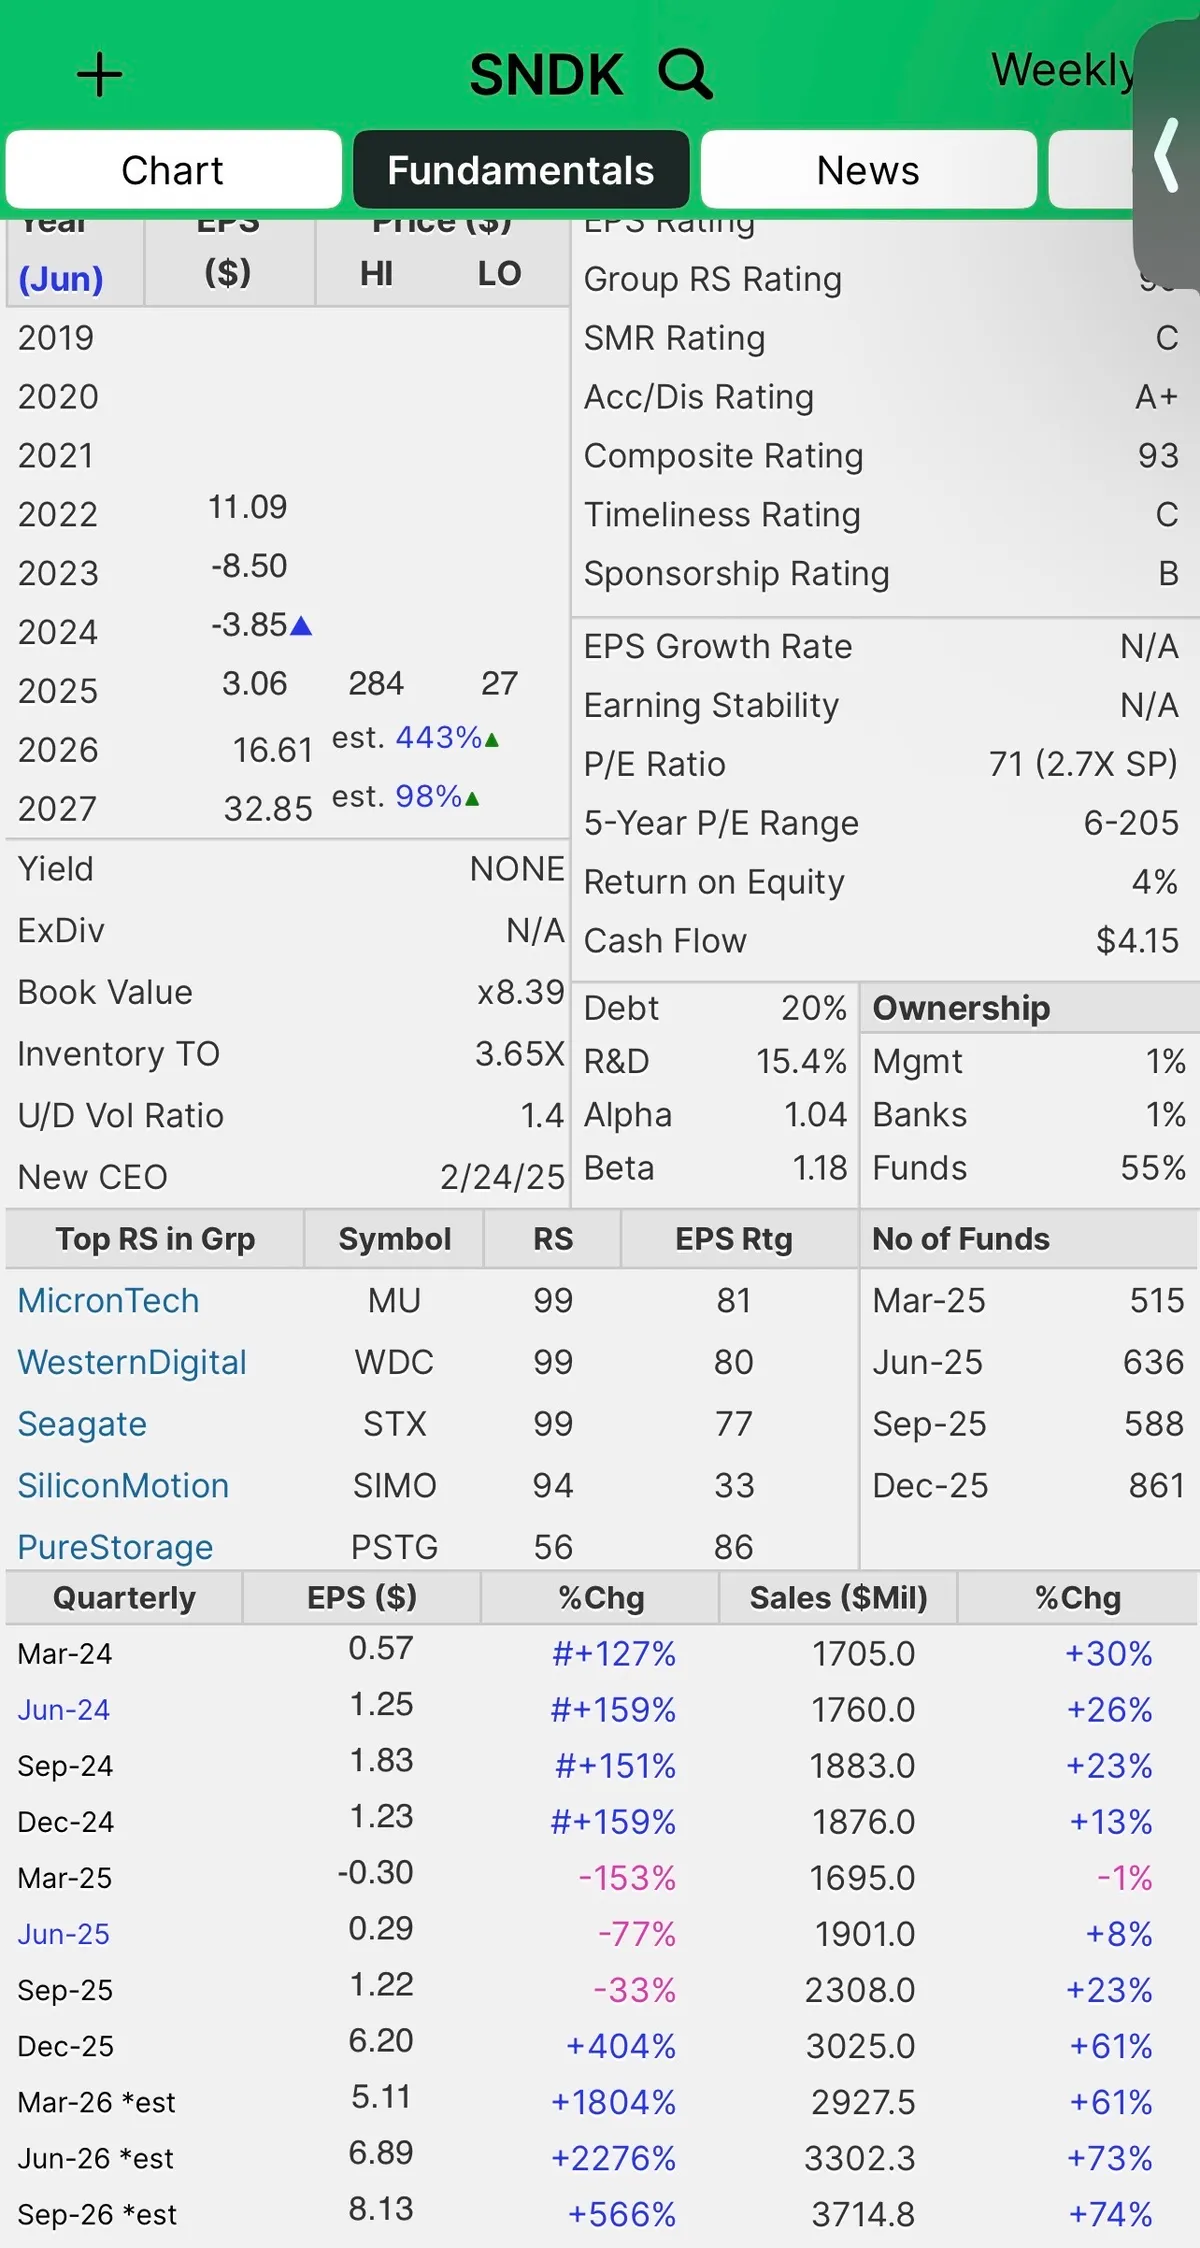
Look at Sandisk’s earnings and sales estimates heading into 2026.

This is a great reminder that markets are always looking forward, not backward.

The heavy buying in this stock didn’t start when the numbers looked good. It started much earlier, when earnings were weak and sales were just beginning to turn. Price and relative strength moved first. Fundamentals followed later.

That’s often how leadership develops.

By the time the estimates look obvious to everyone, a large part of the move may already be behind us… or it may still be early in a much bigger trend.

Only time will tell.

This is why price action, relative strength, and industry leadership matter so much. They often hint at what’s coming well before it shows up cleanly in the fundamentals.

View on Substack ↗

Different Entry Methods I Learned in Minervini’s Master Trader Program

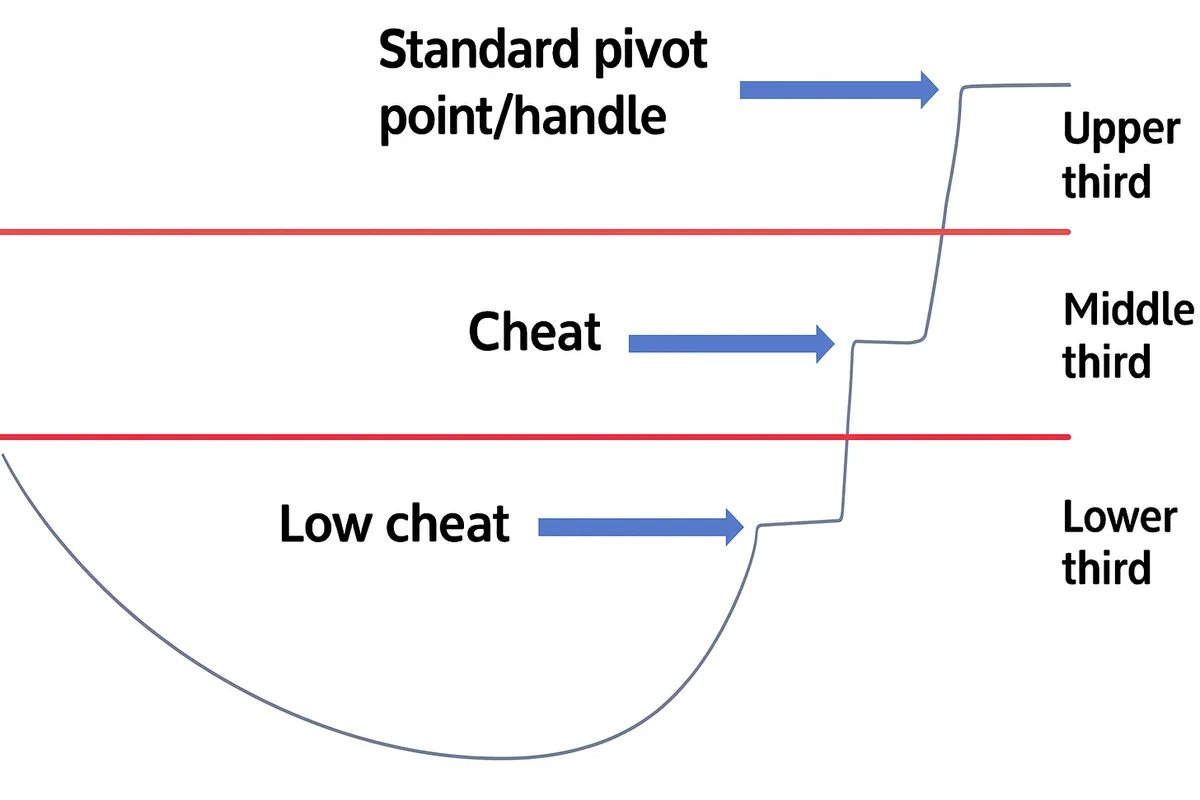
There isn’t just one way to buy a base.

Strong stocks often give multiple entry opportunities, each with a different risk profile.

Low cheat. Early entry near the lower third of the base. Highest failure rate, smallest dollar risk, biggest upside if it works.

Middle cheat. Entry as price tightens in the middle of the base. Better confirmation, still favorable risk to reward, often near moving average support.

Standard pivot or handle breakout. Upper third entry. Highest probability of follow through in the right market, but widest stop and most risk if it’s your first entry.

The key is not which entry is “best.”

The key is understanding how each one changes risk, position size, and trade management.

View on Substack ↗

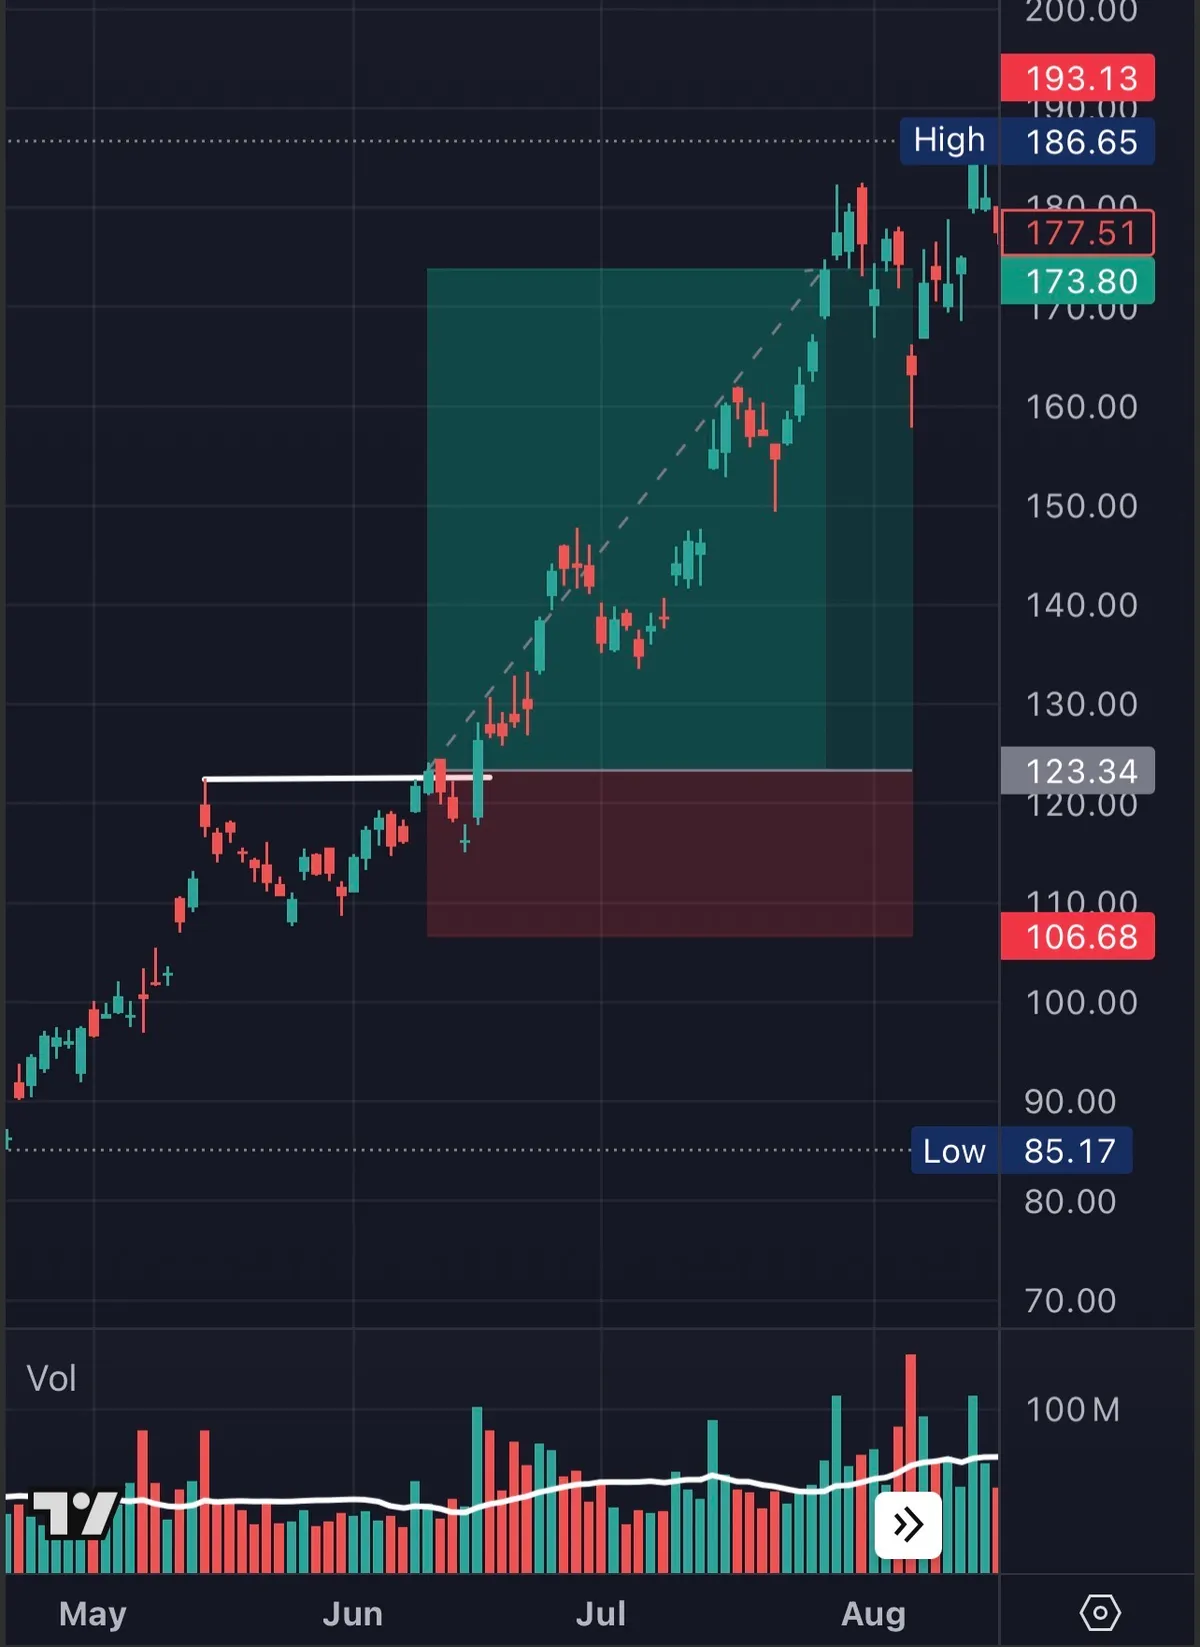
KLAC is a chart every trader should study.

Strong trend. 50 day acting as support. Higher lows. Tightening price. Low volume during consolidation.

This is what real leadership looks like.

But the most important lesson here isn’t the breakout itself. It’s how risk was structured and financed once the trade started working.

Selling some into strength, reducing risk, and letting the market pay for future risk is what separates professionals from everyone else.

I broke this down in detail here, including how traders like Soros and Minervini think about financing risk at the trade level:

https://tradingmomentum.substack.com/p/how-professionals-finance-risk-and

Save the chart. Study it. The framework matters more than the ticker.

ArticleHow Professionals Finance Risk and Why Most Traders Never Do
View on Substack ↗

Most Traders Manage Risk. Professionals Finance It.

Most traders think risk management is about being careful.

Professionals think about who is paying for the risk.

If you’re still risking your original principal on every trade, you’re playing a different game than the best traders in the world.

This is how traders like Soros and Minervini think about financing risk in real markets, using structure, partial profits, and positioning so the market pays for future risk.

Full breakdown with charts and examples here:

https://tradingmomentum.substack.com/p/how-professionals-finance-risk-and

ArticleHow Professionals Finance Risk and Why Most Traders Never Do
View on Substack ↗

Study This Chart. This Is Leadership.

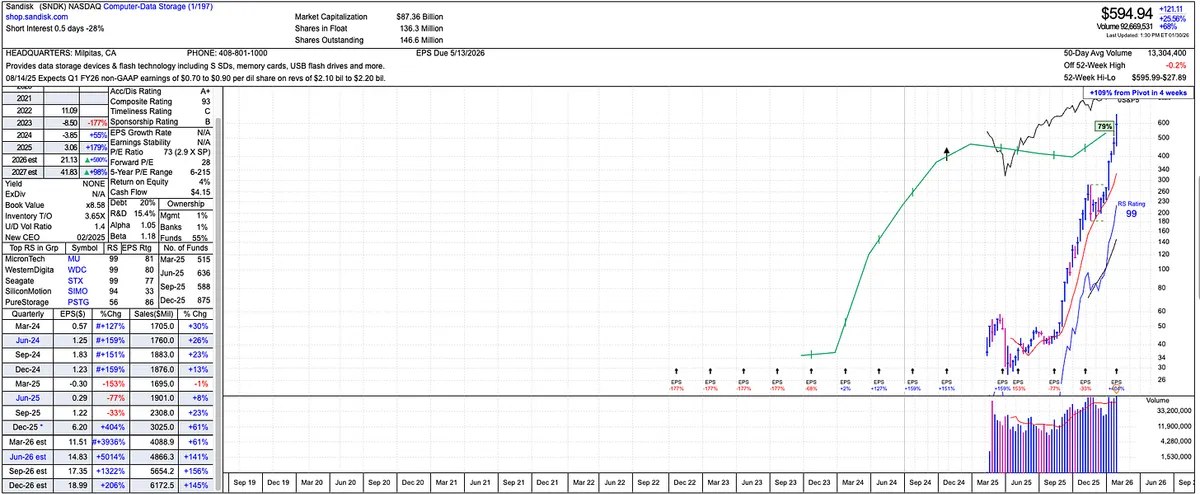
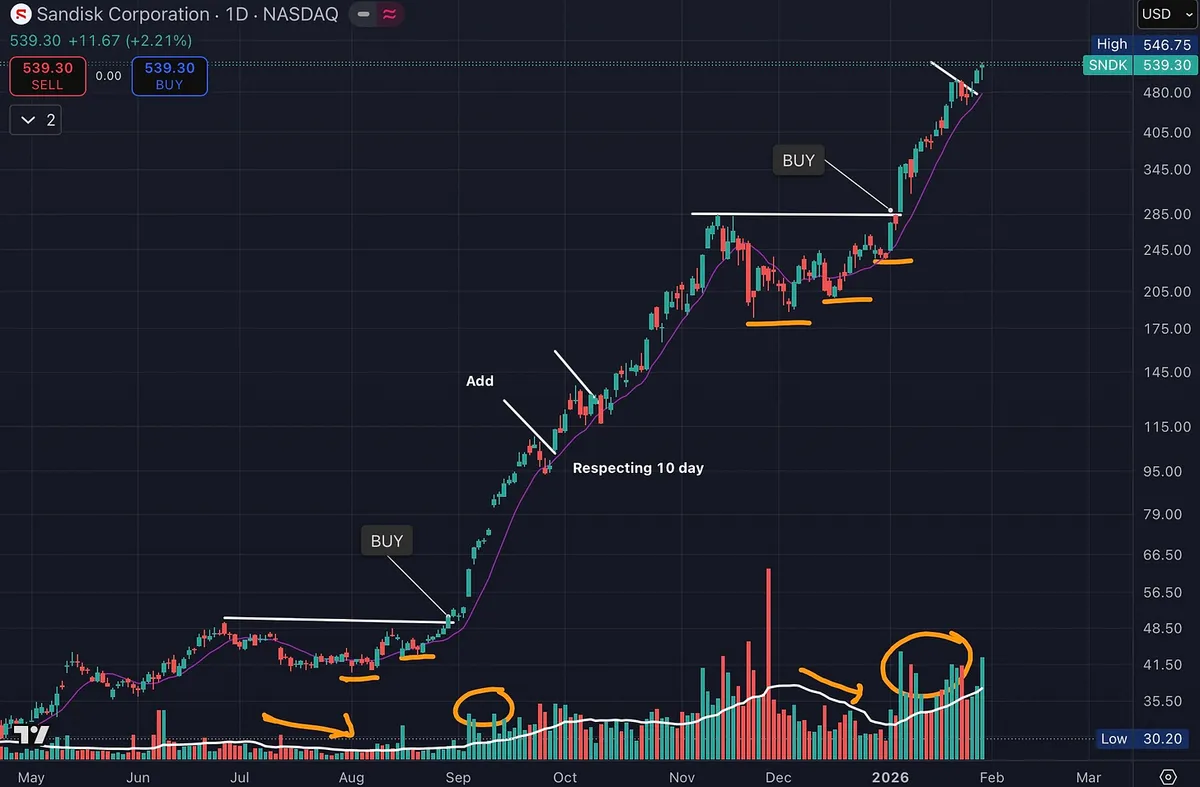
One area that has quietly dominated since the April correction is data storage, a key part of the broader AI theme.

SNDK is a great example.

The fundamentals are there.

High relative strength.

Earnings and sales acceleration.

Rapid increase in fund ownership.

But the real lesson is in the chart.

Price exploded higher on heavy volume. That’s institutional demand showing its hand.

Then price paused.

Volume dried up during consolidation. Pullbacks stayed shallow. The right side tightened up. Sellers stepped aside.

Price respected the 10-day moving average with a smooth, orderly advance. No volatility. No panic. Just controlled strength.

Then it did it again.

Another tight consolidation.

Another dry-up in volume.

Another expansion higher on strong volume.

This is textbook supply and demand in action.

Strong stocks don’t give back much. They move up, rest, absorb supply, and continue higher. That’s exactly what’s happening here.

And this wasn’t a one-off.

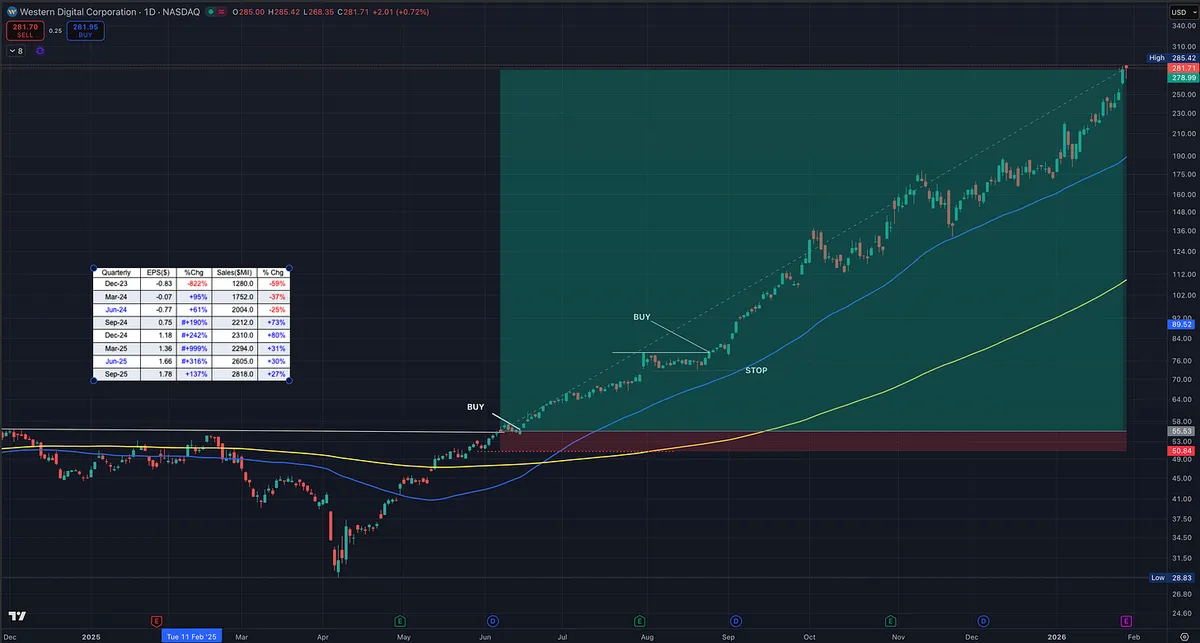
The category gave it away. Other data storage names were acting the same way. When multiple leaders in a group show identical behavior, pay attention.

This is the kind of chart that should be studied over and over.

Not because it’s perfect.

But because it clearly shows where risk is defined and why big trends are built the way they are.

Charts like this are how you learn to recognize real leadership.

Study this.

View on Substack ↗

When Volume Pauses After Power, Pay Attention

This is one of my favorite setups.

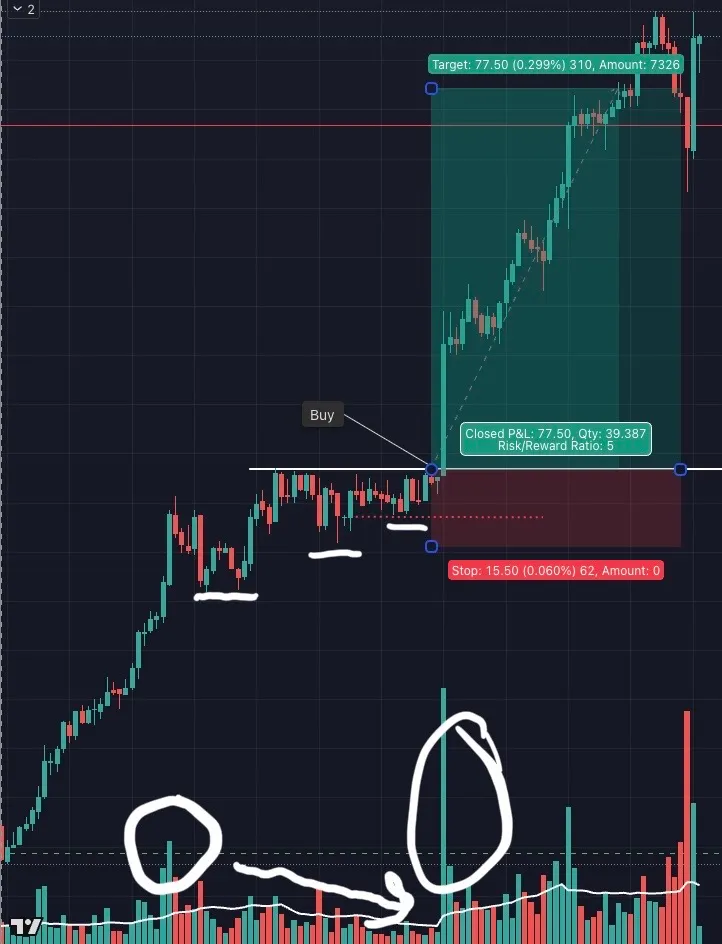
First, you get a strong upside move on expanding volume. That tells you demand is real. Institutions are involved.

Then price goes sideways.

But notice what changes.

Volume dries up during the consolidation. Pullbacks are shallow. Lows stay higher. Sellers are not aggressive. Supply is being absorbed.

This is where risk shrinks.

As price compresses near highs, you can enter near the prior higher low with a clearly defined stop. If you’re wrong, you’re out quickly. If you’re right, the breakout can travel far.

This aligns closely with Minervini style trend structure and volume price analysis.

Minervini looks for strength followed by tight price action and low volatility.

Volume price analysis looks for effort on the move up, then reduced effort as supply disappears.

Different frameworks. Same message.

Do these work every time? No.

Do I get stopped out? Yes.

Do some breakouts fail fast? Absolutely.

But when they work, they pay for the losers and then some.

Good trading is not about being right often.

It’s about structuring trades where risk is small and upside is asymmetric.

That’s what charts like this make possible.

View on Substack ↗

Breadth Improved. Setups Did Not.

Even with markets near all-time highs and breadth much better than earlier in this bull market, I’m finding fewer quality low-risk, high-reward setups.

Many of the strongest names in the hottest areas are already extended or no longer offering clean entry points. That shrinks the opportunity set, even in a “strong” market.

This is exactly why William O’Neil often said,

“The biggest gains are made in the first two years of a bull market.”

Those periods usually come right after bear markets or major corrections, like the one we saw in April. That’s when leadership resets, new areas emerge, and bases form that allow for clearly defined risk and outsized reward.

Right now, we have improving breadth but constant rotation. Since last fall, the major indexes have been choppy, with leadership shifting between sectors and market caps. That environment makes timing harder and reduces the number of clean growth entries.

High-flying areas like Metals & Mining look great if you’re already involved. But chasing extended leaders late in a move is very different from entering early, when risk is controlled and upside is asymmetric.

Strong markets don’t always produce great setups.

Sometimes patience is the trade.

View on Substack ↗

Don’t Reinvent the Market. Model What Already Works.

I did exactly what Dr. Van Tharp recommended. I modeled a system that already worked.

Instead of trying to reinvent trading and spending years trying to figure out the markets, I modeled a proven system. In my case, that was CANSLIM.

Once you start with something that already has an edge, the goal shifts. You are no longer guessing. You are proving positive expectancy. You are learning consistency. You are building skill within a framework that has already stood the test of time.

Only after that do small adjustments make sense.

That is how a system becomes personal. Not by guessing. Not by shortcuts. By first getting results.

This is exactly how many great traders developed.

William O’Neil learned from Jesse Livermore, Nicolas Darvas, and Gerald Loeb. Later, traders like Mark Minervini, David Ryan, Dan Zanger, and many other Investing Champions followed the same core principles. Over time, they drifted from doing things exactly like O’Neil.

That part matters.

They did not drift first. They learned first. They proved results first. Then they adapted.

There is a proven system for you to model. You do not need to waste countless years losing money trying to invent one from scratch. That painful path is not a requirement.

Dr. Van Tharp put it perfectly:

“Right now, I consider myself to be an expert modeler. By that, I mean that if someone can do something well, then I can figure out how they do it and teach those skills to anyone else.”

That is the real advantage beginners have, if they choose to use it.

Model what works. Prove consistency. Then make it your own.