Momentum Trading Strategy

Notes

Short lessons on momentum trading, every day.

Every note from Substack, in one place: risk, setups, leading stocks, market conditions and the mindset behind them. Search them, browse by topic, or filter by stock.

Showing 941–960 of 1230 notes

View on Substack ↗

A Hard Truth About Trading

“Win or lose, everybody gets what they want out of the market. Some people seem to like to lose, so they win by losing money.”

— Ed Seykota

This quote isn’t about intelligence or strategy. It’s about behavior.

Some traders say they want to make money, but their actions say otherwise. They ignore risk, refuse to cut losses, chase excitement, or need to be right more than they need to be profitable.

The market doesn’t reward opinions or ego. It rewards discipline, self-awareness, and the ability to do the boring things consistently.

If you’re losing money, it’s worth asking a hard question: Are your actions aligned with what you say you want from the market?

Because the market will always give you exactly what your behavior is designed to produce.

View on Substack ↗

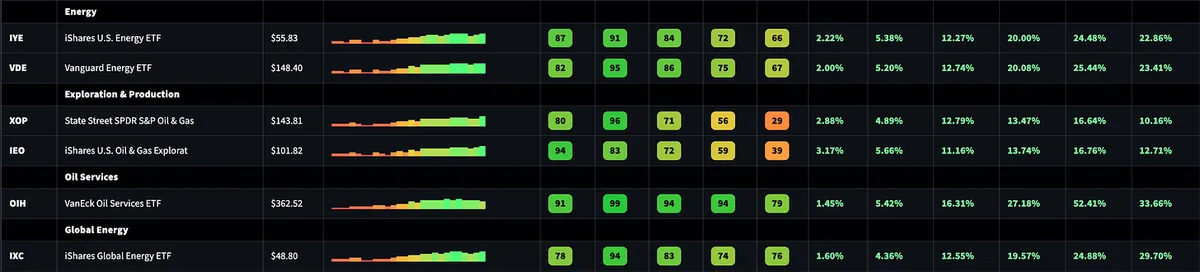
Energy. This Is the Place to Be.

While the broader market chops and pulls back, leadership is rotating, and energy continues to stand out.

Relative strength is strong across multiple energy ETFs and sub-groups, and this isn’t just a one-week move. We’re seeing consistent 1, 3, and 6 month relative strength.

View on Substack ↗

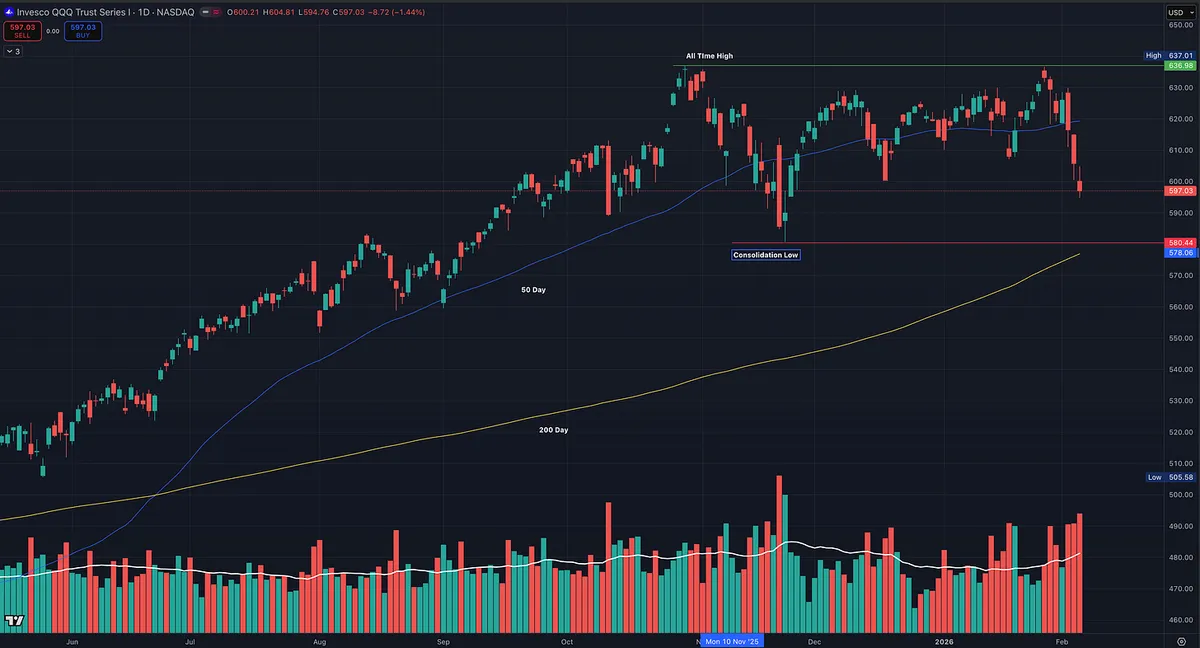
Rotation Example

When the market is down, stalling, or consolidating like this, leadership often shifts instead of disappearing.

QQQ looks heavy here and is pulling back within a broader consolidation. In environments like this, money tends to rotate out of higher-beta growth and into more defensive areas.

That’s why consumer staples often show relative strength during periods like this. As risk appetite narrows, capital looks for stability, not necessarily cash.

This is typical rotation, and the relative strength dashboard reflects it, with 3-month RS improving for consumer staples right around the start of the consolidation.

View on Substack ↗

Hello Banks. Big Week.

Banks are quietly having a very strong week, and more importantly, they’re showing real relative strength last 3 months.

When I look at my industry group dashboard, this isn’t just one ETF popping. It’s broad confirmation:

  • KBE, KRE, IAT all showing strong 1W and 3M relative strength

  • Momentum is improving, not deteriorating

  • This is what early rotation and leadership expansion looks like

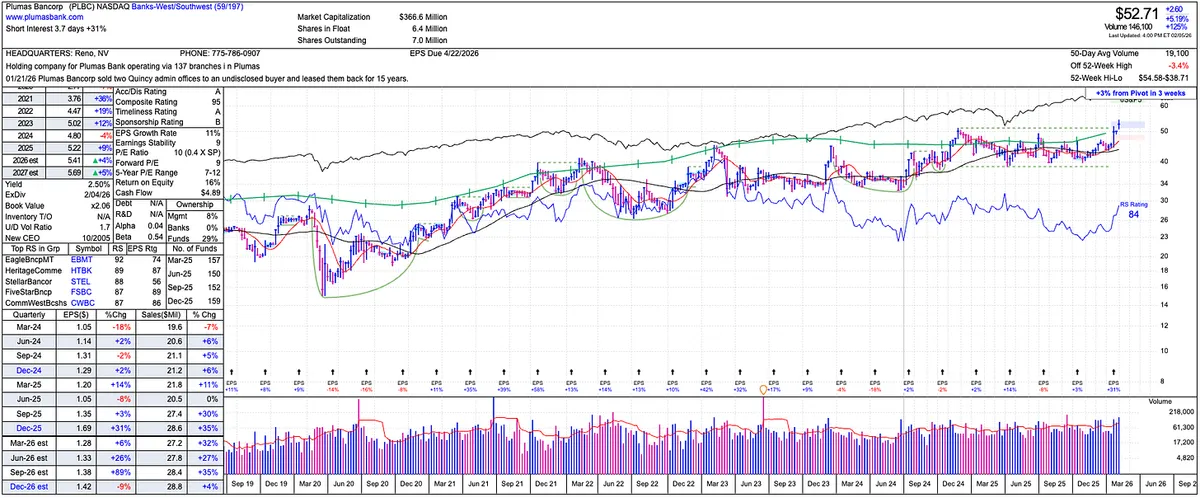
A Stock Example: PLBC

Plumas Bancorp (PLBC) is a good example of how this plays out at the stock level.

  • Small-cap regional bank

  • Strong composite and RS ratings

  • Breakout from consolidation on good earnings

  • Recently pushed to new highs while the group strengthens

  • RS line confirming the move

View on Substack ↗

The One Stock Filter Behind Almost Every Big Winner

“From the early 1950s through 2008, the average RS Rating of the best performing stocks before their major run ups was 87. In other words, the best stocks were already doing better than nearly nine out of ten others when they were starting out on their most explosive advance yet.” — William O’Neil

👉 Read the full post here: https://tradingmomentum.substack.com/p/why-relative-strength-is-the-fastest

ArticleWhy Relative Strength Is the Fastest Way to Find Big Winning Stocks
View on Substack ↗

Most traders don’t struggle because they can’t find setups.

They struggle because they spend their time studying stocks that were never leaders to begin with.

In the new post, I break down what relative strength actually means, why it has nothing to do with RSI overbought or oversold indicators, and why nearly every big winning stock in history was already outperforming the market before the move started.

I also walk through my top down, bottom up process, how I use relative strength dashboards and stock scans to narrow thousands of stocks into a short watchlist, and how I track acceleration and deceleration to spot emerging leaders and avoid late stage names.

It’s the exact framework and screener I use each week to stay aligned with market leadership.

If you want to improve the quality of stocks you focus on and stop wasting time on laggards, this post will help.

👉 Read the full post here (paid subscribers):https://tradingmomentum.substack.com/p/why-relative-strength-is-the-fastest

ArticleWhy Relative Strength Is the Fastest Way to Find Big Winning Stocks
View on Substack ↗

The One Stock Filter Behind Almost Every Big Winner

One of the most important insights William O’Neil ever shared is this:

“From the early 1950s through 2008, the average RS Rating of the best performing stocks before their major run ups was 87. In other words, the best stocks were already doing better than nearly nine out of ten others when they were starting out on their most explosive advance yet.”

That single statistic explains why relative strength matters so much.

In the new post, I break down what true relative strength actually is, why it has nothing to do with RSI, and how I use it to identify leaders early, track acceleration and deceleration, and build high quality watchlists.

👉 Read the full breakdown here: https://tradingmomentum.substack.com/p/why-relative-strength-is-the-fastest

ArticleWhy Relative Strength Is the Fastest Way to Find Big Winning Stocks
View on Substack ↗

Just Like Stocks Follow the Market, They Follow Their Industry Group

When an industry group breaks down, it tends to drag everything with it, just like when the market breaks down.

When the market takes a hit, most stocks go with it, the same thing happens at the industry group level.

When an industry group gets hit hard, it usually brings down even the best names.

This is something a lot of traders underestimate.

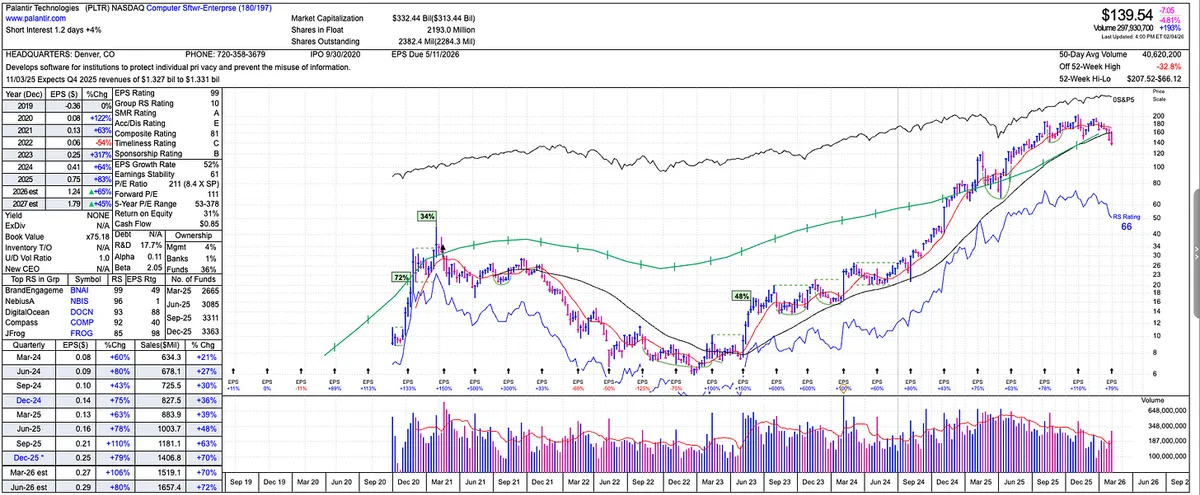
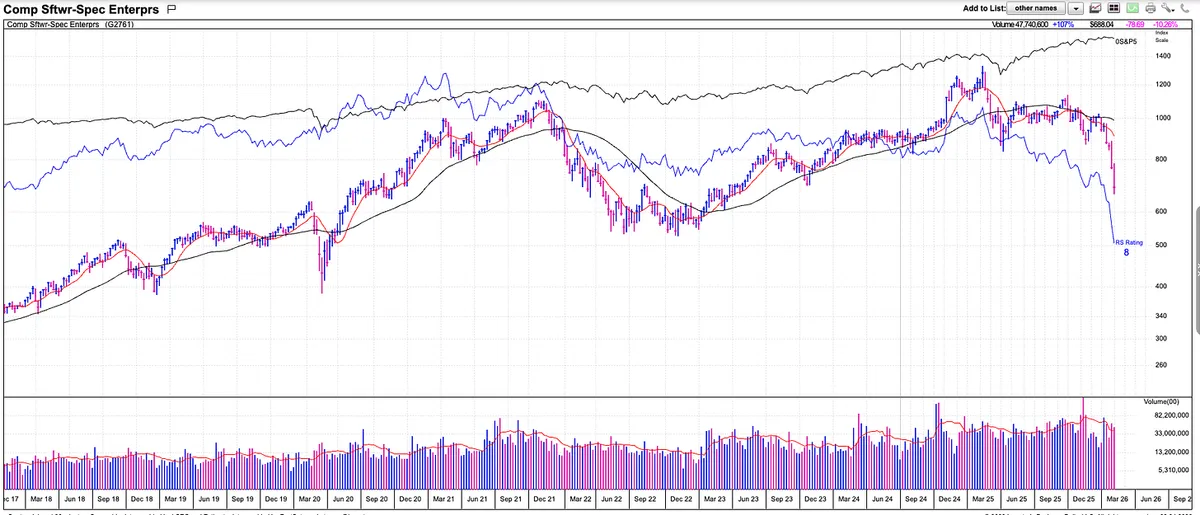
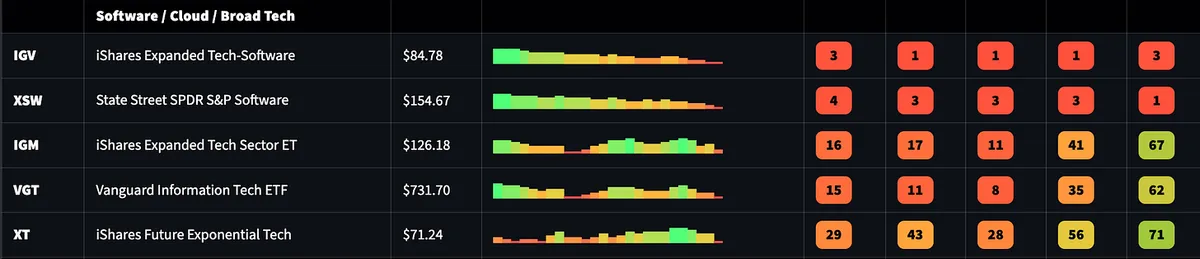
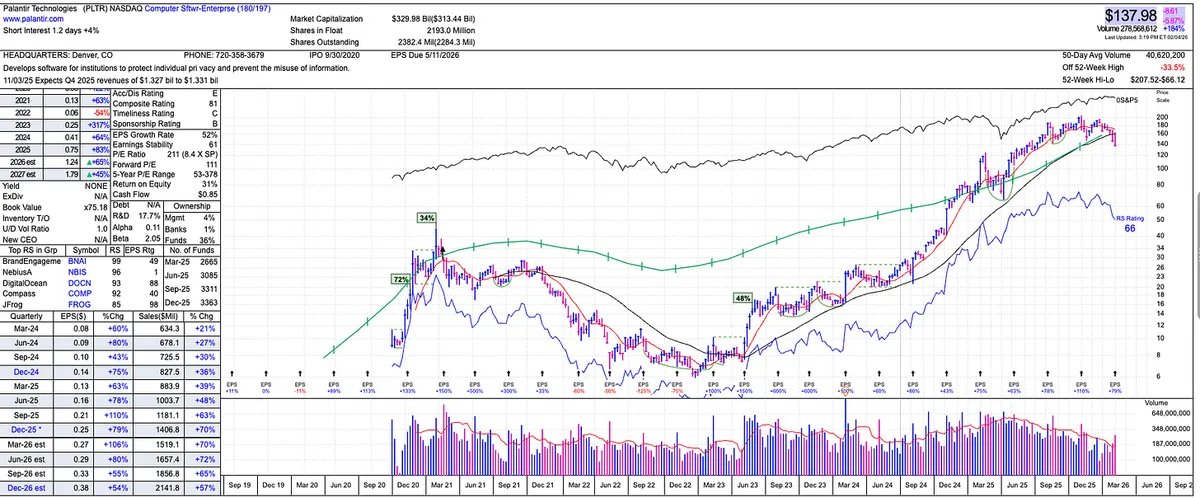
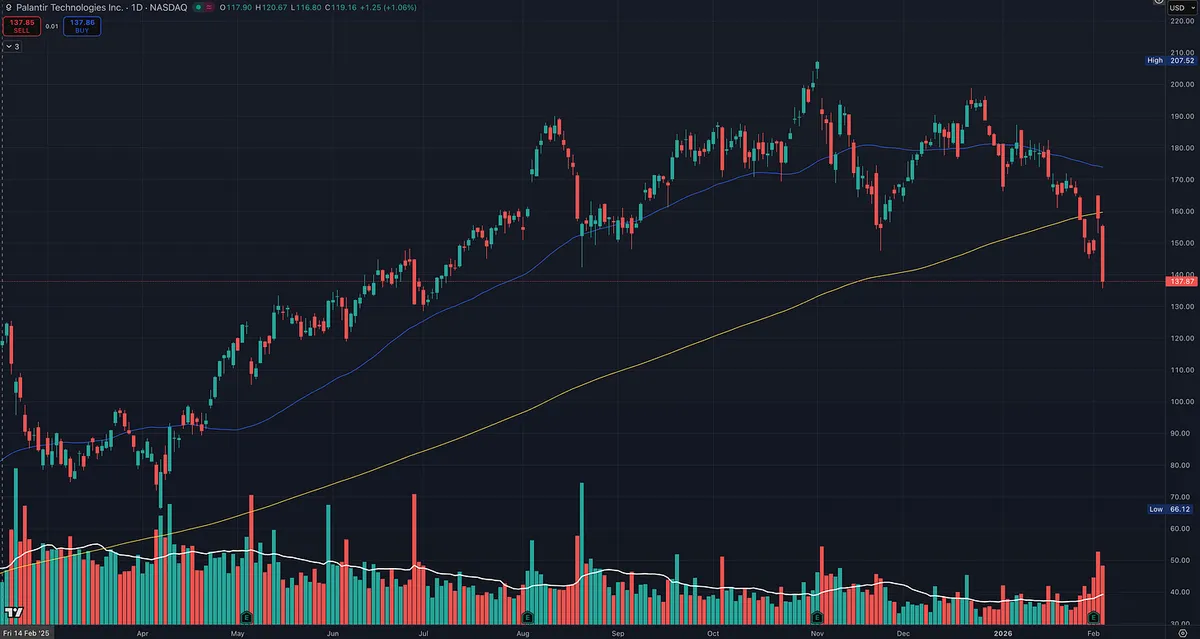
A perfect example right now is PLTR and the broader computer software group.

PLTR is a high quality company with strong fundamentals and long term potential. It was an amazing stock to be in during the uptrend, but once the software group started to lose relative strength and roll over, PLTR followed. Sometimes its the big name stock that brings down the industry group and sometimes its the group bringing down the stock. Regardless, you should know this relationship.

View on Substack ↗

Bottom-Up, Top-Down Analysis to Spot New Leading Industry Groups

Stocks Speak First. Industry Groups Confirm.

One of the most overlooked things in the market is understanding bottom up, top down industry group analysis.

Just like individual stocks tend to lead the indexes, industry groups tend to reveal themselves through individual stock action before it is obvious on any dashboard or scan.

In a bull market, you will often see stocks starting to act right before the indexes fully turn higher. Strong price action shows up first at the stock level.

The same thing happens on the downside.

During market breakdowns, stocks start to roll over before the indexes do. You see failed breakouts, loss of trend, and relative weakness in individual names well before the damage becomes obvious in the averages.

Industry group leadership works the same way.

When I am scanning, I often notice multiple stocks from the same industry group setting up at the same time. Strong trends. High relative strength. Tight consolidations. Clean pullbacks.

At that point, I am not even thinking about the industry group ranking yet.

The stock action comes first.

Later, when you look at a relative strength dashboard or run an industry level scan, that same group suddenly shows up as a leader.

This is why I spend so much time scanning individual stocks.

If you pay attention to what stocks are doing underneath the surface, you see leadership forming in real time.

View on Substack ↗

PLTR Is a Great Company. Right Now It Is Not a Great Stock.

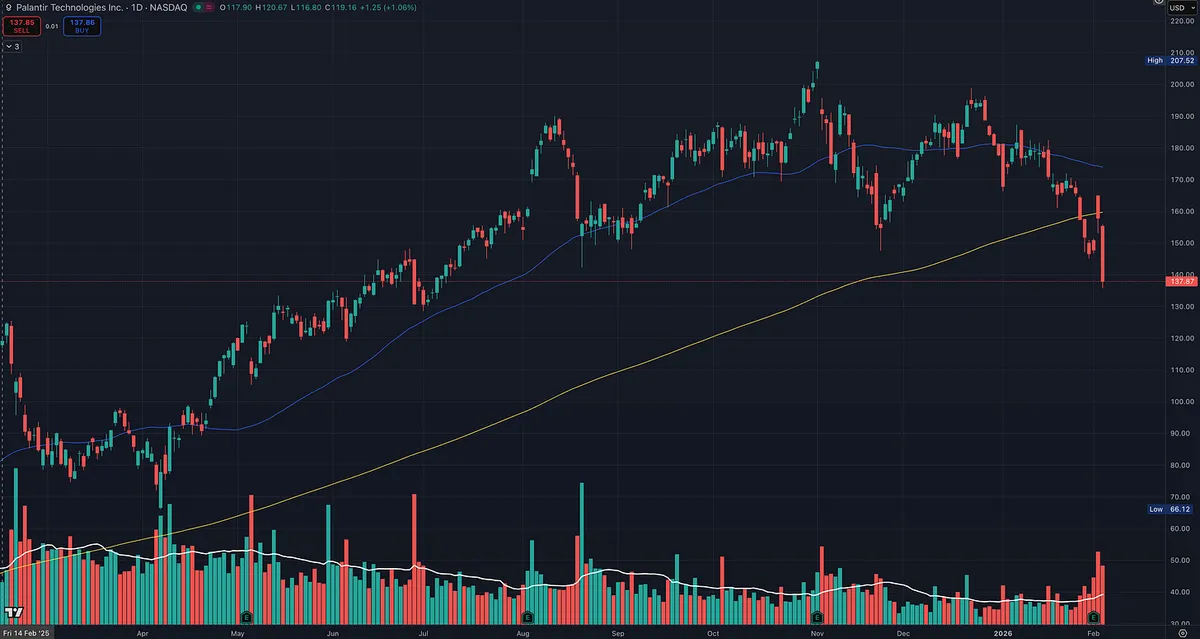
Palantir Technologies was an amazing stock to be in. The trend was strong, relative strength was working, and price rewarded staying with it.

But for now, price has confirmed it is not a stock to be in.

This is a great real-time example of why fundamentals alone do not matter if price and trend are not aligned.

Despite strong long-term fundamentals, the stock is:

  • Below the 200 day moving average

  • Printing lower highs and lower lows

That is no longer a stage 2 uptrend. That is a downtrend.

When price breaks below the 200 day and cannot reclaim it, that is the market voting. It is telling you that demand has dried up, regardless of how good the story looks on paper.

This is exactly why I will never buy a stock just because the fundamentals look great while price looks bad.

Great fundamentals do not stop drawdowns. Great fundamentals do not override trends. Price always leads.

PLTR may absolutely be a great stock again in the future. In fact, when a name with strong fundamentals starts to repair and regain trend, it often becomes even more powerful on the next run.

But until price confirms that change, there is no point in being involved.

View on Substack ↗

Most Stocks Follow the Market. Period.

Quick reminder.

“Three out of four stocks will go in the same direction as a significant move in the market averages.” William O’Neil

This single idea explains why so many traders struggle.

They obsess over individual stock stories while ignoring what the market itself is doing.

The reality is simple.

When the market is trending higher, the odds are stacked in your favor. When the market is trending lower, even the best looking stocks become harder to own.

This is why market direction matters so much.

When you see a growth stock performing well during a tough market, it usually does even better when the market turns back up. There is rarely any rush to buy.

If the averages are under pressure, I reduce exposure. If the market is confirming, I press my best ideas.

You want to swim with the current, not against it.

You can have perfect fundamentals and clean charts, but if the market is moving the other way, you are swimming upstream.

Most stocks follow the market. Fight that and you fight math.

Respect it and trading gets a lot easier.

View on Substack ↗

Price Is the Final Judge

Just to be clear.

Fundamentals absolutely play a role in my scanning, and the CANSLIM criteria is a great foundation. The biggest winners in history had big sales, big earnings, and accelerating growth before they really broke out, and most of their biggest moves happened after that breakout.

That matters.

But in practice, many of my winners come from technical scans for stocks already in strong trends with high relative strength.

I will never buy a stock against the trend. I will never buy a stock just because the fundamentals look good while price looks bad.

Price action always comes first.

A stock with great earnings and sales that cannot go up is telling you something. The market is forward looking, and price reflects that reality faster than any spreadsheet ever will.

That said, I will buy a strong stock with the right price action and a clear trend, even if the fundamentals are not perfect yet. I do not write about this as much because there are a lot of beginners, and I want them to be more selective. The CANSLIM criteria was a great foundation for me starting over 20 years ago.

Ideally, I want both aligned.

Strong price action. Strong relative strength. Fundamentals that support the move.

When everything lines up, the odds improve.

Bottom line, sometimes the fundamentals do not matter. What really matters is whether the stock is going up and acting right.

View on Substack ↗

The Most Underrated Trading Edge Has Nothing to Do With Charts

Exercise, quality sleep, and a healthy diet are some of the easiest ways to improve your trading.

Most people do not want to hear this.

They would rather I share setups, indicators, or technical trading tactics. Those things matter, but this is the part almost everyone ignores.

And it is massively underrated.

These three habits combined give you:

  • Mental clarity

  • Improved focus

  • Better emotional control

  • Stronger stress management

  • Faster decision making

The list of benefits is long.

Trading is a performance activity. If your brain is foggy, your sleep is inconsistent, and your energy crashes mid-day, no setup in the world is going to save you.

Poor sleep leads to impulsive decisions.

Poor nutrition leads to low energy and bad focus.

No exercise leads to elevated stress and emotional overreactions.

That shows up as:

  • Chasing entries

  • Hesitating on exits

  • Ignoring stops

  • Overtrading on chop days

The market already provides enough stress on its own. You do not need to handicap yourself before the bell even rings.

You can have the best strategy in the world and still underperform if your body and mind are not aligned.

This is not motivational talk.

This is practical edge.

Clean inputs create clean decisions.

If you want to improve your trading without changing a single thing, start here.

View on Substack ↗

The Market Does Not Care About Your Fundamentals

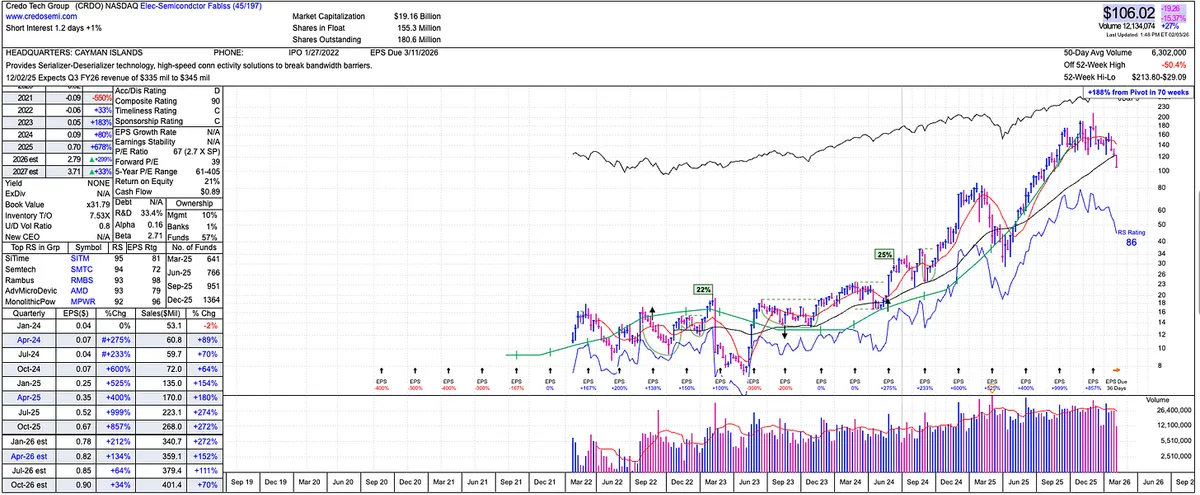
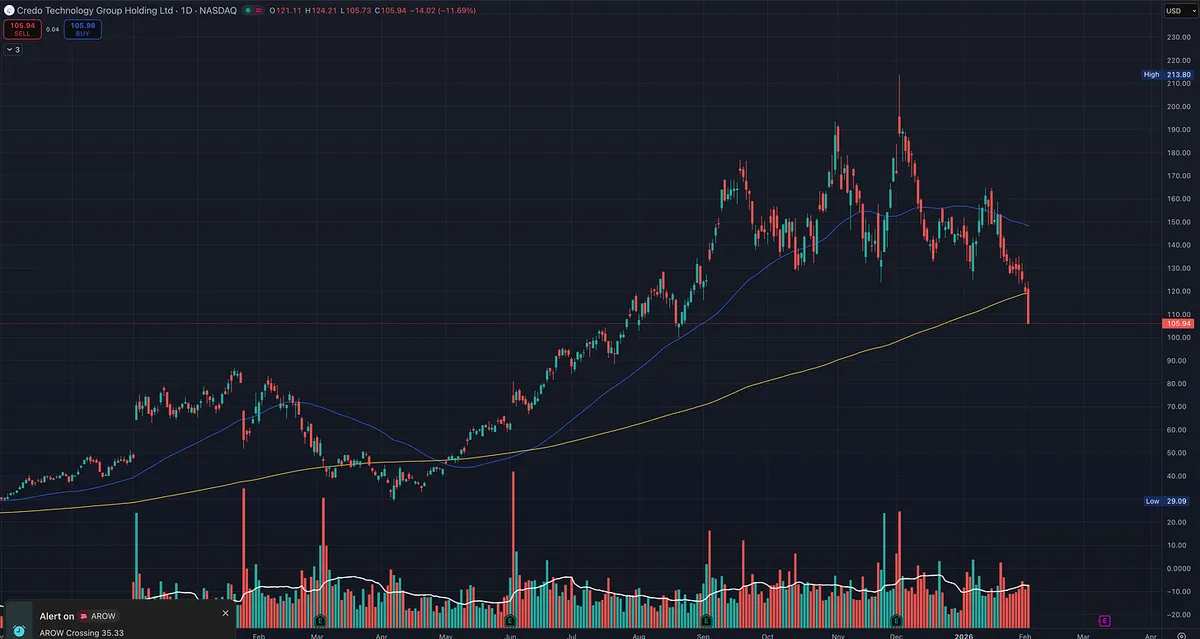
If you want a reminder that price is the final judge, look at CRDO.

On paper, this thing checks a lot of boxes.

  • Sales growth has been huge

  • Earnings growth has been huge

  • Forward estimates are still good

And yet, price is getting smoked, and now CRDO is below the 200 day moving average.

That is the lesson.

Why this happens

The market is not grading the company on what it just did.

The market is forward looking.

So when the rate of change starts to slow, even if the numbers are still “good,” institutions start to reprice the stock.

In CRDO’s case, you can see it in the story:

  • Estimates are still positive

  • But sales and earnings estimates are decelerating starting around the last earnings cycle

  • And price is acting like the market is already discounting a slower growth phase

What I’m doing with it

For now, it’s simple:

  • Solid decline

  • Below the 200 day

  • Not a place to be a hero

I think CRDO can be back at some point, because real growth names often do come back when the story re-accelerates and price regains key levels.

But until price proves it again, we stay away.

View on Substack ↗

It Pays to Stay With Winners: How I Trail Stops to Ride a Trend

Everybody wants the perfect entry. Perfect buy point. Perfect stop.

That obsession is exactly how you get shaken out of the stocks that can change your year.

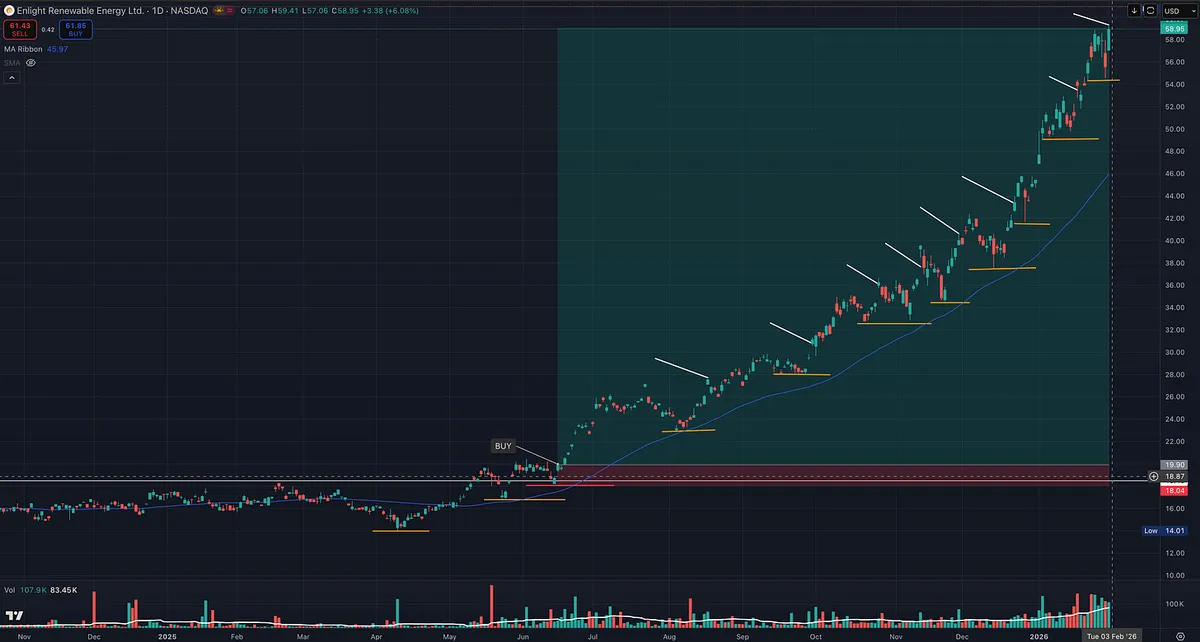
ENLT is a great example. It’s an energy name with poor earnings but huge sales, and the trend has been the story. The weekly chart is basically straight up, and price has been respecting the 10 week moving average as support.

The real edge is not “where did you buy.” The edge is how you manage the trade once you’re right.

The simple trailing stop method I use on the daily chart

Yes, you can trail a moving average. That works.

But when a stock is acting like a leader, I like something even more straightforward:

  1. When price makes a new high (white lines on the chart)

  2. I move my stop up to the prior higher low (orange line on the chart)

That’s it.

It keeps you in the trend longer because you’re letting price action tell you where the trade is wrong, instead of letting noise knock you out.

Why this matters more than your entry

You could have gotten into ENLT earlier. You could have gotten in later. It doesn’t really matter.

What matters is that you had a plan to stay with it as long as it kept printing higher highs and higher lows.

Big winners are rare. When you catch one, you don’t want to donate it back because you were micromanaging the stop or panicking on normal pullbacks.

The dirty secret of monster returns

A recent U.S. Investing Championship winner put up roughly 1,000% in a year while only being right around 22% of the time.

Read that again.

They didn’t win by being right a lot. They won because they cut losses fast and let winners run.

That’s the whole game.

Big winners allow you to lose a lot and still make money. But only if you manage them like winners.

View on Substack ↗

The Trader Who Adapts the Fastest Wins

One of the biggest advantages a trader can have is the ability to spot patterns and adapt.

Markets change. What worked a few months ago will eventually stop working. The traders who struggle are the ones married to a single setup or a fixed belief about how the market is supposed to behave.

An edge comes from recognition speed.

The faster you can recognize when breakouts stop working and buying support starts working, the better.

The faster you can recognize when breakouts begin working again, the better.

This is not about abandoning your process.

It is about adjusting execution to current conditions.

There are periods where:

  • Breakouts fail quickly

  • Tight entries near support outperform

  • Mean reversion pays better than momentum

Then conditions shift.

Suddenly:

  • Breakouts hold

  • Follow through improves

  • Momentum strategies regain their edge

The trader who adapts early keeps making money.

The trader who adapts late gives profits back.

The trader who never adapts eventually quits.

Pattern recognition is not a buzzword. It is a skill built through screen time, journaling, and brutal honesty about what is actually working.

Your job is not to predict.

Your job is to observe.

The market leaves clues every week.

Price tells you what is working if you are willing to listen.

Your ability to recognize new patterns, and changing patterns, is not optional.

It is essential.

View on Substack ↗

You Don’t Need to Be Right to Make Money in the Market

I always laugh when I see people talking trash because someone said they were long or short a stock and price went the other direction.

What those people don’t understand is this.

You don’t need to be right very often to be successful in the market.

In fact, many of the best Market Wizards were only right about 30% of the time.

Let that sink in.

You can be long a stock for a few weeks, get into the money, sell some into strength, and raise stops. When the stock eventually turns against you, you get stopped out.

And guess what.

You still made money.

Meanwhile, the comment section lights up.

“See, he was wrong.”

“How does he feel now?”

LOL.

Those reactions are the tell. They reveal who has never managed risk, never scaled out of a position, and never understood how professionals actually trade.

Real trading is not about calling tops and bottoms.

It is not about being right on every opinion.

It is not about ego.

It is about position sizing, risk management , and protecting capital.

If you can:

  • Cut losses fast

  • Let winners work

  • Take money off the table into strength

  • Raise stops as price moves in your favor

You can be wrong more than you are right and still make very good money.

The people obsessed with being “right” are the same ones who hold losers too long, never lock in gains, and trade opinions instead of price.

They are almost guaranteed to struggle long term.

The market does not pay you for being right.

It pays you for managing risk.

And that is why the loudest critics are almost always the least profitable.

View on Substack ↗

Study This Chart: One of the Best Low Risk Breakout Setups

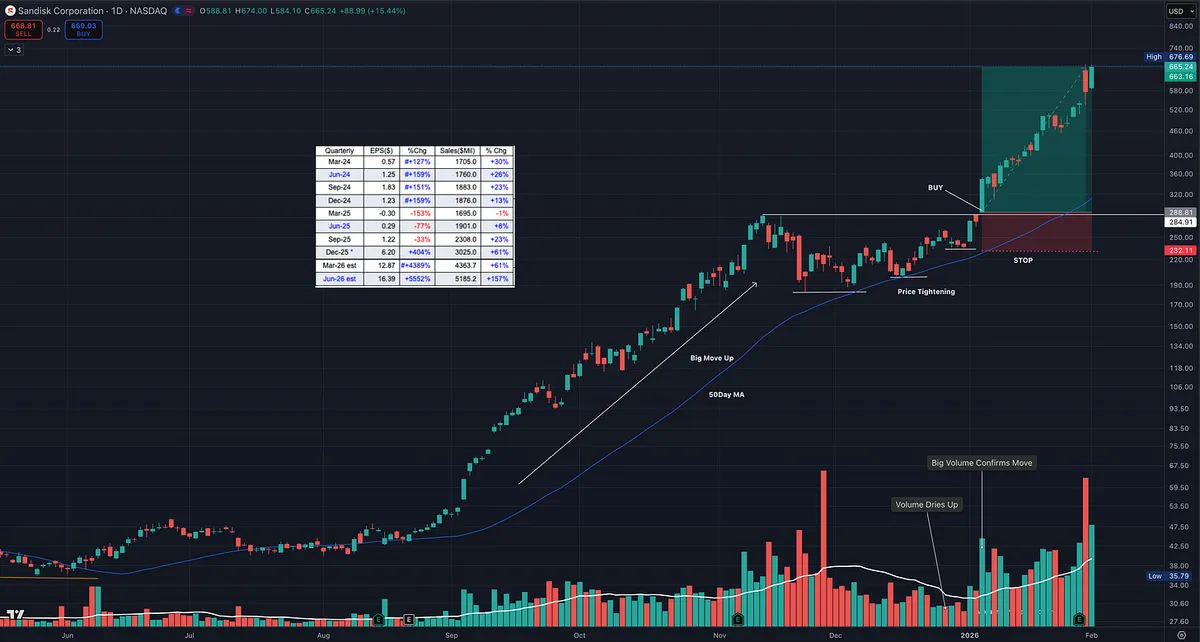
This chart is a perfect example of the type of setup we look for.

The stock is sitting inside a subsector that supports the main market theme right now, AI. When a subsector is strong, it tends to lift the entire group. That is why you see other names in the space acting well too, like Micron Technology, Western Digital, and Seagate Technology.

Now zoom in on the important part.

What makes this a premium setup is that it checks the fundamental boxes that show up in many of the biggest winners of all time, the type of characteristics William J. O'Neil wrote about after studying market history going back over a century.

But fundamentals alone are not what makes this special.

The real edge is the price action.

1) High relative strength

When a stock has RS in the 90s, it is telling you institutions are already voting with their money. This is what you want in a true leader.

2) Big earnings and big sales

Strong numbers are the fuel. Price action is the trigger. When both line up, it is hard for the market to ignore.

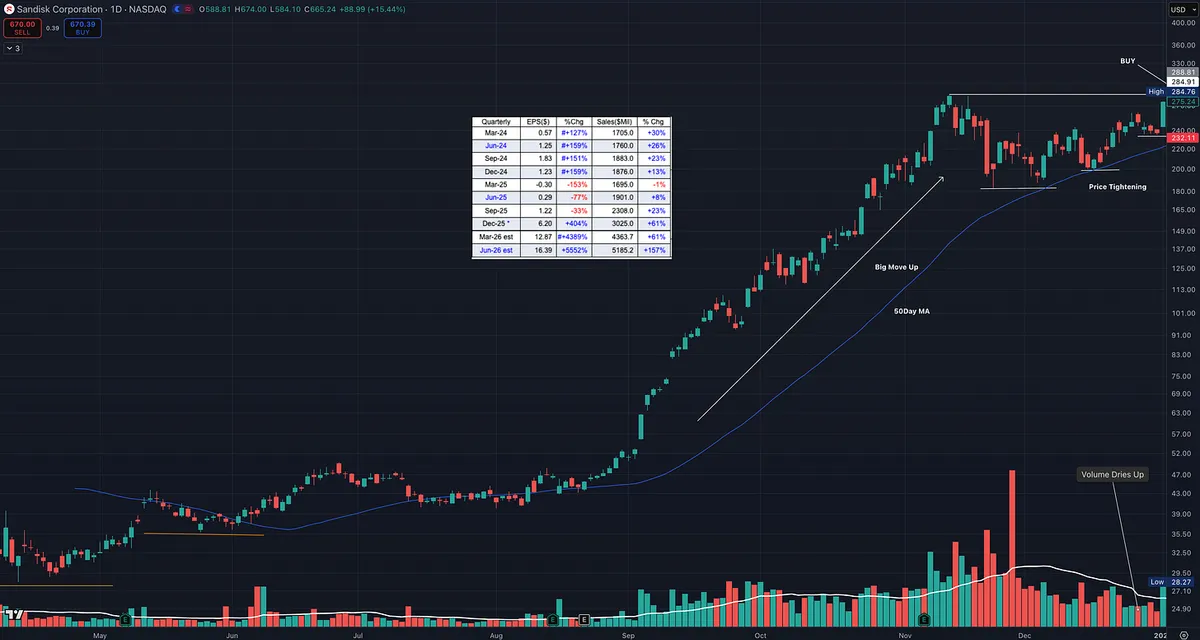
3) Big move up, then price tightens

This is the cheat code. A strong advance followed by tight price action. That is where the market gives you a gift.

Tightening action does two things.

  • It shows supply is drying up.

  • It gives you a clean place to define risk.

Why this is low risk and high reward

When price tightens near highs and then breaks out, you can build a trade that is asymmetric.

You are not guessing. You are defining a level that proves you wrong.

If it fails, you are out quickly.

If it works, you can ride a trend and manage it.

That is how you end up with trades that can pay 3R, 5R, even 10R plus while keeping the downside controlled. Study what what it looks like before and after.

View on Substack ↗

The Market Rewards Bullish Optimists With Humility

It pays to be an optimist.

One of the biggest lessons of this cycle is simple, but uncomfortable for many traders.

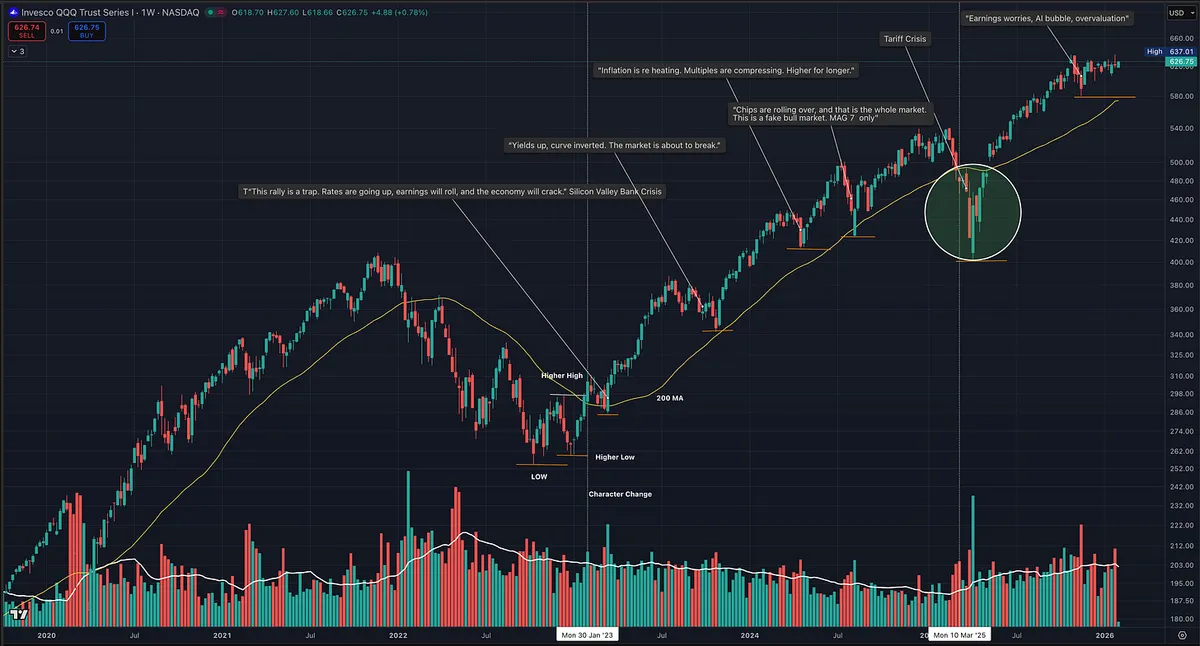
The market has consistently rewarded those who leaned bullish, even through pullbacks, consolidations, and choppy periods.

Since the last bear market low, every meaningful drawdown has eventually resolved higher. Volatility shook people out. Headlines turned bearish. Sentiment got ugly, and yet price kept doing what it tends to do in a bull market.

It moved higher over time.

If you stayed structurally bullish, you were right far more often than wrong.

If you stayed bearish, you mostly sat on the sidelines waiting for a crash that never came.

That does not mean buying blindly or ignoring risk. That is where humility matters.

Bullish optimism only works when paired with the willingness to admit when you are wrong.

Cut losses quickly. Reduce exposure when price breaks structure. Step aside when leadership deteriorates. Respect the market when it tells you you are early or incorrect.

But directionally, the edge has been clear.

Every pullback since the bear market has been an opportunity, not an imminent collapse.

The chart makes this obvious.

You can see the pauses, the shakeouts, the frustrating sideways action, and you can also see that staying aligned with the primary trend paid again and again.

Meanwhile, persistent bears did not lose money. They just did not make any, unless they got run over shorting.

And in trading, opportunity cost is still a cost.

This is not about being permanently bullish. It is about understanding regime.

In a bull market, the market rewards optimism with discipline. In a bear market, it rewards caution and patience.

Right now, the data says optimism with humility has been the winning combination.

And here is the part most people miss.

Eventually, one of these pullbacks will turn into the next real bear market. That is how cycles work.

But it will not matter if you have been making money the entire way up, and you have enough humility to get defensive when price and leadership change character.

Do not let fear keep you from opportunity in a bull market.

And do not let greed keep you from taking profits into strength.

Scale out into extensions. Let the remainder run. Tighten stops as price advances. If the trend stays intact, you stay in. If the market breaks structure, you step aside without hesitation.

Lean bullish. Stay flexible. Let price keep you honest.