
Trading articles/Why Relative Strength Is the Fastest Way to Find Big Winning Stocks
Feb 6, 2026 · Momentum Trading Strategy
Why Relative Strength Is the Fastest Way to Find Big Winning Stocks
How the Greatest Market Leaders Are Identified Early and How I Use a Relative Strength Stock Scanner to Stack the Odds
Originally published on Substack.
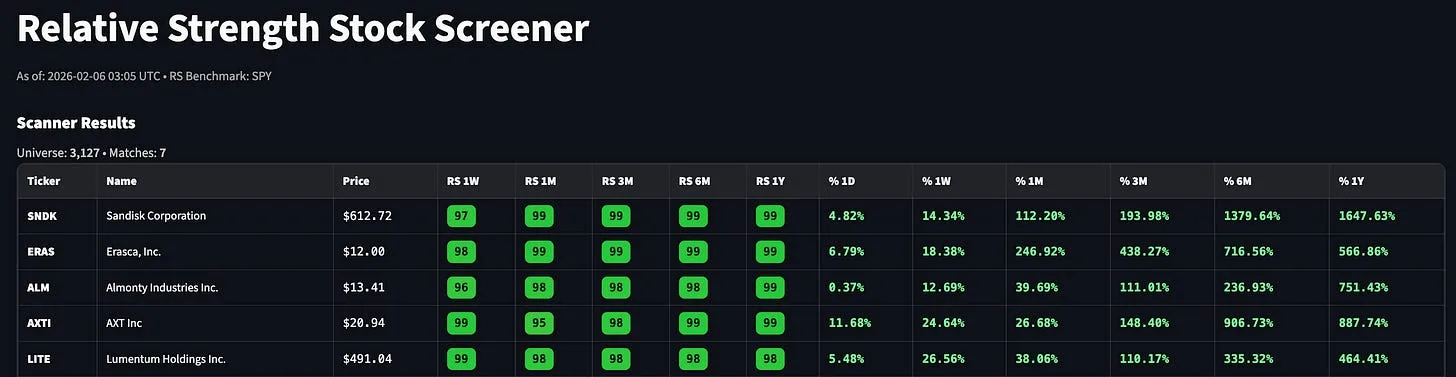
Before going any further, it is important to clarify what I mean by relative strength.
I am not referring to the RSI overbought or oversold indicator that many traders add under their charts. RSI has its place, but most professional momentum and trend traders consider it overrated for identifying true market leaders.
As William O’Neil put it:
“I rarely pay any attention to overbought or oversold indicators.”
When I talk about relative strength, I mean something very different.
I am referring to how a stock is performing relative to the broader market and relative to other stocks, most commonly compared to a major index like the S&P 500.
In simple terms, relative strength answers this question:
Is this stock outperforming the market and the majority of stocks right now?
This concept has been central to professional growth investing for decades. It is the same idea popularized by Investor’s Business Daily and written extensively about by William O’Neil in How to Make Money in Stocks.
O’Neil’s historical research showed that the biggest winning stocks in market history were already outperforming the market before their most powerful advances began. Leadership showed up early, long before the move was obvious.
That is the definition of relative strength used throughout this post.
Not oscillators.
Not overbought or oversold signals.
But comparative performance.

Most traders do not lose money because they pick bad entries.
They lose money because they spend their time analyzing stocks that never had the potential to become big winners in the first place.
If you look at enough charts, something will always appear buyable. A bounce. A pattern. A reclaim of a moving average. A convincing story.
But when you study the biggest stock market winners of the last 100 years, a clear pattern emerges.
The best stocks did not look average before they moved.
They did not lag the market.
They did not hide their strength.
They stood out early.
This is not opinion. It is the result of decades of historical research.
The common thread behind nearly every superperforming stock is simple.
Relative strength.
Stocks that go on to make massive multi month and multi year runs almost always outperform the market before the move begins.
That is why “Leader or Laggard” became a core pillar of the CANSLIM system and why elite momentum and trend traders focus on leadership before worrying about entries.
Relative strength, as defined here, is not a technical indicator to decorate a chart.
It is a filter for institutional demand.
It answers one question that matters more than any pattern:
Where is real money already flowing?
If a stock cannot outperform the S&P 500 and the majority of stocks in the market, the odds of it becoming a true leader are extremely low.
Hope does not create trends.
Demand does.
Why Relative Strength Comes Before Everything Else
Capital flows toward strength and away from weakness.
Institutions do not buy laggards and wait patiently for miracles. They concentrate capital in names that are already working.
Historical studies show that most major winners were already near the top of relative strength rankings before their biggest advances.
As William O’Neil noted:
“From the early 1950s through 2008, the average RS Rating of the best performing stocks before their major run ups was 87. In other words, the best stocks were already doing better than nearly nine out of ten others when they were starting out on their most explosive advance yet.”
This matters because successful traders do not need to predict the future.
They need to align with pressure that already exists.
Relative strength removes emotion from the process.
It removes stories.
It removes opinions.
It leaves only price truth.
The Real Edge Is Elimination
Most traders believe the edge is finding more setups.
In reality, the edge is eliminating most stocks as fast as possible.
If you remove the bottom 80 to 90 percent of stocks immediately, your decision quality improves overnight.
That is exactly how the great traders operated.
They did not watch everything.
They aggressively narrowed the universe.
They focused only on leadership.
That principle is the foundation of the Relative Strength Stock Scanner I built.
What This Scanner Is Designed to Do
Instead of starting with chart patterns, this tool starts with leadership.
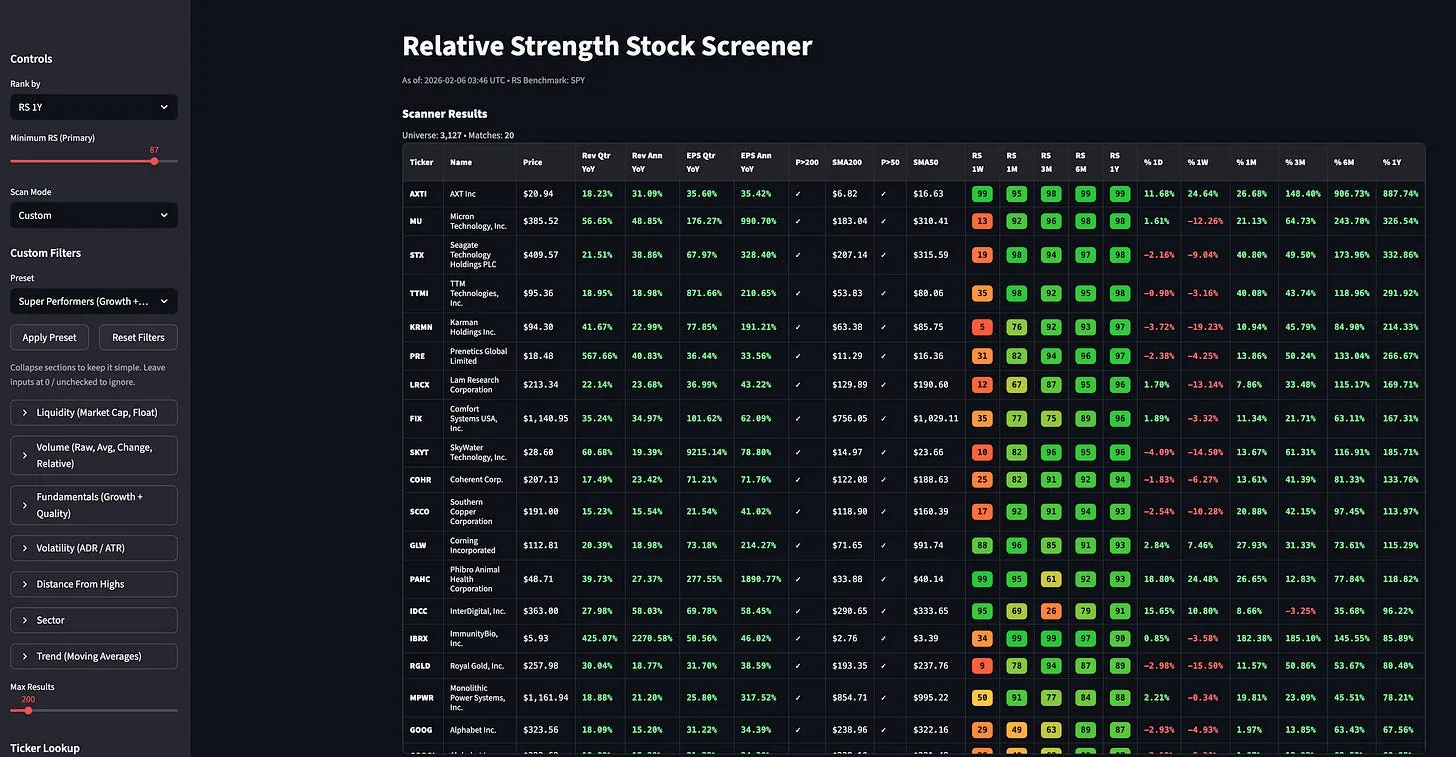
It allows me to:
• Rank stocks by relative strength across multiple timeframes
• Filter only stocks aligned with a proper trend template
• Layer in fundamental growth data such as sales growth, earnings growth, return on equity, and operating margins
• Apply volume and liquidity metrics
• Eliminate laggards before ever opening a chart
Below, I walk through exactly how I use this tool in a structured top down and bottom up process.
My Top Down, Bottom Up Process
My process is structured, but not rigid.
It is designed to keep me aligned with the market first, leadership second, and individual stocks last. Once I move into stock screening and chart review, the process naturally shifts from top down analysis to bottom up analysis and decision making.
Step 1: Big Picture and Market Direction
Every week starts with assessing overall market direction and the big picture. This is primarily weekend work.
I focus on trend, market health, leadership rotation, and the overall risk environment. This is best captured in The Big Picture Market Pulse.
If the market is not supportive, the goal is capital preservation and patience. No scan can fix a bad market.
Step 2: Relative Strength Dashboard
Next, I review my Relative Strength Dashboard to identify which areas of the market are moving and showing leadership.
This includes sectors, industry groups, and broad themes.
This step prevents random stock selection and ensures that any stocks I later consider are coming from areas where capital is already flowing.

Step 3: Relative Strength Stock Scans
Only after understanding the market and leadership do I begin running stock scans.
These scans are intentionally varied and include combinations such as:
• Relative strength with trend template filters
• Relative strength with sales and earnings growth
• Relative strength with volume and liquidity metrics
• CANSLIM inspired combinations
• Superperformer style criteria when conditions allow
I do not rely on a single scan.
Different market environments reward different characteristics. In strong markets, tighter and more restrictive scans tend to work well. In weaker or choppier markets, being overly restrictive can result in very few actionable ideas.
There are periods where my strongest superperformer or CANSLIM scans produce little. That is not a flaw in the process. It is information.
If leadership is scarce, the market is telling you something.
Step 4: Chart Study and Watchlist Development
Only after the universe of stocks has been narrowed through relative strength screening and filtering do I study charts and build watchlists.
At this stage, I am looking for clean structures, proper consolidations, and logical risk points.
I have a defined playbook of setups, which I will cover in a separate post. Some I have already written about include VCP, higher high higher low patterns, flat base breakouts, cup with handle formations, and ascending bases.
This keeps chart work focused and efficient.
If a stock is actionable, it goes on my primary watchlist.
If it is extended or still building a base, I set alerts and place it on a secondary watchlist for future review.
Step 5: Bottom Up Discovery and Feedback Loop
As I scan through hundreds of stocks, new patterns often emerge.
I may notice industry groups or sectors repeatedly showing strength that were not obvious during the initial top down review.
When this happens, I shift into bottom up analysis and dig deeper into those groups.
When the same stocks appear across multiple scans, that is a strong signal. It suggests persistent demand rather than coincidence.
No technology, AI, or software has replaced reviewing charts manually. This should remain part of your process, even if it is only 15 to 30 minutes per day.
Acceleration and Deceleration of Relative Strength
Relative strength is not static.
One of the most powerful features of the scanner focuses on acceleration and deceleration across timeframes.
This helps identify both maturing leaders and emerging ones, and is especially useful for swing traders who do not hold positions as long as O’Neil did.
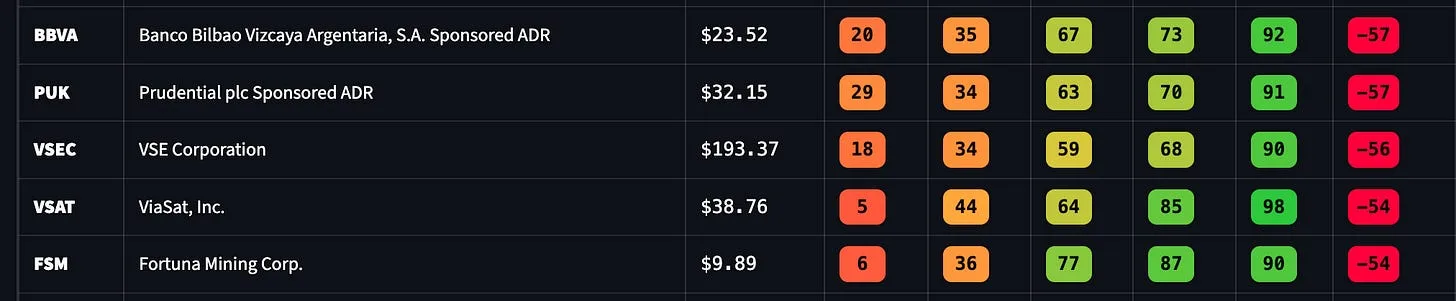
Identifying Leaders That May Be Losing Steam
Some stocks remain strong on longer timeframes while quietly weakening underneath.
For example:
• Strong one year relative strength
• Weakening three month relative strength
• Further deterioration on one month or one week relative strength
This often signals trend fatigue or rotation.
It does not guarantee a reversal, but it helps manage expectations, tighten risk, and avoid late stage entries.
Relative strength does not end trends. It reveals when demand is no longer accelerating.
Finding Emerging Leaders Through Acceleration
New leaders often start quietly.
They may show average or even weak relative strength one year ago, but improving strength on shorter timeframes.
For example:
• Average or high one year relative strength
• Improving three to six month relative strength
• Strongest readings on one or three month relative strength
This is classic relative strength acceleration.
It suggests capital is rotating into the stock now.
This feature helps surface new leadership early, before it becomes obvious or crowded.

Ticker Level Review and Watchlist Workflow
Once a watchlist is built from scans, the work is not finished.
Scanning and screening identify candidates. Review determines action.
That is why the scanner includes a ticker input feature.
As I review charts, I can input any ticker and instantly see all key metrics in one place, including:
• Relative strength across multiple timeframes
• Acceleration or deceleration characteristics
• Trend template alignment
• Fundamental growth metrics
• Volume and liquidity data
This allows chart structure and data to be evaluated together.
Two stocks may look similar technically, but their relative strength profile or growth characteristics can be very different.
This step ensures watchlists remain intentional and high quality.
The goal is not to trade everything that appears in a scan.
The goal is to systematically narrow from many ideas to very few high quality opportunities, with full transparency into why each stock remains on the list.

Why This Improves Odds Instead of Certainty
Nothing in trading is guaranteed.
But relative strength dramatically improves the quality of opportunities you are exposed to.
You do not need many winners.
You need a few leaders.
And you must avoid the rest.
This scanner is not designed to make you right more often.
It is designed to keep you focused on stocks that can actually trend.
Final Thought
Relative strength is how you stay aligned with what is already working instead of chasing what might work.
This scanner is simply a way to operationalize decades of proven research into a repeatable, unemotional process.
If you want to trade trends, you must start with leaders.
Everything else is noise.
👉 Access the Relative Strength Stock Screener.
Now integrated into the Momentum Trading Strategy Web App
More in Strategy & Tactics
All Strategy & Tactics articles →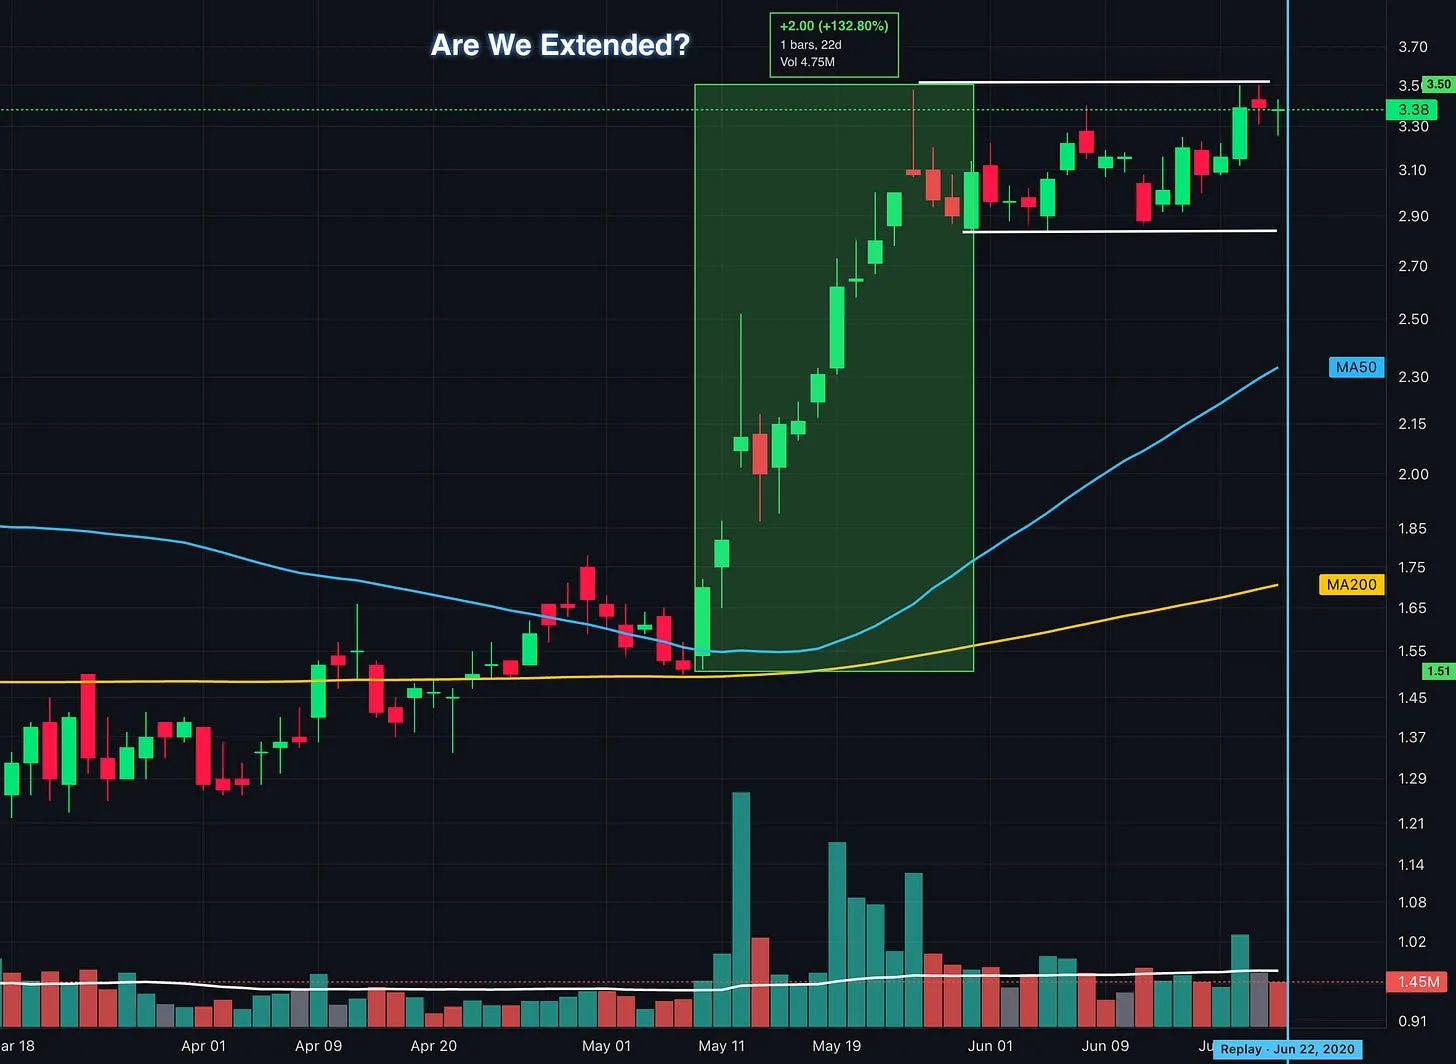
Oct 8, 2026 · Strategy & Tactics
Up 100% and Still Buyable? What Traders Get Wrong About Extended Stocks
How to identify proper buy points, avoid chasing stock breakouts, and manage entry risk using lessons from William O’Neil, Mark Minervini, David Ryan, and Dan Zanger.
- Momentum Trading
- VCP
- position trading
- Growth Stock Trading
- David Ryan
- Flag Pattern
- chart patterns
- Cup and Handle
Sep 27, 2026 · Strategy & Tactics
Should You Follow Leading Stocks or Wait for Market Confirmation?
How to read the market, industry groups, and individual stocks together so you can recognize opportunities, build exposure, and respond when conditions change
- growth stocks
- CANSLIM
- Trading
- position trading
- Stan Weinstein
- William O'Neil
- Momentum Trading Strategy
- Trade stocks
Sep 25, 2026 · Strategy & Tactics
Stage Analysis: How to Spot Stage 3 in Real Time
Recognize a developing Stage 3 using Stan Weinstein’s framework, with real chart examples, warning signs, and lessons for protecting your gains
- Momentum Trading
- Nasdaq
- technical analysis
- CANSLIM
- position trading
- Stan Weinstein
- QQQ
- Find True Market Leaders