Momentum Trading Strategy

Notes

Short lessons on momentum trading, every day.

Every note from Substack, in one place: risk, setups, leading stocks, market conditions and the mindset behind them. Search them, browse by topic, or filter by stock.

Showing 341–360 of 1222 notes

View on Substack ↗

Great Fundamentals Do Not Always Make a Great Trade

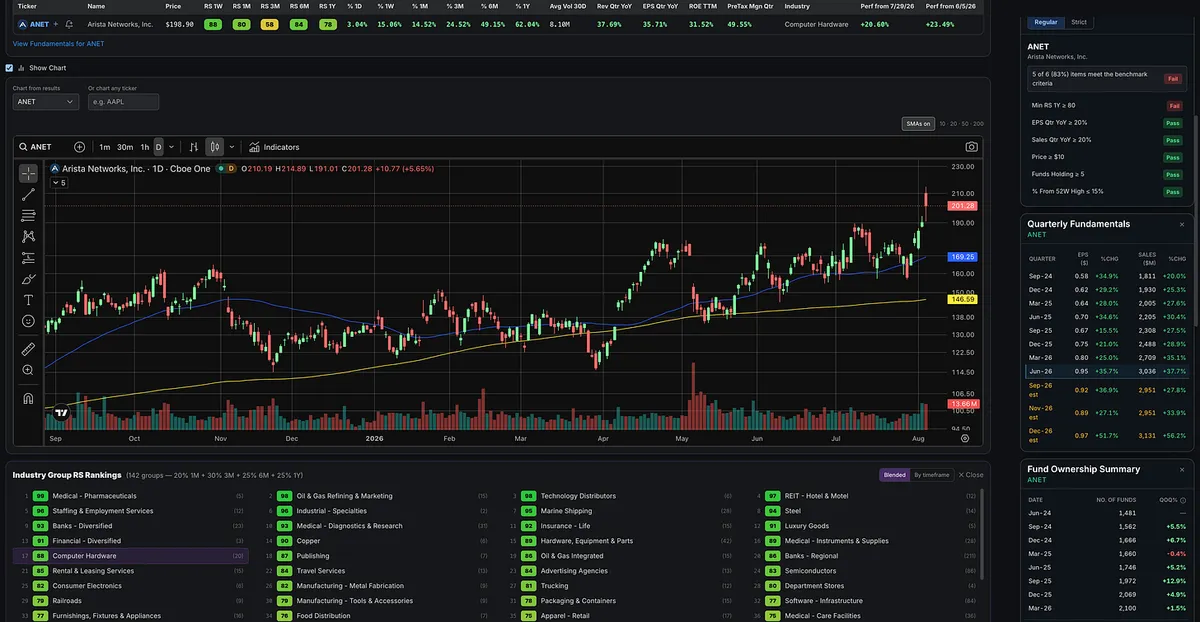
ANET is a perfect example of a growth stock with strong earnings, strong sales, and impressive growth fundamentals that has still been extremely difficult to trade.

Since last September, the price action has been choppy, whipsawing, and lacking a clean, sustained trend. The stock repeatedly moves higher, reverses, breaks below prior lows, and then rallies again. That type of action can stop traders out even when the longer-term direction is eventually higher.

The only truly clean advance I see was the move from roughly April 8 through April 22. Outside of that brief stretch, the price action has been frustrating and inconsistent.

This is an important reminder that great fundamentals are not enough. A stock can be an outstanding company and still be a terrible trade.

I want strong earnings and sales, but I also want clean price action, clear accumulation, and price action that gives me a logical place to manage risk.

View on Substack ↗

PLTR Back From the Dead

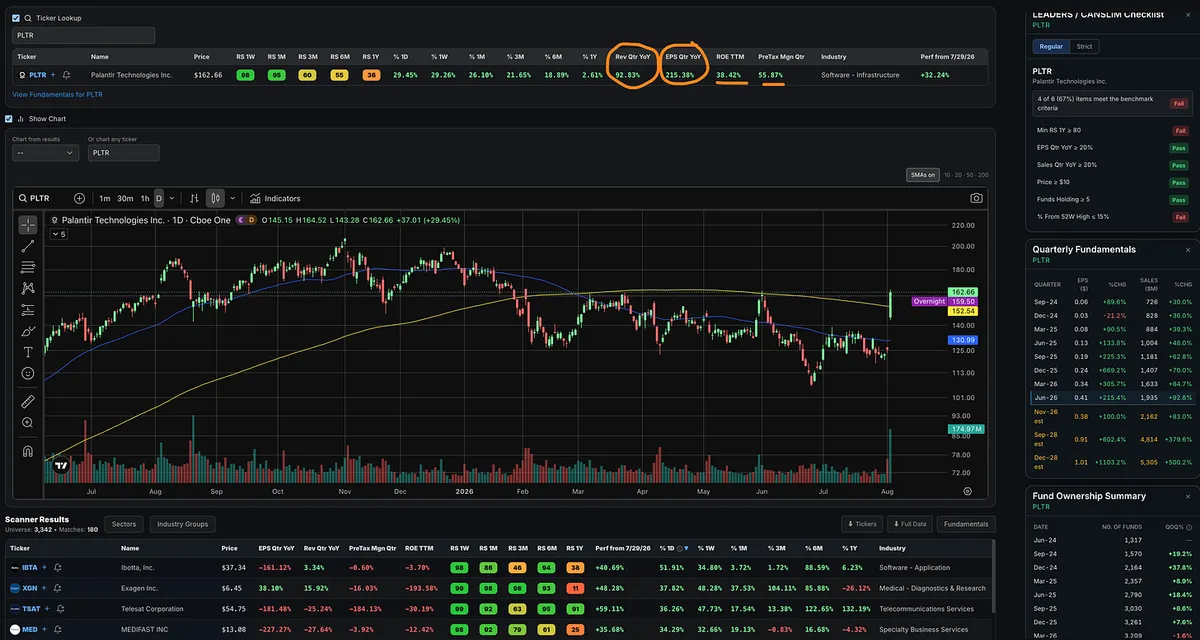
PLTR is up nearly 30% after earnings, exploding higher on massive volume.

Quarterly earnings increased 215%, sales grew 93%, and the stock reclaimed its 50-day and 200-day moving averages in a single session.

After months of weakness and a steep decline from its highs, PLTR just came back to life.

View on Substack ↗

The Market Delivered a Follow-Through Day

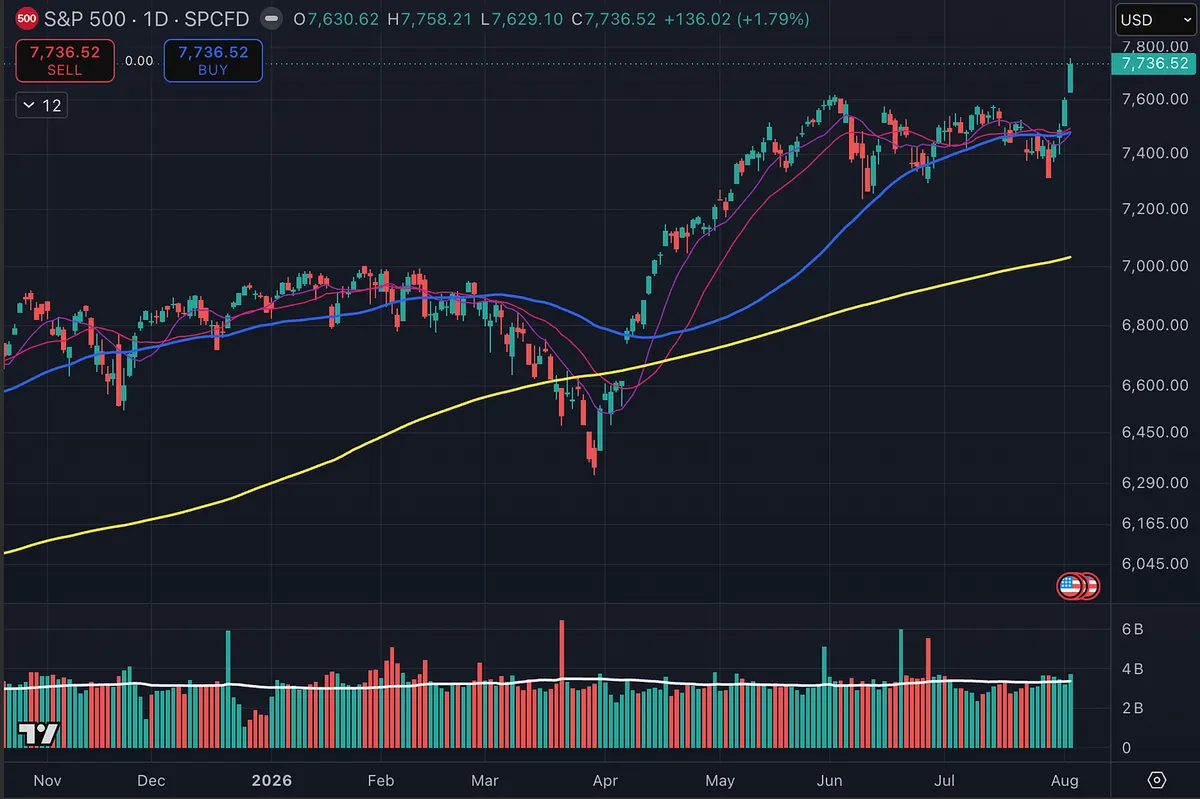
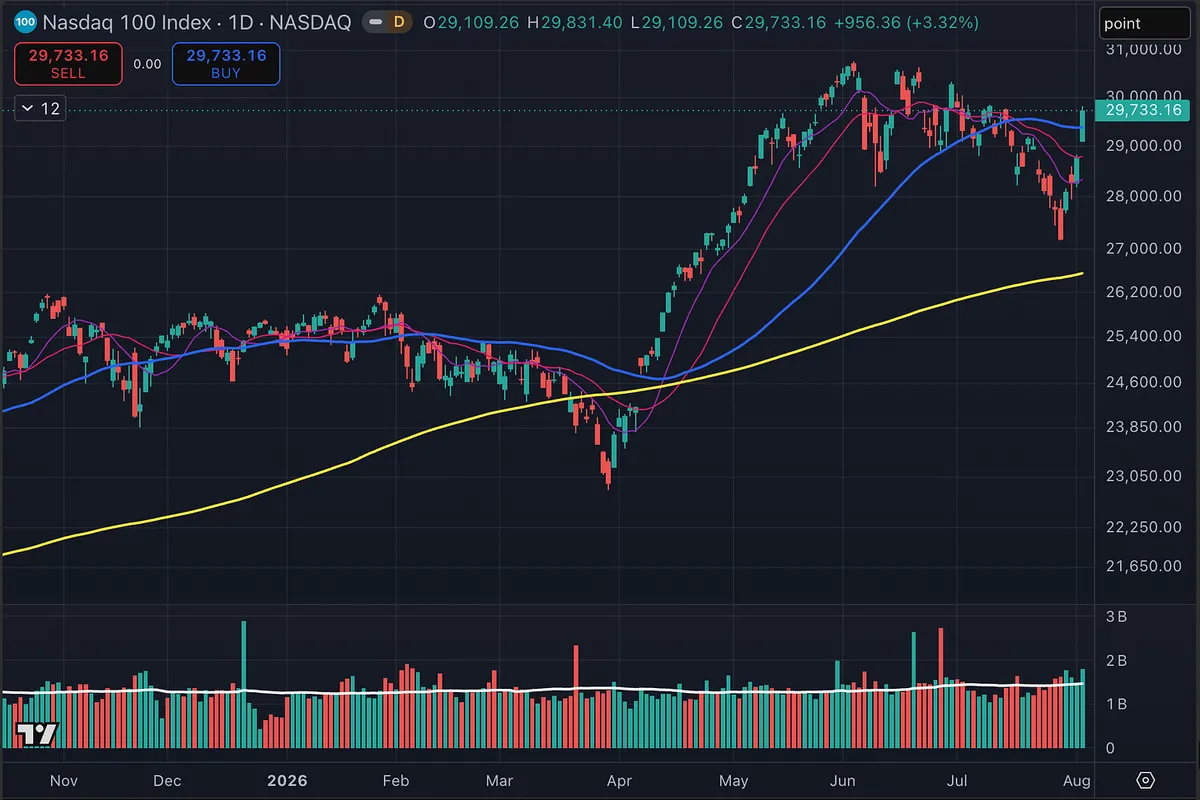
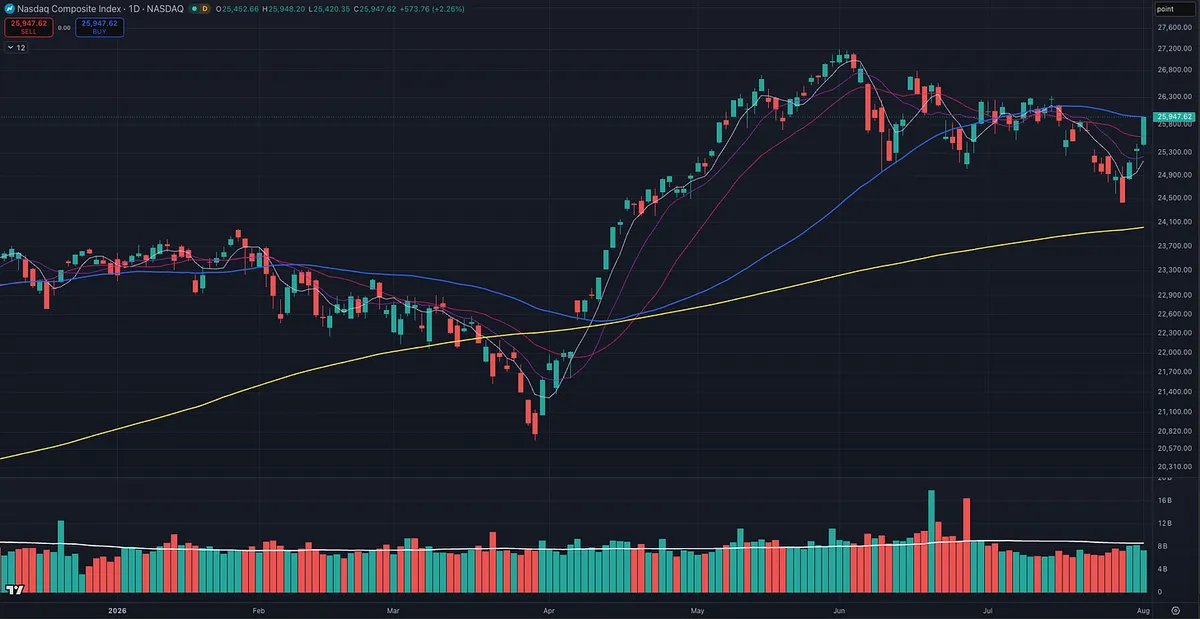
After reviewing today’s closing volume across the major indexes, futures, and ETFs, the message is clear: the weight of the evidence supports increasing exposure.

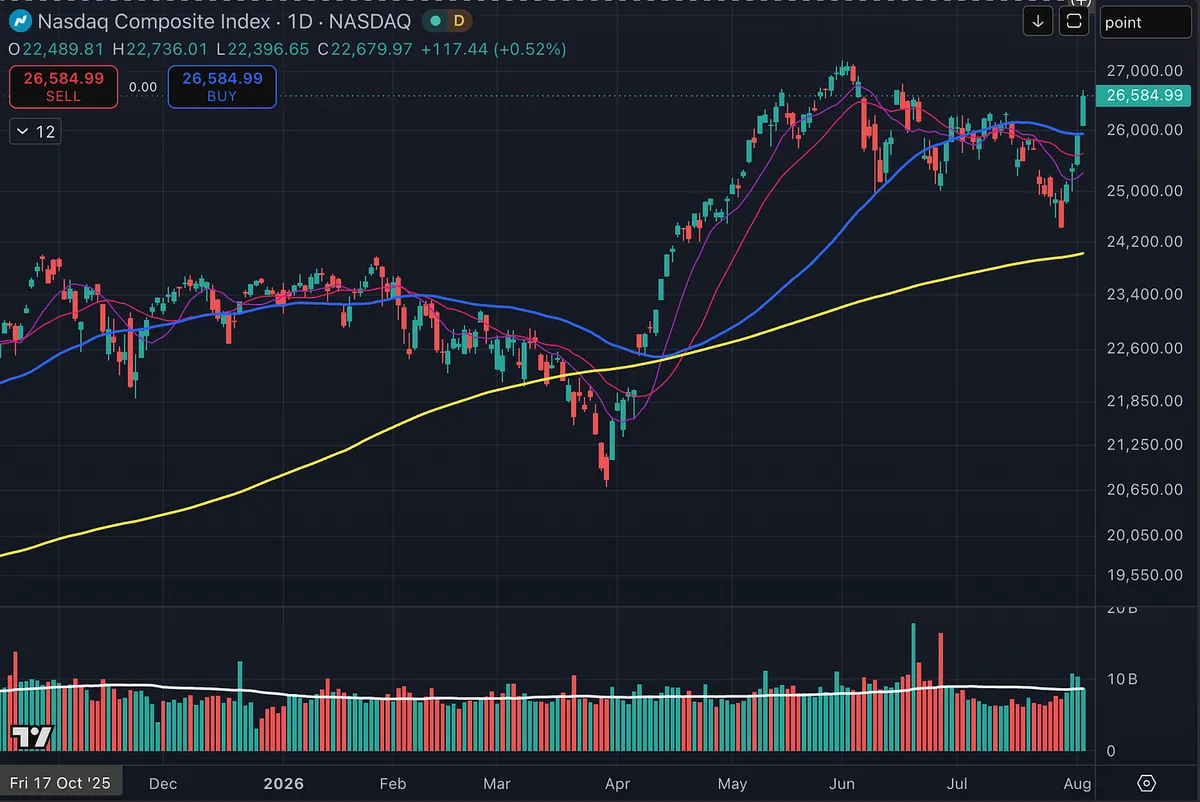
The S&P 500 gained 1.79%, the Nasdaq 100 rose 3.32%, the Nasdaq Composite advanced 2.59%, the Russell 2000 climbed 1.85%, and the Dow gained 1.72%.

Volume confirmed the move across nearly every major benchmark. The S&P 500 and Nasdaq 100 traded higher on increased volume in the cash indexes, futures, and their corresponding ETFs. The Dow and DIA also posted higher volume.

The one exception was the Nasdaq Composite. Its reported index volume was lower than the previous session, so it did not technically qualify for an official follow-through day on its own. However, ONEQ, the Fidelity Nasdaq Composite Index ETF, did trade on higher volume.

The S&P 500 and Nasdaq 100 both delivered follow-through-day signals, the major index ETFs confirmed the move, and the Nasdaq Composite has reclaimed all of its key moving averages.

The Broader Market Is Confirming the Move

The signal is also supported by extraordinary strength beneath the surface.

The S&P 500 and Dow are at all-time highs. The Russell 2000 is sitting near its record high, while equal-weight indexes such as RSP, EDOW, and the equal-weight Russell 1000 are also at or near all-time highs.

The strength extends well beyond the largest companies. The S&P MidCap 400 ETF, MDY, is at an all-time high. The Russell 1000, major value indexes, the Vanguard Total Stock Market ETF, and the NYSE Composite are also at or near record highs.

Meanwhile, the Nasdaq Composite, Nasdaq 100, and the equal-weight Nasdaq 100 ETF, QQQE, are all trading above their key moving averages.

This shows broad participation. The market’s strength is not confined to a small area of the market. Large caps, mid-caps, small caps, equal-weight indexes, value stocks, growth stocks and the broader NYSE are all participating.

That breadth adds credibility to the follow-through signal.

Why All-Time Highs Matter

All-time highs matter because they remove most of the overhead supply created by investors who previously bought at higher prices and are waiting to sell when they get back to breakeven.

When an index or stock moves into new-high territory, virtually everyone holding it is sitting on a profit. There is no large group of trapped investors waiting to sell simply to recover their original investment.

That does not mean the market cannot pull back. It means a major source of potential resistance has been removed, allowing prices to advance more freely when institutional demand remains strong.

This is why legendary traders such as Jesse Livermore, Nicolas Darvas, William O’Neil, and Mark Minervini have placed so much importance on stocks and markets moving into new-high ground.

Strength often produces further strength. The strongest markets and stocks can appear expensive, extended, or “too high” long before their advances are finished.

What the Evidence Is Telling Us

The evidence supports increasing exposure and participating in this market.

That does not mean immediately moving to maximum exposure. It means adding positions progressively as individual stocks confirm the market’s strength and our individual trades begin working.

The previous two occasions when the market experienced a meaningful correction, reclaimed the 50-day moving average, and produced this type of follow-through signal were May 12, 2025, and April 8, 2026.

Today’s action is the signal we have been waiting for. The focus now shifts to execution: identifying the strongest leadership, entering positions with disciplined risk management, and allowing successful trades to earn additional exposure.

View on Substack ↗

The Old Leaders Are Waking Back Up

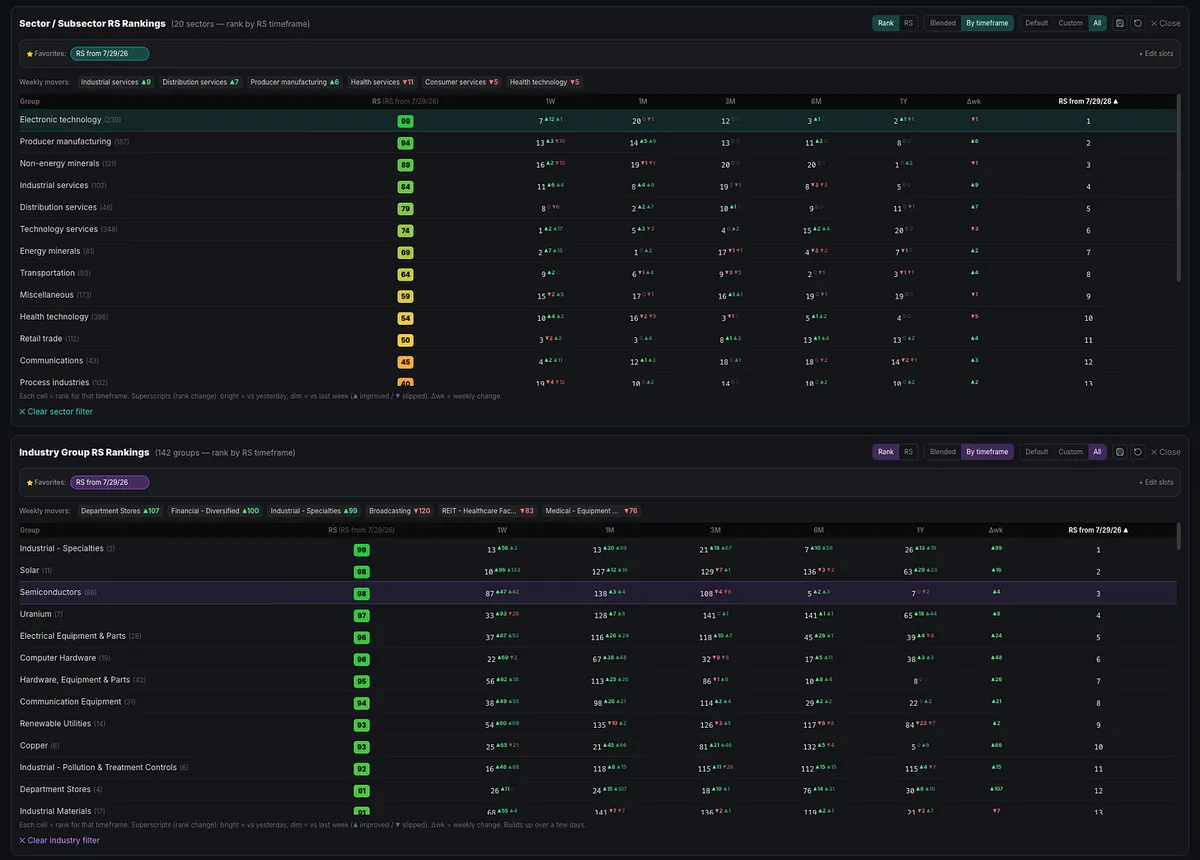
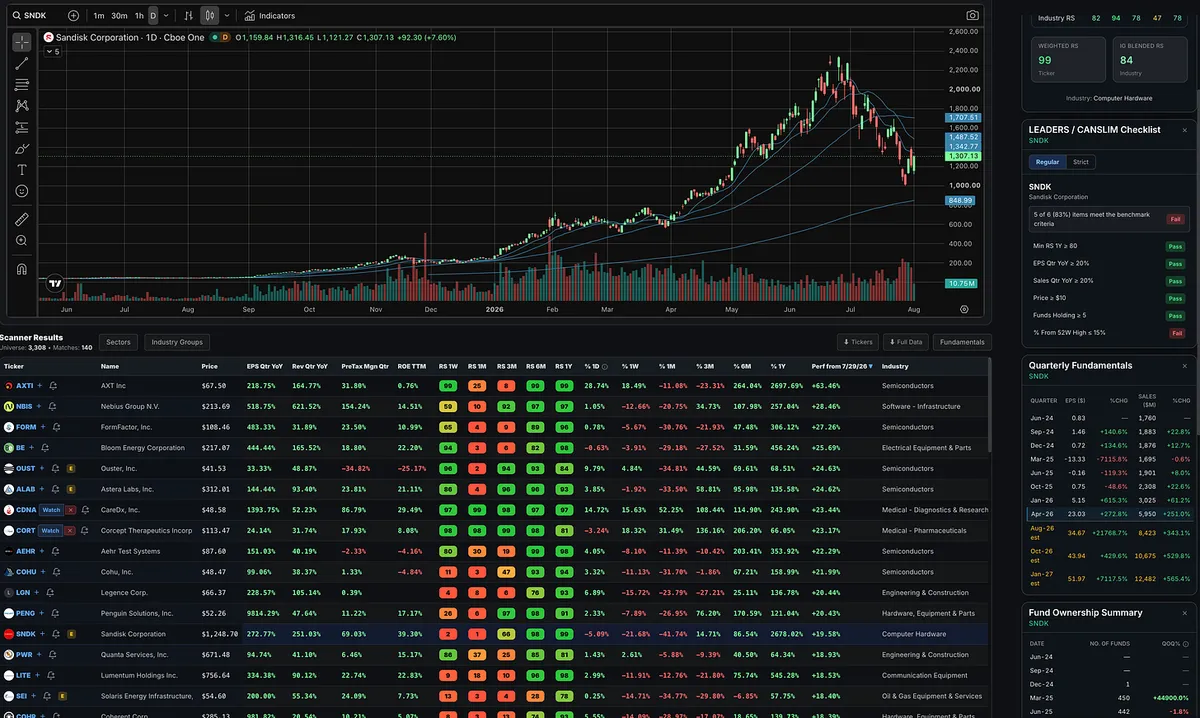
The strongest sectors and industry groups since the July 29 low are many of the same areas that led the market over the past year:

Technology

Semiconductors

Electrical Equipment and Parts

Computer Hardware

Electronic Equipment and Parts

Communication Equipment

These areas took a beating after major runs in many of their leading stocks.

We will see whether the market produces a follow-through day today or in the coming days, and whether these groups can reclaim their prior leadership.

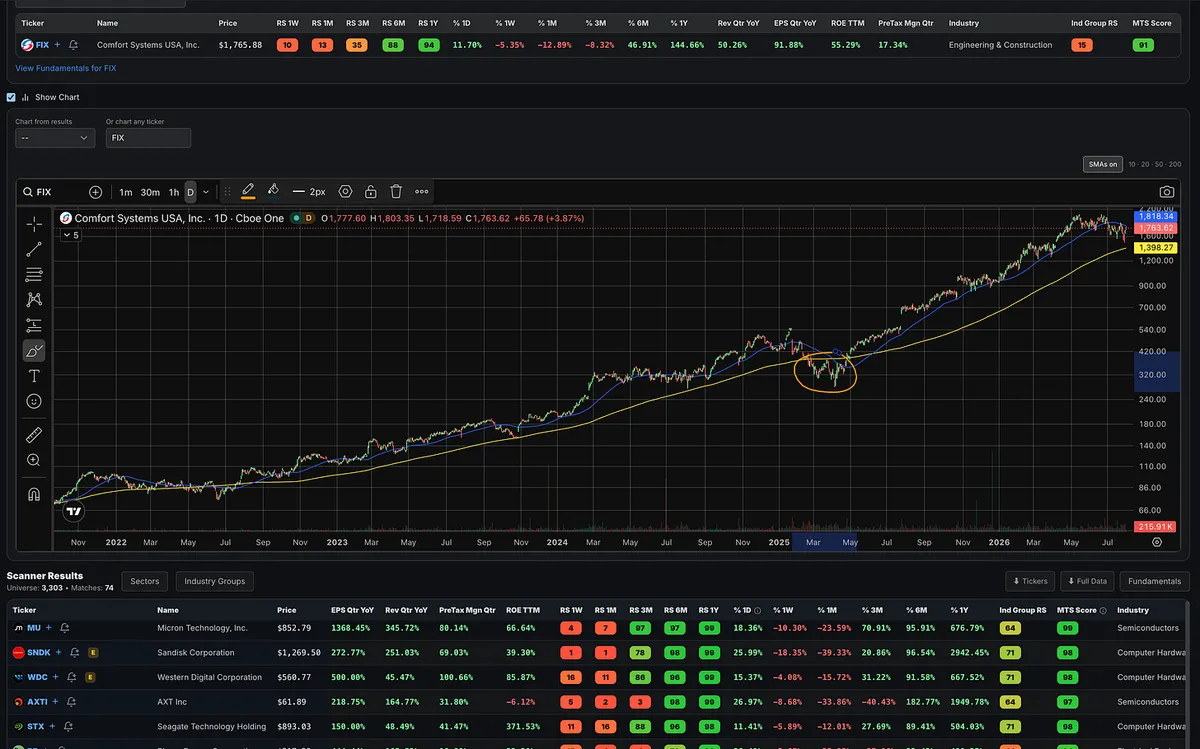
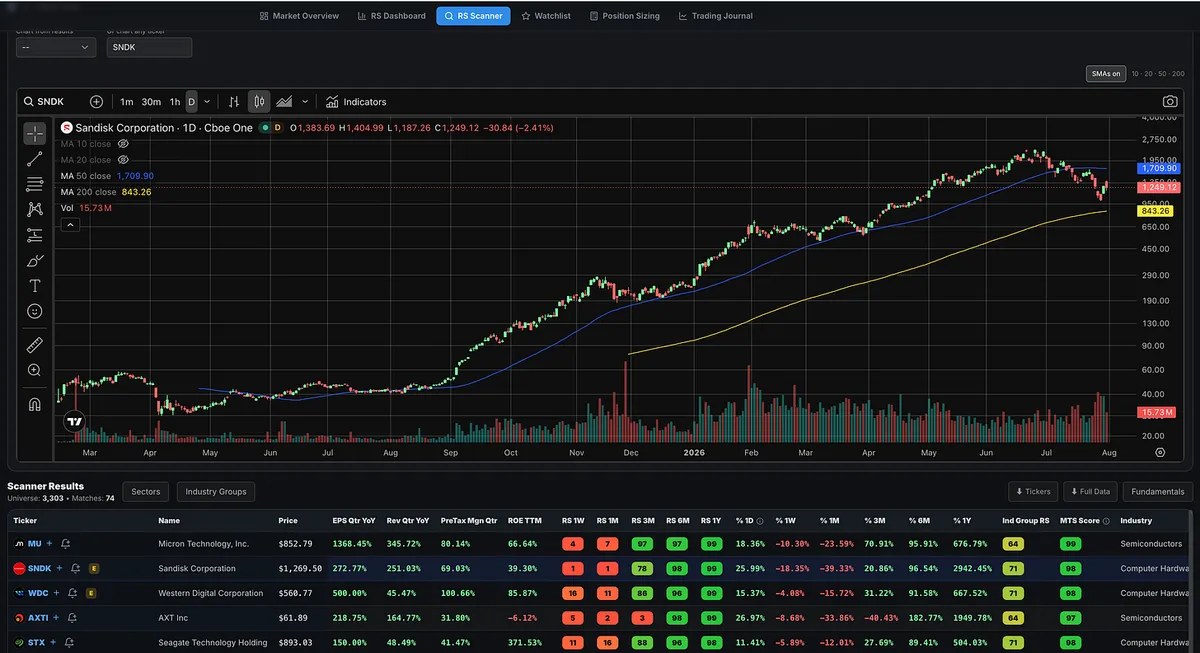
Many of the former leaders, including SNDK, MU, BE, CIEN, and PENG, were hit hard and still have significant ground to recover.

But the areas that led before the correction are once again showing some of the strongest relative performance off the lows.

View on Substack ↗

Wait... HP Is Still Alive?

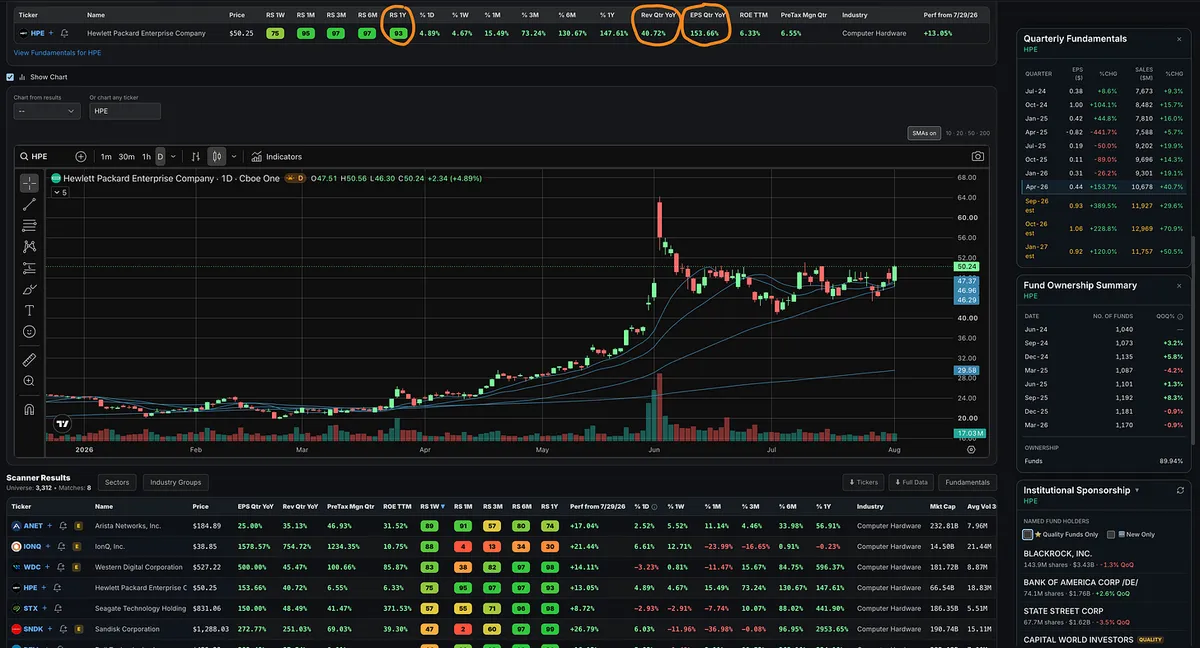
I honestly did not know HP made it out of the 1990s and early 2000s.

Yet here it is, showing up on the screens and trying to remind everyone it still exists.

Sometimes the market finds strength in the last place you would think to look.

View on Substack ↗

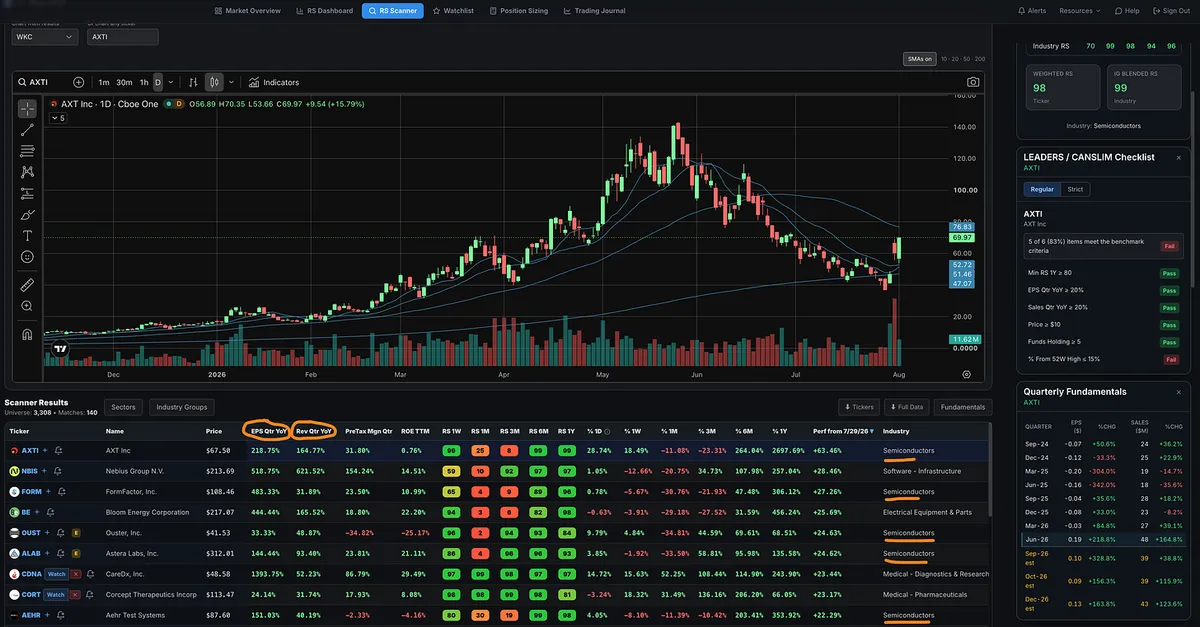
A Different Kind of Strength Since Last Wednesday’s Low

Now we will see if the rally attempt earns confirmation with a follow-through day in the coming days.

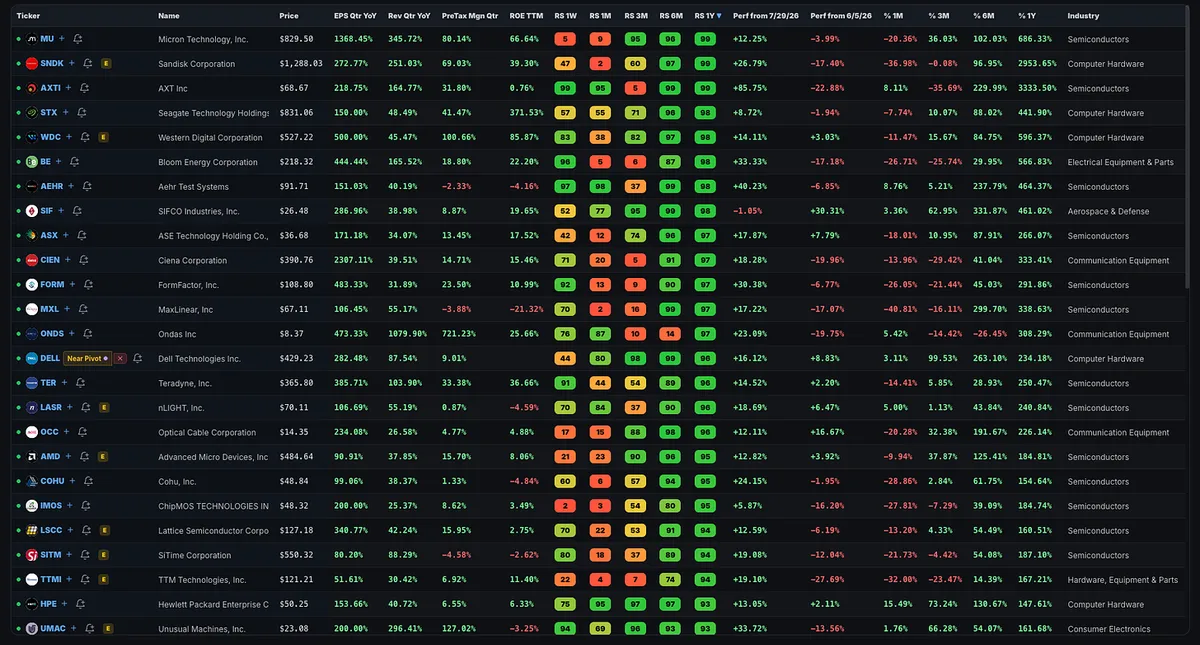
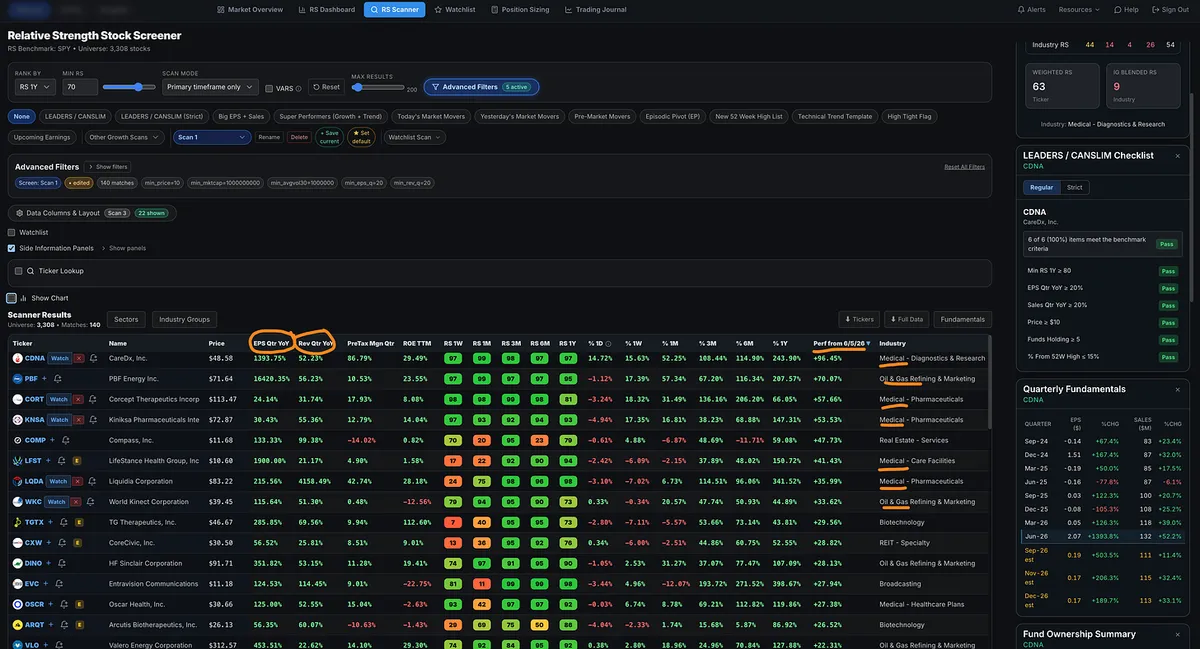
Using the same scan of liquid stocks with big earnings and sales growth, the leaderboard looks completely different depending on the starting point.

From the June 5 character change through today, the strongest performers have largely come from healthcare, energy, and other less traditional growth areas.

When performance is measured from last Wednesday’s low, however, the list shifts sharply toward semiconductors and beaten down former leaders.

That change is notable, but it is not yet proof that these stocks are back or that a new leadership cycle has begun. Many remain well below their highs. AXTI, for example, had declined nearly 75%. During corrections and bear markets, deeply damaged stocks can produce powerful short term rallies without repairing their longer term trends.

The question now is whether this develops into sustained relative strength, institutional accumulation, or fades as another rebound from oversold levels.

The market still has to provide the evidence. A rally attempt can fail or develop into a legitimate follow through, while genuine leaders must continue separating themselves through superior relative strength and price and volume action.

Same fundamental scan. Different measurement window. Completely different type of stock showing strength. It is a character change worth watching, not a conclusion.

View on Substack ↗

The Trading Service Everyone Wants Is the One I Refuse to Provide

One of the most in-demand products in trading is an alert service.

Tell people what to buy, when to buy it, and when to sell it.

I refuse to offer one.

One passage from Market Wizards helped me turn a corner in my own trading. Brian Gelber was asked:

“What does the average trader do wrong?”

He answered:

“He overtrades and begs for tips.”

That made me realize I needed to stop searching for shortcuts, stop gambling, and actually learn how to trade.

I dedicated myself to mastering William O’Neil’s How to Make Money in Stocks, along with Mark Minervini’s books and course.

You would think receiving tips from a great trader would lead to success.

It does not.

Even when the trades work, someone who has not learned the complete system will eventually find a way to sabotage the results.

After doing this for 20 years, I have never heard of anyone building enormous, lasting wealth from alert services. They may experience short-term success, but eventually they blow up or lose everything they made.

I am not going to get into the psychology behind it. Frankly, it does not matter.

Alert services have existed for decades. The traders and investors who become consistently profitable and actually keep what they make are the ones who learn how to do it themselves.

It is never the people blindly following tips and alerts.

If you do not believe me, read the Market Wizards books. You will hear the same message repeatedly. Or ask any great trader.

That is why I spent so much time building a course that teaches people how to screen for stocks, evaluate setups, manage risk, and develop a complete process.

Then I created affordable software that helps them find those opportunities themselves.

When I share a ticker, or someone in the community shares one, it should be done professionally. Share the setup, why it matters, the risk, and what would invalidate the trade, similar to how an idea would be shared inside a professional firm.

But you still need to plan and manage your own trade.

That does not mean beginners should be afraid to ask questions or share their own ideas or trades. I spend a great deal of time each day answering questions, discussing setups, and helping people think through their trades. That is education, and it is completely different from blindly asking for a ticker or an alert.

I do not want ticker sharing to become the primary function of this community. The second I see people blindly throwing out tickers or turning this into an alert room, I will call it out. If it continues, they will be banned.

Many people have not even completed the course, learned the basics, or learned how to screen for stocks.

Until you understand those fundamentals, you should not be focused on alerts or tickers.

If alerts are what you want, there are plenty of immoral people willing to take your money. Many of them have larger followings, better marketing, and will be easy to find.

Momentum Trading Strategy exists to teach people how to become growth stock investors like William O’Neil and David Ryan, and momentum traders like Mark Minervini and Dan Zanger.

So if you are looking for alerts, please do not subscribe, follow, or waste your time here.

Come back when you are ready to stop begging for tips and learn how to trade.

View on Substack ↗

The One Weak Link Keeping You From Consistent Profits

If you are not getting the results you want, the answer may not be another strategy.

You may be solid in nearly every area of trading but weak in one, and that one neglected weakness can be the difference between consistent profitability and consistent underperformance.

So step back and ask yourself:

Have I actually put in enough work to understand, practice, and improve in each of these areas?

Market environment: Do you understand the conditions you are trading in and know when your strategy performs best?

Proven setups: Do you have a clearly defined playbook, or are you trading whatever looks interesting that day?

Chart reading: Can you distinguish a proper setup from a defective one, an extended stock, or a stock beginning to break down?

Execution: Have you practiced your setups enough to execute them with precision?

Position sizing and risk management: Do you know how much to risk, how large to trade, and which position-sizing strategy fits your system and risk tolerance?

Stock selection: Are you consistently screening for accelerating earnings and sales, high relative strength, institutional demand, and strong industry groups?

Sell rules and trade management: Do you know how to place your stop? Do you have rules for cutting losses, protecting profits, adding to winners, and selling into strength or weakness?

Trading psychology: Can you follow your rules through losses, drawdowns, and even success? I have watched traders prove they have an edge, grow their accounts, then suddenly sabotage themselves and return to square one. They repeat the same cycle because something deeper has never been addressed. I am not a psychologist, but I have seen it enough to know this area should never be ignored. Maybe it is not you. But maybe it is.

Trade planning: Are you creating a plan before money and emotions become involved?

Rules and business plan: Are you running your trading like a serious business, or improvising every day?

Review: Are you conducting after-action reviews to identify what worked, what failed, and what must improve?

Study: Are you studying the biggest winning stocks in history and learning the characteristics they repeatedly shared?

Have you read the books? Taken the course? Learned how to properly use professional screening and market-analysis tools such as MarketSurge or the Momentum Trading Strategy software?

You can be strong in nearly every one of these areas and still underperform because of one neglected weakness.

Sometimes the breakthrough is not finding something new.

It is finally fixing the part of your trading you have been avoiding.

View on Substack ↗

Most Traders Don’t Have an Information Problem. They Have an Effort Problem.

“You can lead a horse to water, but you can’t make it drink.”

There has never been more trading information available.

Books. Courses. Screeners. Software. Podcasts. Interviews. Market history. Risk tools.

Yet most traders still refuse to do the work required to become consistently profitable.

They want the winning stock without learning how to find it.

They want confidence without preparation.

They want discipline without rules.

They want results without reviewing their trades, studying charts, understanding market conditions, mastering position sizing, or building a repeatable process.

I used to share stocks I was watching, entry levels, stop locations, and trade-management ideas. Many of those stocks went on to gain hundreds of percent.

But I eventually realized I wasn’t creating better traders.

I was creating dependence.

So I built a course to teach people how to find their own stocks. Then I built software to give them the tools to scan, analyze, manage risk, and review their performance.

But none of it matters if they refuse to use it.

The course cannot help you if you don’t take it.

The software cannot help you if you don’t learn it.

The rules cannot protect you if you keep breaking them.

This message isn’t for everyone.

It’s for the 1%.

Also, the 1% can be anybody.

Kristjan Kullamägi was a security guard before turning a few thousand dollars into more than $100 million.

Mark Minervini was broke and a junior-high school dropout before becoming one of the greatest stock traders of his generation.

The market doesn’t care where you came from.

It doesn’t care about your education, gender, religion, ethnicity, job title, or social status.

It cares about what you consistently bring to it:

Preparation. Discipline. Risk management. Emotional control. Relentless review.

The 1% isn’t a group you are born into.

It is a group you choose to join through your actions.

View on Substack ↗

The Skill That Separates Profitable Traders From Everyone Else

Most people think great traders are great winners.

They’re not.

They’re great losers.

That sounds backwards until you realize what actually destroys trading accounts.

It isn’t bad entries.

It isn’t bad indicators.

It isn’t even bad strategies.

It’s the inability to lose well.

The market doesn’t reward being right. It rewards managing being wrong.

The trader who refuses to take a 6% loss eventually takes a 30% loss.

The trader who keeps averaging down eventually blows up.

The trader who protects their ego instead of their capital eventually has neither.

The irony is that the better you become at accepting small losses, the bigger your winners become.

Why?

Because you’re no longer afraid.

You’re free to take the next setup.

You’re free to size up when conditions are favorable.

You’re free to let your winners compound because you know a loss isn’t a personal failure. It’s simply the cost of doing business.

Tom Hougaard built an entire book around this idea: Best Loser Wins. His central argument isn’t that great traders avoid losing. It’s that they lose differently. They accept losses without emotional attachment and without trying to “get even.”

The goal isn’t to become a better winner.

The goal is to become an elite loser.

Because in trading, the people who lose the best…

Win the most.

View on Substack ↗

One Account Made 4%. Another Made 95%. The Trades Were Identical.

Most traders assume that if two people take the same trades, they should produce roughly the same results.

Same starting capital. Same broker. Same commissions. Same entries. Same exits. Same fully automated trading system.

The results should be nearly identical, right?

They were not even close.

In Van K. Tharp’s Trading Beyond the Matrix, the book describes a system traded across 25 separate accounts. Each account began with $100,000 and took exactly the same trades.

The system was profitable in every account, but the returns ranged from 4% to 95% in one year and 2% to 72% the year before.

How is that possible?

The difference was position sizing.

One account risked only 0.5% of its equity per trade. It experienced the smallest drawdowns, but it also produced the smallest gains.

Another account increased its risk as the account moved further into profit. That investor regularly earned more than 50% annually, but also experienced a drawdown as large as 65%.

Same system. Same edge. Same trades.

Completely different outcomes.

Everyone says risk management is important.

Everyone says position sizing matters.

There are entire books about trading psychology, discipline, and controlling emotions. But very few books actually make you understand how dramatically position sizing can change your results.

Van Tharp’s books did that for me.

The best way to experience it is through the Van Tharp marble game.

Every person receives the exact same sequence of trades. The only decision each player makes is how much to risk.

By the end of the game, one person might be bankrupt. Another might make 2%. Another might make 15%. Another might double the account.

The only thing that changed was how much each person risked.

That is why I built the marble game directly into the Momentum Trading Strategy software.

You can run automated simulations, play the original version against other traders, select prebuilt strategies with different win rates and expectancies, or enter your own custom trading strategy.

Then you can test different position-sizing methods and watch what happens over dozens or hundreds of trades.

It will change the way you think about risk.

You begin to see how overbetting destroys a profitable strategy. You see how smaller risk protects you but may prevent you from reaching aggressive objectives. You see how drawdowns affect your psychology. You see how compounding works in both directions.

Most importantly, you realize that finding a profitable strategy is only part of the equation.

Your strategy determines whether you have an edge.

Your position sizing determines whether you survive long enough to benefit from it, whether you can emotionally tolerate the drawdowns, and whether you ultimately reach your objectives.

Two traders can follow the same signals and trade the same stocks.

One can go broke.

The other can become wealthy.

That is not theory. It is mathematics.

View on Substack ↗

The Market Doesn’t Care How Smart You Are. Read That Again.

Another superstar hedge fund manager just blew up.

After posting enormous returns over the last few years, excessive leverage and poor risk management caught up with him.

If you’ve studied market history, you’ve seen this movie before.

It isn’t rare. It repeats.

Every few years, another “genius” appears. The returns look unstoppable. Confidence turns into overconfidence. Position sizes grow. Leverage increases. Risk controls slowly disappear.

Then one trade, one event, or one unexpected move erases years of success.

I’m not against leverage.

I use leverage.

But leverage only amplifies what already exists. If your risk management is poor, leverage simply helps you fail faster.

This is also why I laugh when people assume systematic traders or algorithmic funds are immune. Many of the biggest blowups in history came from highly sophisticated models combined with excessive leverage and the belief that “this time is different.”

The market doesn’t reward intelligence.

The market rewards discipline.

You do not need to be the smartest trader in the room.

You need to be the trader who is still standing ten, twenty, and thirty years from now.

View on Substack ↗

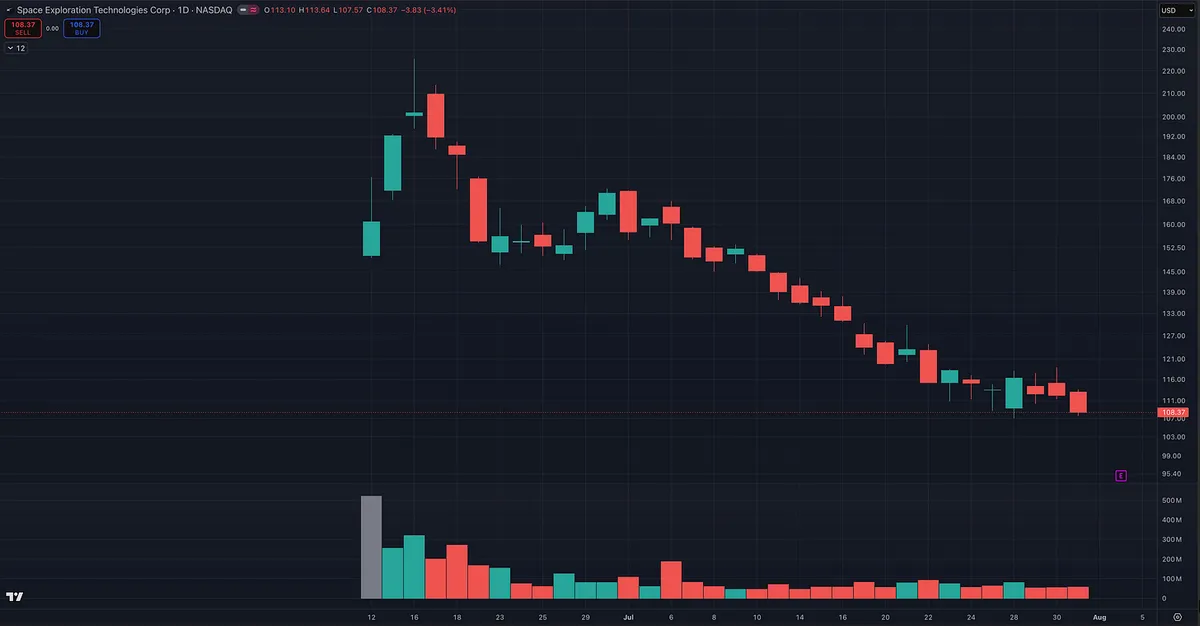
What Happened to All the SpaceX Buyers?

If you study market history, run even a basic backtest, or conduct any serious research, you quickly realize that blindly buying hype is usually a bad bet.

I may own SPCX one day. I think SpaceX could ultimately become an incredible public company.

But liking the company and liking the setup are two completely different things.

Buying a heavily hyped IPO straight out of the gate and simply holding it is not what I consider a low-risk, high-reward opportunity.

There is very little price history, no established base, and often no logical place to define your risk.

The better opportunity frequently comes later, after the initial excitement fades, price discovery takes place, and the stock has time to build a real base.

That entry could come six, twelve, or even eighteen months later at a lower price. Sometimes many years later.

It could also come at a higher price, after the stock has proven itself and offered a proper setup.

I do not need to own the first move.

I want the move that gives me the best combination of confirmation, defined risk, and potential reward.

But human nature will continue to repeat itself.

People will continue chasing hype, convincing themselves that this time is different, and laughing at experienced traders who warn them to be patient.

They will say the older traders do not understand the opportunity.

Then the market will teach the same lesson it has been teaching for more than a century.

Quoting Momentum Trading StrategyThe IPO Trap Most Traders Fall For A lot of people are getting excited about a potential SpaceX IPO. And I get it. Big company. Big story. Big hype. Lots of emotion. But this is where a lot of inexperienced investors get caught. They buy on day one with no game plan. No entry strategy. No risk plan. No understanding…
View on Substack ↗

None of This Knowledge Started With Me

I’ve learned from many of the same books I’ve shared with you, especially the work of William O’Neil and Mark Minervini.

I’ve also been fortunate to learn from mentors who were willing to share their experience, their mistakes, and the lessons it took them years to understand.

None of this knowledge is mine alone.

Every generation of traders learns from the people who came before them, tests those principles through their own experience, and eventually passes the lessons forward.

That is all I’m trying to do.

I’m taking what others were generous enough to teach me, combining it with what the market has taught me over the years, and sharing it in a way that may help someone else avoid a few mistakes and shorten their learning curve.

Maybe one day, you’ll do the same for another trader.

That is how knowledge survives.

One person learns it.

One person applies it.

Then one person passes it on.

View on Substack ↗

Everyone’s Afraid of an AI Bubble. They’re Missing the Point.

We are likely in an AI bubble.

That does not mean artificial intelligence is fake, useless, or incapable of changing the world.

Railroads changed the world and helped fuel major investment manias.

The automobile, radio, electricity, aviation, and other new technologies helped drive the speculative boom of the 1920s.

The internet changed the world and created the dot-com bubble.

The pattern is familiar.

Transformative innovation attracts capital.

Capital attracts excitement.

Excitement turns into speculation.

Eventually, prices run ahead of reality.

Then the bubble bursts.

But the crash does not make the technology disappear.

Most of the weak companies are wiped out, capital becomes more disciplined, and the strongest survivors continue building the future.

That is often where the real transformation begins.

So being in a bubble does not mean we stop trading.

For a growth stock or momentum trader, bubbles can create some of the greatest opportunities in the market.

The real danger is not participating, and participating without sell rules.

Inexperienced investors buy the biggest names, assume the trend will continue forever, and never decide when to take profits or when to exit.

That is not what we do.

We do not need to predict the exact day the bubble pops.

We follow price, volume, market direction, institutional selling, and the behavior of leading stocks.

As the evidence weakens, we peel out of positions and raise cash.

William O’Neil taught it.

Mark Minervini teaches it.

It is exactly what I teach inside the Momentum Trading Strategy course.

The bubble is not what should scare you.

Having no sell rules should.

View on Substack ↗

The Best Leaders Often Look Broken Before They Lead Again

A stock’s RS weakening does not automatically mean its leadership run is over.

Strong stocks rarely move straight up. They pull back, correct, build new bases, and sometimes look broken before beginning another major advance.

That is why I continue tracking many current and former leaders even after their weekly or monthly RS weakens.

Over the past year, we saw this repeatedly in semiconductor and memory stocks. Many pulled back to the 50-day moving average, found support, rebuilt their setups, returned to new highs, and made another substantial run.

Traders who immediately removed them from their watchlists missed some of the best opportunities of the year.

However, I would never buy a stock simply because its one-year RS remains strong.

That longer-term rating may still be reflecting what the stock accomplished several months ago. The weekly and monthly RS readings give us a much better picture of whether the stock is currently gaining strength, resting constructively, or beginning to lose leadership.

The real question is whether the stock is undergoing a normal correction within an intact uptrend or showing evidence that its leadership cycle may be ending.

RS alone cannot answer that.

You also have to examine the price structure, moving averages, volume, earnings and sales trends, industry group strength, and how the stock behaves during the pullback.

The current action in many former leaders is noticeably different from some of the earlier resets.

Since the tariff scare in the spring of 2025, many leaders following that recovery found support near their 50-day moving averages and eventually returned to new highs. Coming out of the March 2026 correction, many of the strongest names were also stocks that had led previously, but they generally held up better and did not look as technically damaged.

This time, many semiconductor and memory stocks have fallen below their 50-day moving averages, made lower lows, and moved closer to their 200-day lines.

That is a change in character.

It deserves more caution, but caution does not mean automatically declaring the move over.

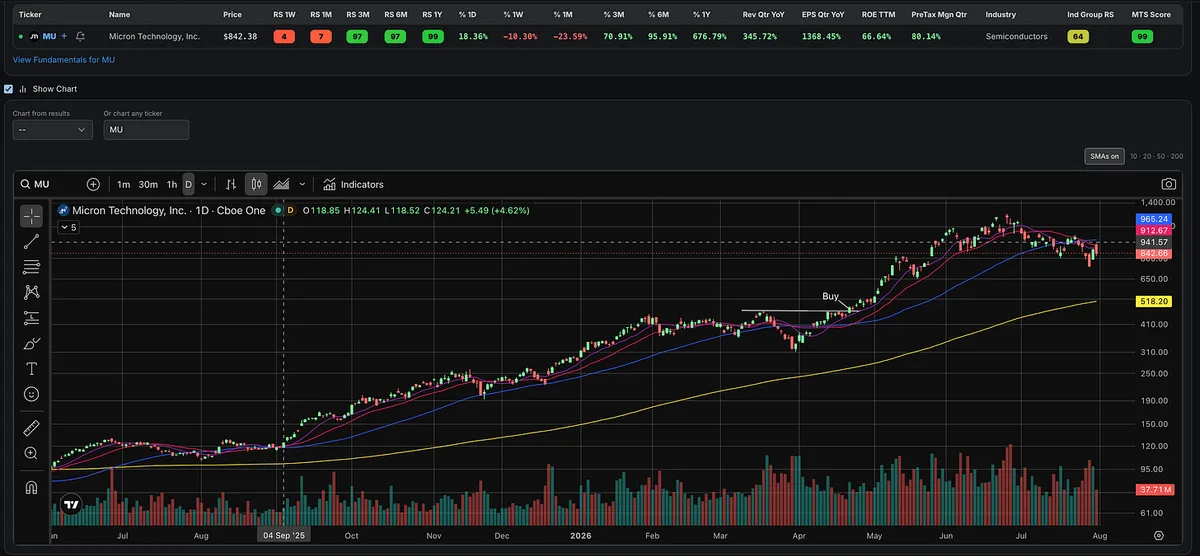
MU is a perfect example.

It broke below the 50-day, made a lower low, and looked as though it might continue toward the 200-day. Instead, it repaired the damage, reclaimed its moving averages, returned to new highs, and eventually produced one of the best setups of the year.

The same thing could happen with some of today’s beaten-down leaders.

The goal is not to predict which ones will return. The goal is to keep them on the watchlist and let their price and volume action prove that institutional demand has returned.

Some will reclaim the 50-day, tighten up, rebuild sound bases, and become leaders again.

Others will fail to repair the damage and continue toward Stage 3 or Stage 4. New industries may also emerge and replace some of the groups that have led for the past year.

That is why flexibility and adaptability matters.

Do not become emotionally attached to the old leaders, but do not forget about them either.

Breaking the 50-day puts a stock into prove-it mode. It does not automatically mean the leadership story is over.

View on Substack ↗

Would You Risk Months of Progress on One Earnings Report?

You finally find the right stock.

The setup works. The stock breaks out. You sit through the normal pullbacks, manage the position correctly, and build a meaningful profit.

Then you see the earnings date.

Now the question starts running through your head:

Do I hold and risk giving back the gain, or sell and watch the stock gap up without me?

Every serious trader eventually faces this decision.

There is no perfect answer because earnings reactions are unpredictable. A company can report outstanding numbers, raise guidance, and still sell off. Another company can report disappointing results and gap higher.

That is why I never buy a new position immediately before earnings.

But if earnings are still a couple of weeks away and the setup is excellent, I may take the trade. That gives the stock time to move higher and allows me to build a profit cushion before the report.

If I am up 15% to 20%, I will often sell part of the position into strength and hold a smaller piece through earnings.

But here is the part traders often misunderstand:

A profit cushion does not eliminate earnings risk.

A stock can easily gap down more than your entire gain. The real question is not simply whether you are profitable.

The real question is:

How much damage could this position do to your account if the reaction is brutal?

That is what determines how much I hold.

I consider the health of the market, the strength of the industry group, the stock’s price action, its volatility, my total exposure, and how well I have been trading recently.

When the market is healthy, my portfolio is performing well, and the stock remains a leader in a strong group, I may accept more earnings risk.

When the market is deteriorating or my trades have been struggling, I protect capital. I may reduce heavily or sell the entire position before the report.

That is progressive exposure.

You earn the right to take more risk through strong performance. You do not force risk when the market or your own results are telling you to become defensive.

Longer-term positions can be different. If I have owned a stock for months, already held through a previous report, and built a very large cushion, I may hold the next earnings report without trimming.

But even then, I am not holding blindly.

The market, the industry group, the fundamentals, and the stock’s price action still need to support the decision.

Some great traders occasionally hold through earnings with reduced size and a cushion. Others refuse to hold through earnings at all.

The lesson is not that one approach is always right.

The lesson is that you need a rule before the report arrives.

Never wait until the final minutes before the close and make an emotional decision.

Know how much you are willing to lose.

Know how much of the position you are willing to hold.

Know what a severe gap would do to your total account.

And remember this:

If holding the position is going to prevent you from sleeping, the position is probably too large.

Earnings risk cannot be eliminated.

But it can be planned for, reduced, and controlled.

That is the difference between holding with a strategy and simply holding with hope.

This is the type of practical risk-management framework I teach inside the MTS Course, including a method for using a stock’s own volatility to estimate the type of earnings gap you should be prepared to withstand.

View on Substack ↗

Most Traders Look at Price. The Best Look at This.

William O’Neil did not invent relative-strength analysis, but he was one of the most influential investors to make it practical, measurable, and widely accessible to individual traders.

Through Investor’s Business Daily, MarketSmith, and what is now MarketSurge, O’Neil helped popularize the idea of ranking stocks by their price performance relative to the rest of the market.

His Relative Strength Rating became a foundational tool for identifying potential market leaders before they became obvious to everyone else.

His book, How to Make Money in Stocks, is still one of the best places to begin studying growth investing, momentum, earnings growth, institutional demand, relative strength, and overall market direction.

I used MarketSurge for years and eventually built my own software for paid subscribers around many of those same foundational principles.

It includes many of the features I relied on most, along with expanded relative-strength tools, custom lookbacks, anchor-date analysis, historical RS, and multiple timeframe comparisons, all at a much lower price.

Relative strength will not tell you everything.

But once you truly understand how to use it, you will never look at the market the same way again.

View on Substack ↗

You Don’t Need to Be Right to Make a Lot of Money

One of the biggest turning points in my trading was realizing that I did not need to be right most of the time to make a lot of money.

In Module 6 of the MTS Course, we break down expectancy and compare high-win-rate and low-win-rate trading systems.

Both can make money.

Both can lose money.

A trader can win 70% of the time and still be unprofitable if the losses are significantly larger than the gains. Another trader can be wrong more than 50% of the time and build an incredible career by keeping losses small and allowing the winners to become disproportionately large.

Like many of the Market Wizards who influenced me, I have gravitated toward a system designed to make money even when I am wrong more often than I am right.

Yet beginners are naturally attracted to whoever appears to be right the most on social media.

Someone can be right on most of their public calls and still not make money.

You rarely see the position sizing, the losses, the risk taken, the exits, or what happens when the trade moves against them. Being right is not the same as being profitable.

This lesson extends far beyond trading.

Nearly every successful entrepreneur talks about taking many small bets, knowing that most ideas and experiments will not work. Companies like Amazon have built cultures around experimentation because one massive success can pay for countless unsuccessful attempts.

Owning businesses and building a skincare brand has made this even clearer to me.

The majority of our ideas do not become major successes. We take controlled, low-risk bets, collect the information, adjust, and try again.

Then something eventually works.

It is usually not the idea we expected to become the biggest winner, but when it hits, it pays for the unsuccessful experiments and much more.

Those experiments were not failures.

They were the cost of discovering the winner.

Trading works the same way.

Keep taking intelligent, controlled bets. Protect yourself when you are wrong. Stay open when you are right.

You do not need every trade, product, idea, or experiment to work.

You only need to make sure the downside remains small enough that you are still there when the big winner finally arrives.

Learn more about the risk-management and position-sizing framework here:

https://tradingmomentum.substack.com/p/momentum-trading-strategy-risk-management

On SubstackMomentum Trading Strategy: The 100-Year Playbook Behind the Biggest Winning Stocks — Module 6 Risk Management & Position Sizing
View on Substack ↗

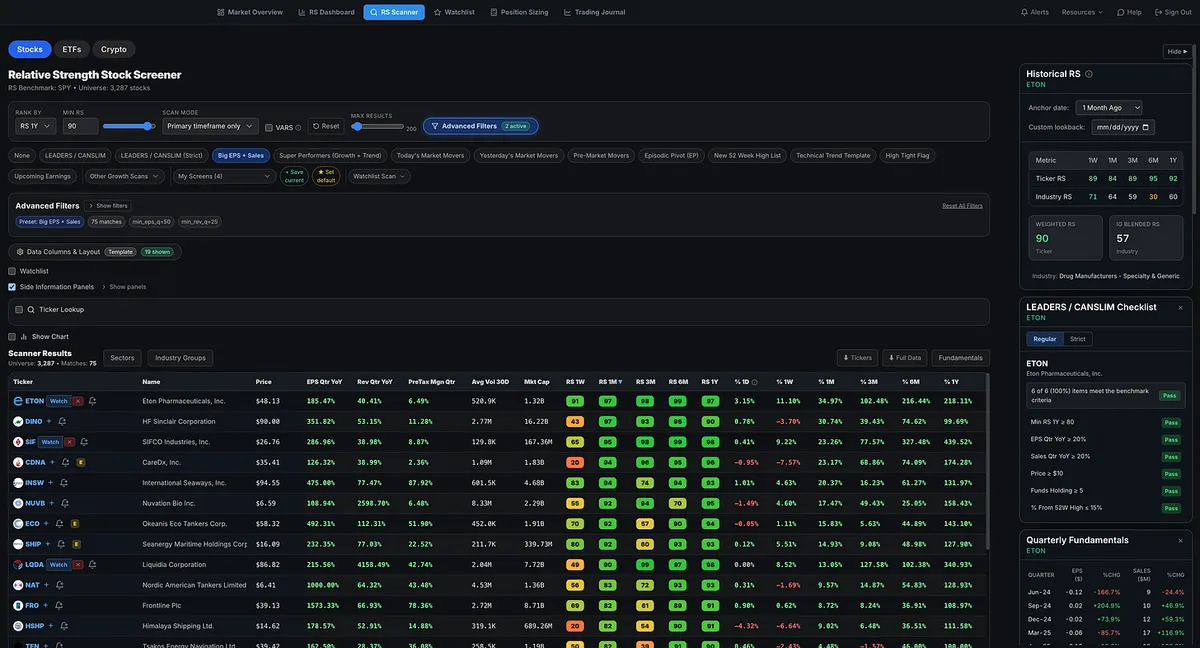
Why Doesn’t the RS Scanner Include Every Stock?

A member recently asked why the MTS RS Scanner shows roughly 3,200 stocks when platforms such as TradingView list substantially more.

The difference is intentional.

The purpose of the RS Scanner is not to rank every security that happens to be listed. It is to rank a practical universe of stocks that growth and momentum traders could realistically consider trading.

The current universe requires:

  • A NASDAQ or NYSE listing

  • A share price of at least $5

  • Average daily volume of at least 100,000 shares

  • A market capitalization of at least $100 million

  • No OTC securities

Why filter the universe?

Because Relative Strength is only as useful as the stocks being compared.

Including thousands of illiquid penny stocks, dormant securities, and thinly traded microcaps may produce a larger universe, but it does not necessarily produce more useful rankings.

A stock can rise sharply simply because a small amount of buying moves the price. That does not mean it is attracting meaningful institutional demand or becoming the type of sustained market leader most momentum traders are looking for.

The current filters are actually fairly lenient.

William O’Neil often used a minimum share price of $10, while traders such as David Ryan, Mark Minervini, Dan Zanger, and Kristjan Kullamägi generally focus on stocks with far greater liquidity.

The goal is not to rank every stock.

The goal is to rank the stocks momentum traders are most likely to actually trade.