The Market Delivered a Follow-Through Day
After reviewing today’s closing volume across the major indexes, futures, and ETFs, the message is clear: the weight of the evidence supports increasing exposure.
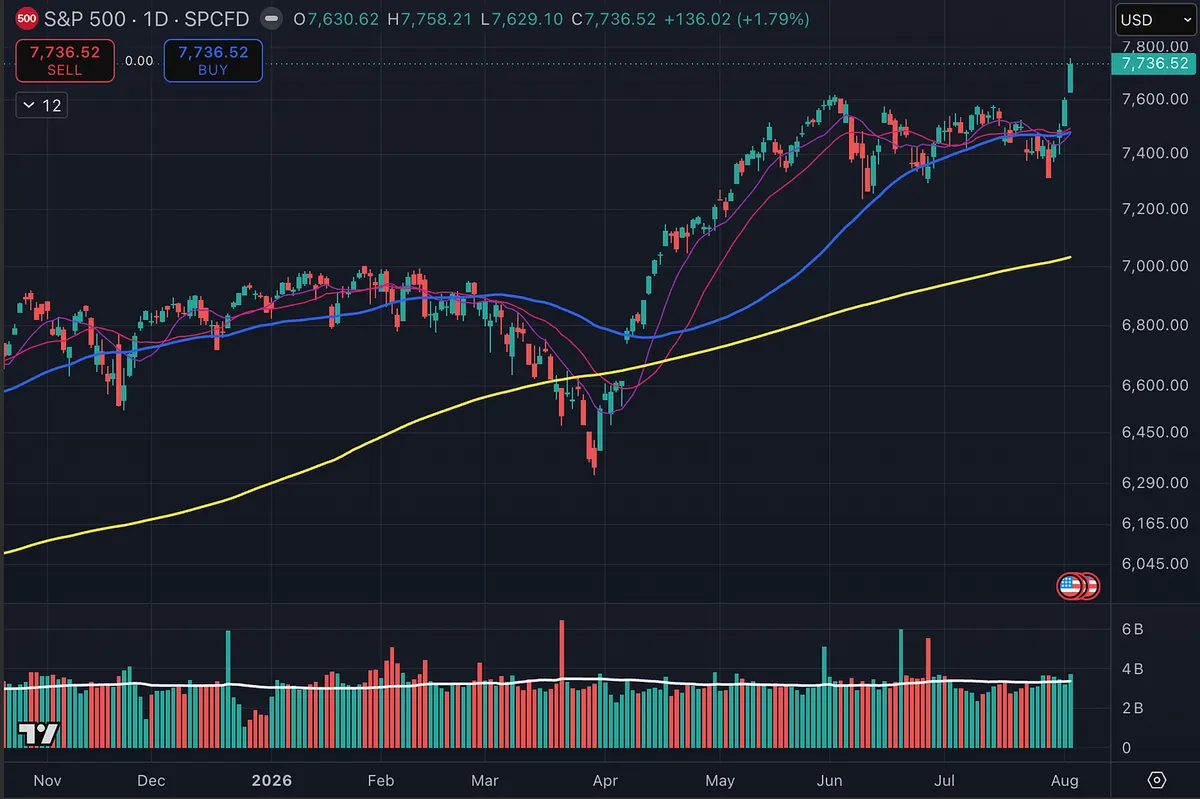
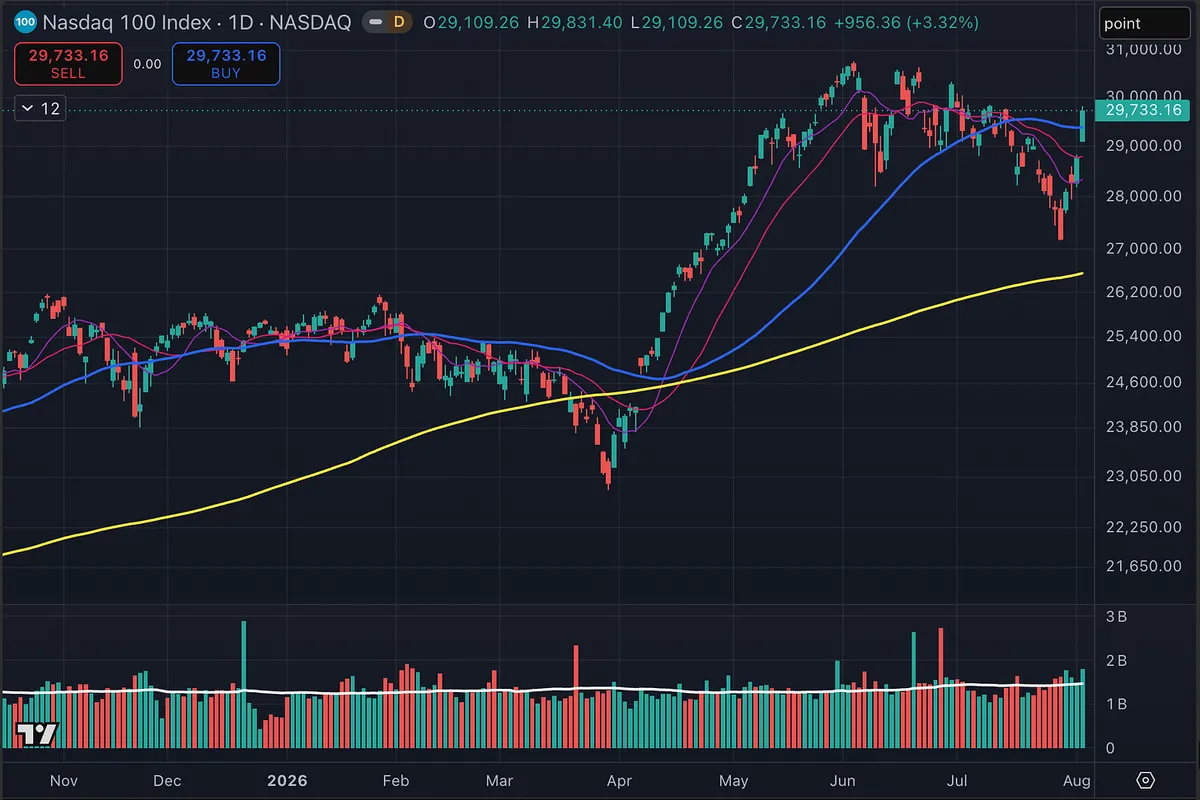
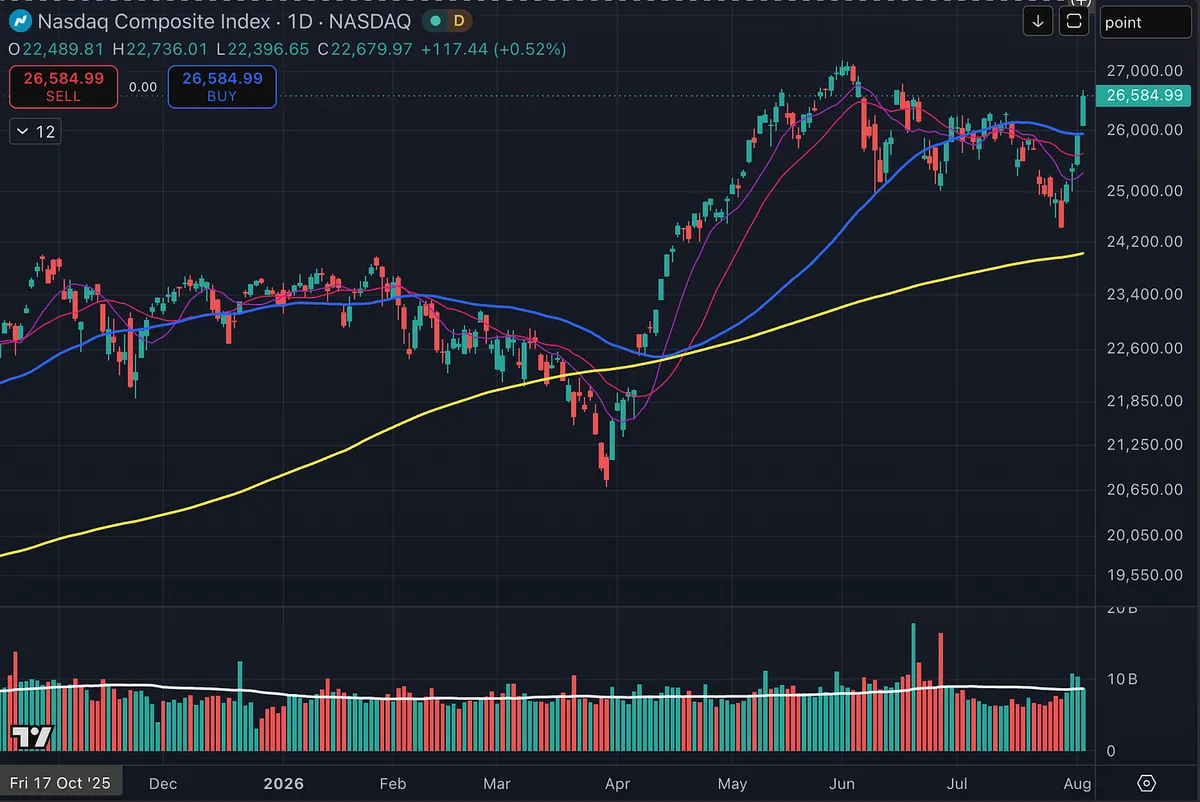
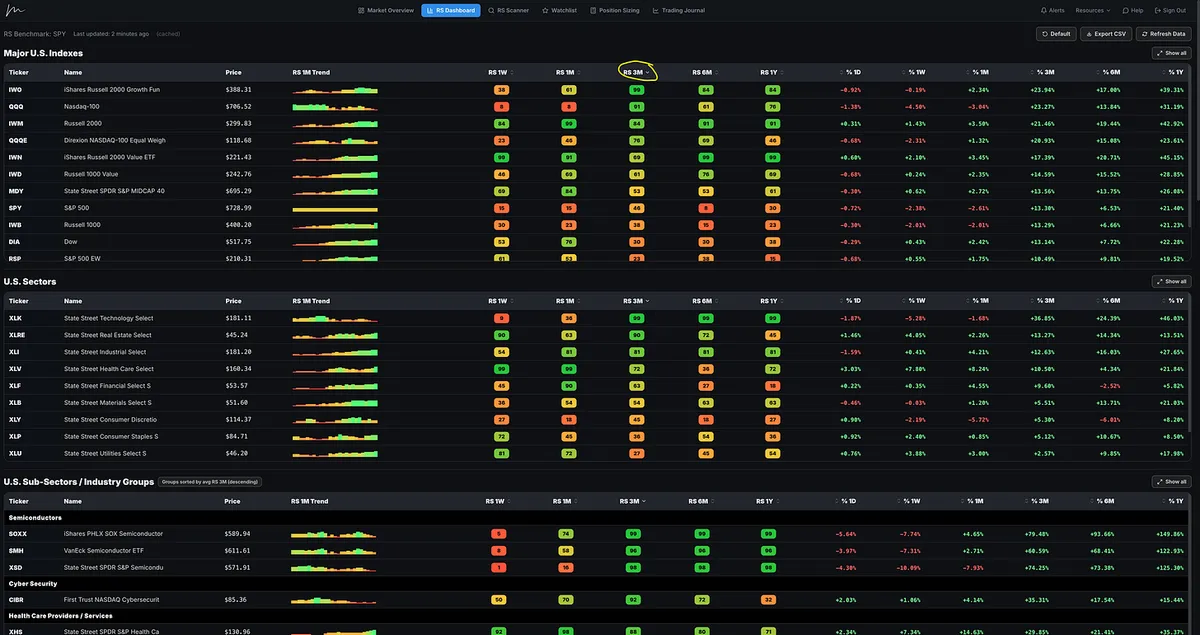
The S&P 500 gained 1.79%, the Nasdaq 100 rose 3.32%, the Nasdaq Composite advanced 2.59%, the Russell 2000 climbed 1.85%, and the Dow gained 1.72%.
Volume confirmed the move across nearly every major benchmark. The S&P 500 and Nasdaq 100 traded higher on increased volume in the cash indexes, futures, and their corresponding ETFs. The Dow and DIA also posted higher volume.
The one exception was the Nasdaq Composite. Its reported index volume was lower than the previous session, so it did not technically qualify for an official follow-through day on its own. However, ONEQ, the Fidelity Nasdaq Composite Index ETF, did trade on higher volume.
The S&P 500 and Nasdaq 100 both delivered follow-through-day signals, the major index ETFs confirmed the move, and the Nasdaq Composite has reclaimed all of its key moving averages.
The Broader Market Is Confirming the Move
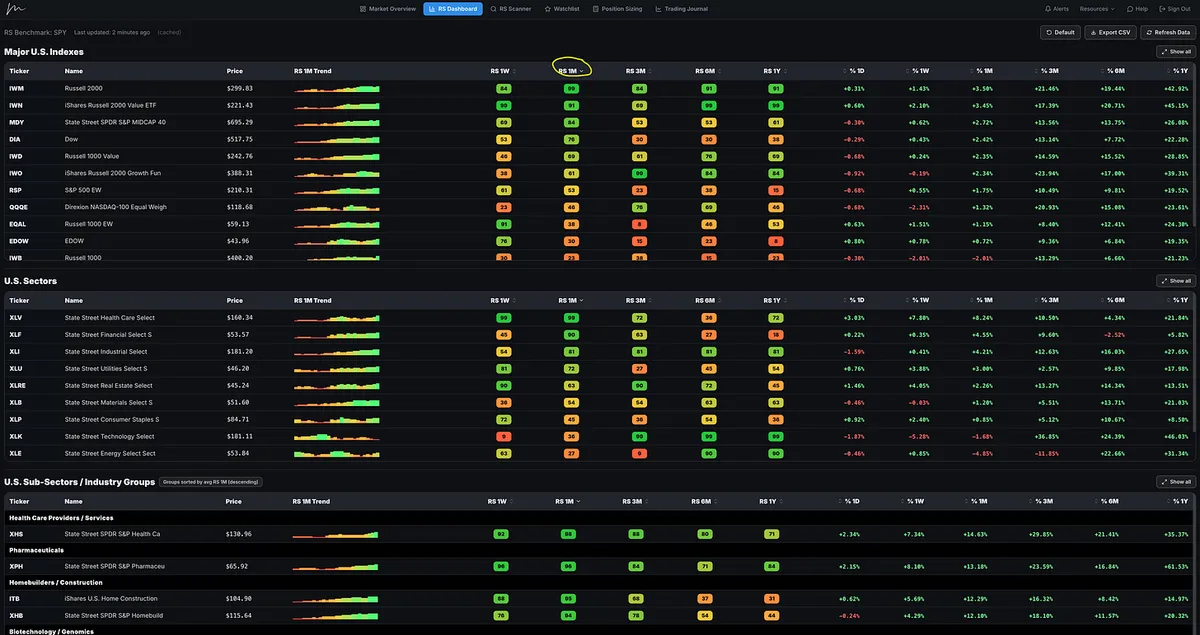
The signal is also supported by extraordinary strength beneath the surface.
The S&P 500 and Dow are at all-time highs. The Russell 2000 is sitting near its record high, while equal-weight indexes such as RSP, EDOW, and the equal-weight Russell 1000 are also at or near all-time highs.
The strength extends well beyond the largest companies. The S&P MidCap 400 ETF, MDY, is at an all-time high. The Russell 1000, major value indexes, the Vanguard Total Stock Market ETF, and the NYSE Composite are also at or near record highs.
Meanwhile, the Nasdaq Composite, Nasdaq 100, and the equal-weight Nasdaq 100 ETF, QQQE, are all trading above their key moving averages.
This shows broad participation. The market’s strength is not confined to a small area of the market. Large caps, mid-caps, small caps, equal-weight indexes, value stocks, growth stocks and the broader NYSE are all participating.
That breadth adds credibility to the follow-through signal.
Why All-Time Highs Matter
All-time highs matter because they remove most of the overhead supply created by investors who previously bought at higher prices and are waiting to sell when they get back to breakeven.
When an index or stock moves into new-high territory, virtually everyone holding it is sitting on a profit. There is no large group of trapped investors waiting to sell simply to recover their original investment.
That does not mean the market cannot pull back. It means a major source of potential resistance has been removed, allowing prices to advance more freely when institutional demand remains strong.
This is why legendary traders such as Jesse Livermore, Nicolas Darvas, William O’Neil, and Mark Minervini have placed so much importance on stocks and markets moving into new-high ground.
Strength often produces further strength. The strongest markets and stocks can appear expensive, extended, or “too high” long before their advances are finished.
What the Evidence Is Telling Us
The evidence supports increasing exposure and participating in this market.
That does not mean immediately moving to maximum exposure. It means adding positions progressively as individual stocks confirm the market’s strength and our individual trades begin working.
The previous two occasions when the market experienced a meaningful correction, reclaimed the 50-day moving average, and produced this type of follow-through signal were May 12, 2025, and April 8, 2026.
Today’s action is the signal we have been waiting for. The focus now shifts to execution: identifying the strongest leadership, entering positions with disciplined risk management, and allowing successful trades to earn additional exposure.