Momentum Trading Strategy

Notes

Short lessons on momentum trading, every day.

Every note from Substack, in one place: risk, setups, leading stocks, market conditions and the mindset behind them. Search them, browse by topic, or filter by stock.

Showing 361–380 of 1222 notes

View on Substack ↗

If I Could Only Use One Indicator for the Rest of My Life, It Would Be This

As a momentum trader or growth stock investor, it is hard to beat relative strength.

If I could look at only one thing besides price for the rest of my trading career, it would be RS.

And no, relative strength is not the same thing as RSI.

At the most basic level, a standard one-year RS rating ranks a stock’s price performance over the past 52 weeks against every other stock in the market.

A stock with a 99 RS rating has outperformed 99% of the market. You are looking at one of the strongest-performing stocks over that period.

But relative strength is much more than simply sorting stocks by their one-year rating.

Suppose the market falls 20%, but a stock declines only 10%. That stock is showing relative strength.

If the market is falling or moving sideways while a stock continues advancing, that is relative strength.

You can take the analysis even further by comparing the stock with its sector, industry group, related ETF, and the strongest themes in the market.

Suppose an industry group is up 50%, but the individual stock is up only 30%. The stock may look strong in isolation, but it is actually showing relative weakness compared with its peers.

Why trade the laggard when stronger names exist within the same group?

Why take the additional company-specific risk of owning an individual stock when the sector or theme ETF is outperforming it?

Ideally, I want to see a stock outperforming:

  • The major indexes

  • Its sector

  • Its industry group

  • The market’s strongest themes

  • Other stocks across the market

And do not study relative strength only while the market is rising.

Some of the most valuable information appears during corrections.

When the market is falling, which stocks refuse to break down?

Which names hold above support, decline less than their peers, or continue advancing while everything around them weakens?

Strong relative strength during a correction does not guarantee that a stock will become a future market leader.

But it can be one of the biggest signals a momentum trader can find.

O’Neil’s research found that the best-performing stocks already had an average RS rating of 87 before beginning their major advances. In other words, the greatest winners were already outperforming nearly nine out of every ten stocks before their most explosive moves began.

This was not based on a few cherry-picked examples. O’Neil studied more than 1,000 of the market’s greatest winners, spanning more than a century, and specifically examined the degree of relative strength they displayed before their enormous advances.

FIX is a perfect modern example.

The stock turned higher and began making new highs while the broader market was still struggling. It revealed itself before the indexes confirmed the new uptrend, then went on to become a massive winner of more than 1,000%.

That is why relative strength during a correction matters so much.

The future leaders do not always wait for the market to give everyone an obvious signal. Some begin separating from the crowd before the indexes turn higher.

However, there is an important caveat.

When growth stocks are being beaten down, defensive areas will often rise to the top of the RS rankings as investors rotate toward safety.

That does not automatically make those defensive stocks the next major leaders.

When the market recovers and growth stocks begin improving, many of those defensive names quickly disappear from the top of the rankings.

Do not confuse temporary defensive strength with genuine emerging leadership.

Look for growth stocks with strong earnings and sales, improving price and volume action, strong industry-group support, and exceptional relative strength that are already separating from the market.

Strong RS during a correction is not a guarantee.

But it is one of the most important clues that a future market leader may already be emerging.
View on Substack ↗

This Is What a VCP Breakout Is Supposed to Look Like

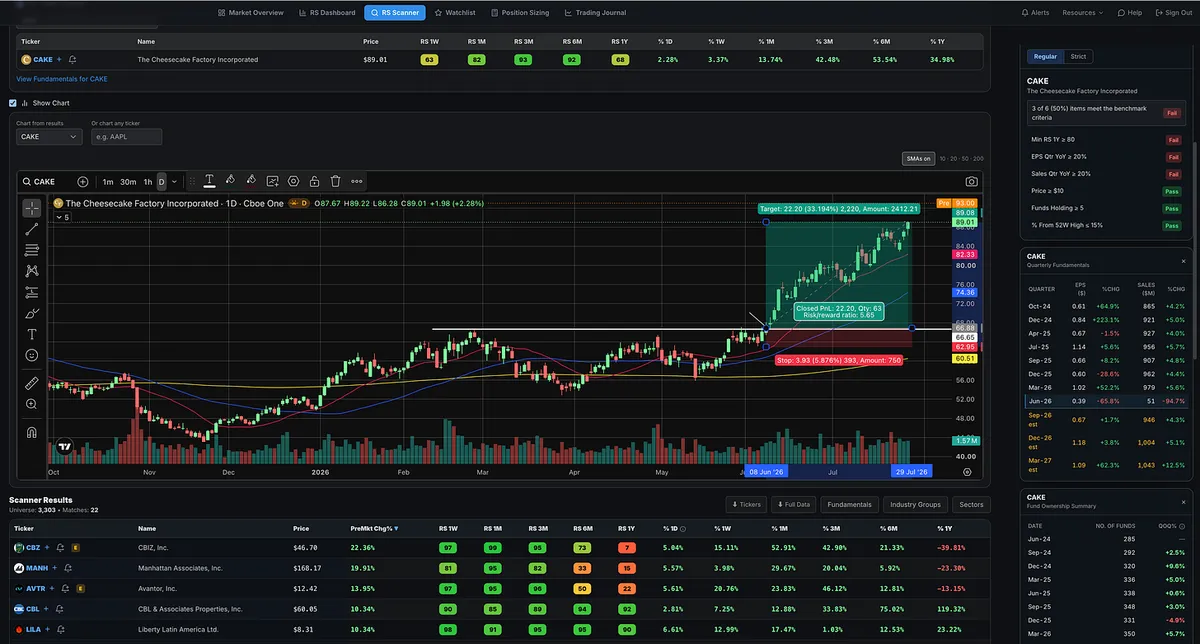
Looking through this morning’s premarket movers, CAKE, The Cheesecake Factory, immediately stood out.

The stock broke out of a well-formed base in early June.

Beautiful VCP action.

Each contraction became smaller, volatility dried up, and the tight price action provided an attractive risk-to-reward opportunity.

After the breakout, CAKE continued forming higher highs and higher lows while repeatedly finding support near its rising 20-day moving average.

Now the stock is gapping higher following earnings.

View on Substack ↗

Anchor Date Relative Strength: Find the Leaders Before Everyone Else

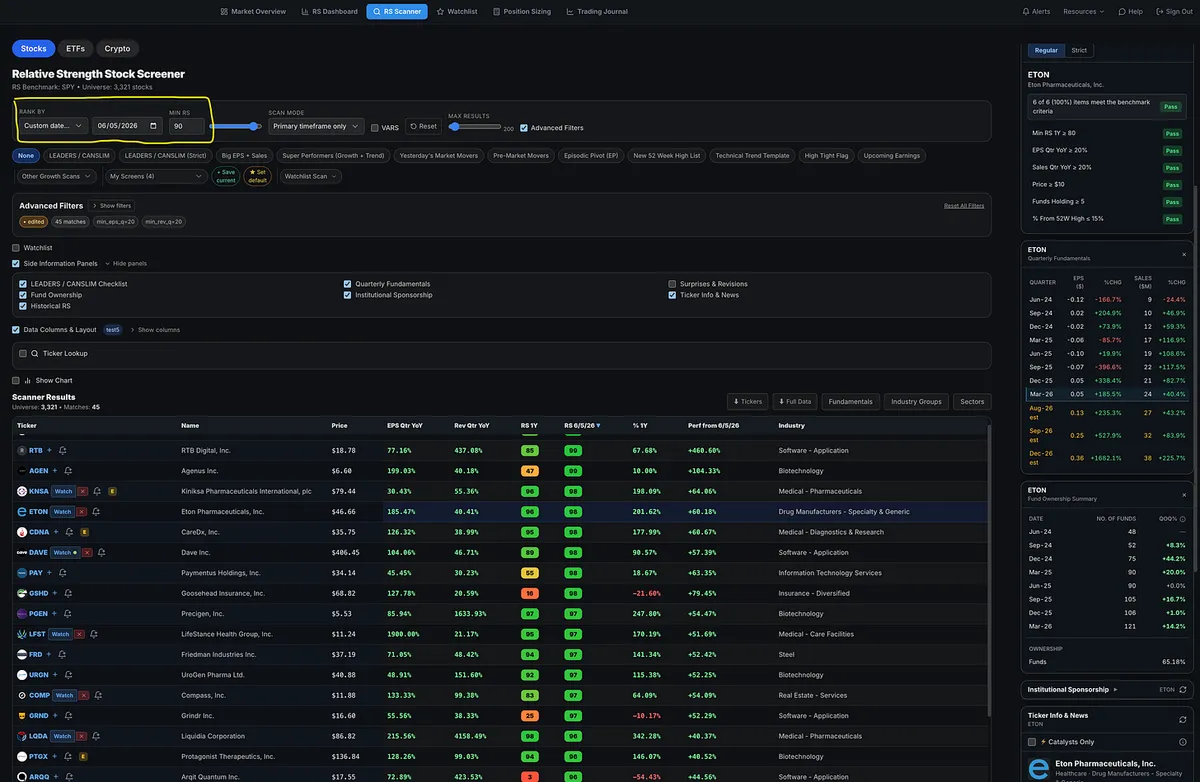
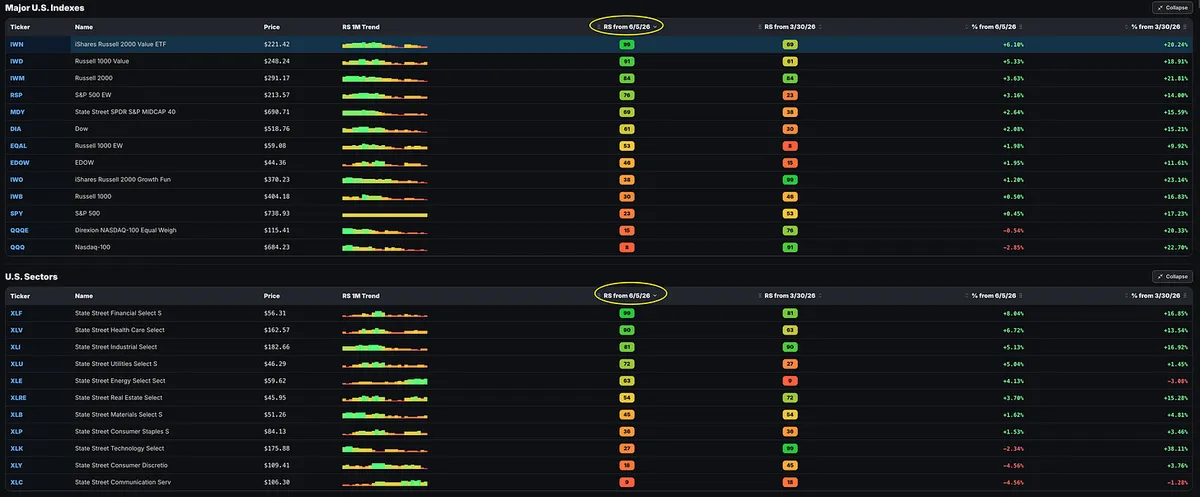
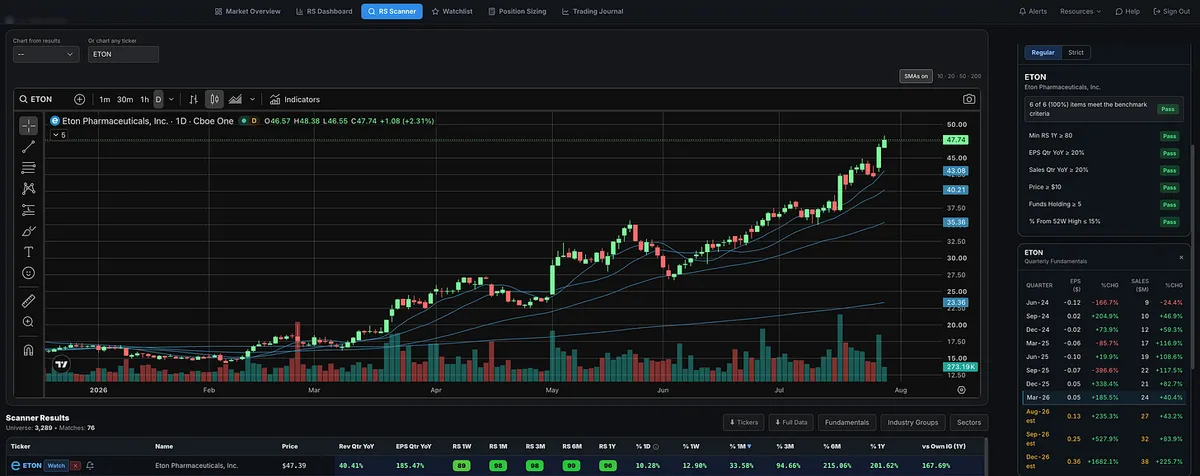
Here are several stocks with strong earnings and sales that have shown high relative strength since the market changed on June 5.

This is where Anchor Date Relative Strength becomes extremely useful.

Traditional RS ratings measure performance over fixed lookback periods, such as one month, three months, six months, or one year.

Anchor Date RS allows you to choose the exact date from which you want to begin measuring relative strength.

For example, selecting June 5, 2026, shows you which stocks have demonstrated the strongest relative performance from June 5 through today.

That is very different from a standard one-month RS rating, which only measures performance over the most recent month.

Why does that matter?

Because markets change, and the strongest stocks under the previous market conditions may not be the stocks leading under the new conditions.

When the character of the market changed on June 5, Anchor Date RS made it possible to isolate the stocks and industry groups that began outperforming from that specific turning point.

The same analysis could have been used after the market bottomed around March 30 and began a new uptrend.

Anchor Date RS tells you which stocks have performed best since the date that matters to you.

View on Substack ↗

Stop Fighting the Market

“Three out of four stocks usually follow the overall market trend, whether it’s up or down.” - William J. O’Neil

William O’Neil spent decades studying the greatest winning stocks in market history. His conclusion was simple: the majority of stocks move with the overall market.

When the market is rising, most stocks rise with it.

When the market is falling, most stocks decline with it.

This is not just something O’Neil understood. Legendary traders across generations have built their strategies around the same truth. Your odds of success improve dramatically when you align yourself with the market’s primary direction.

Yet many of you continue fighting against the current.

When the market was moving higher week after week and leading stocks were breaking out, you were afraid to pull the trigger.

Now that the market has weakened, you suddenly want to buy every dip and prove that you can find the one stock strong enough to ignore everything happening around it.

Trading is already hard enough.

You do not need to make it harder by constantly positioning yourself against the market.

View on Substack ↗

You Think This Is Bad? Zoom Out.

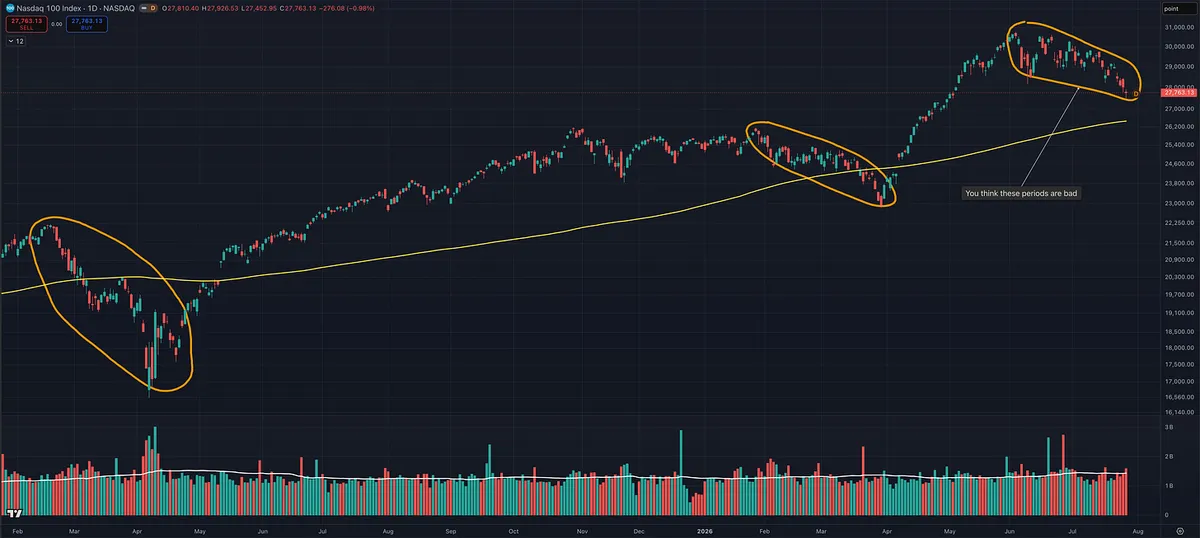
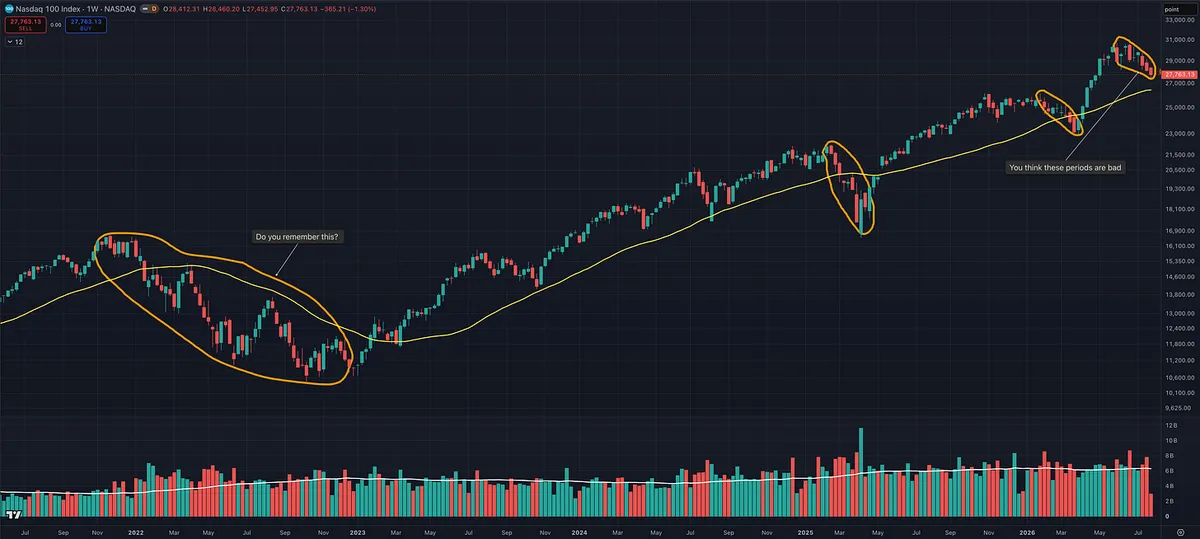
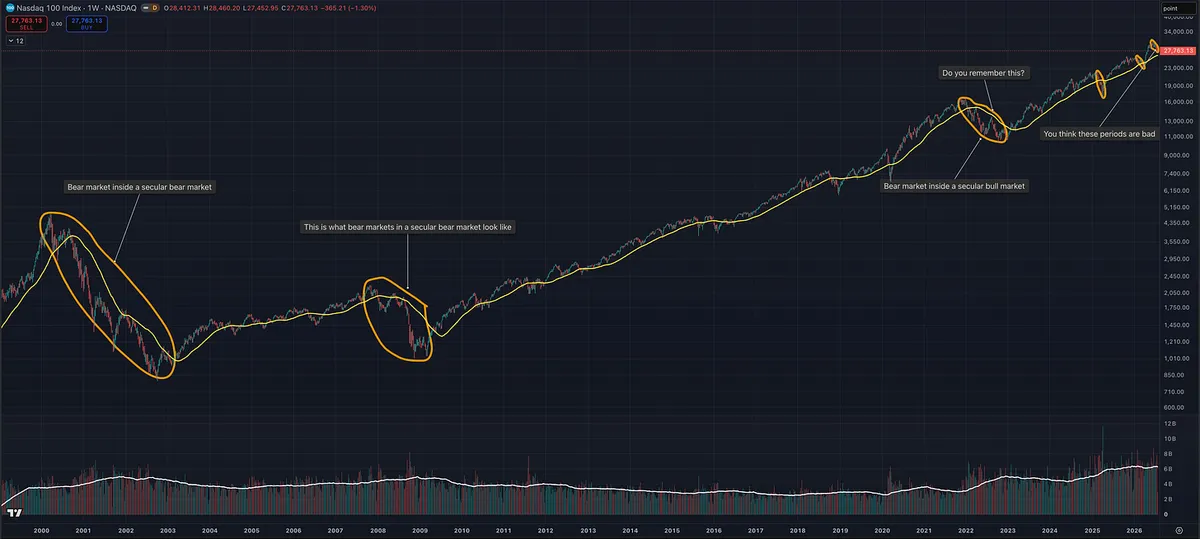
It is funny watching so many newer traders act as if every bull market consolidation or correction is some historic disaster.

Were they not trading in 2022?

And even 2022, in the grand scheme of market history, was not that bad.

Yes, it was painful. Many former leaders lost 50%, 70%, or more.

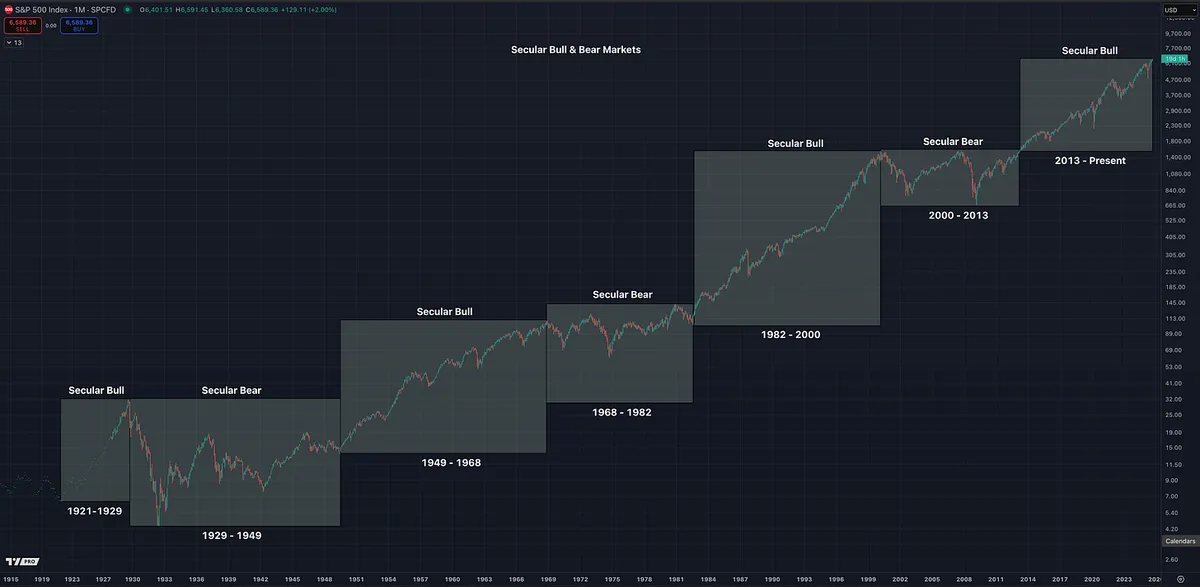
But 2022 was still a cyclical bear market inside a much larger secular bull market.

A cyclical bear market inside a secular bull market can be violent, but the market eventually repairs itself and resumes the larger long-term advance.

A bear market inside a secular bear market is an entirely different animal.

Go study 2000 through 2002.

Then study 2008.

Those declines occurred during the broader secular bear market that stretched from roughly 2000 through 2013. Rallies repeatedly failed, major indexes made little lasting progress for years, and investors could not simply assume every correction would eventually lead to new highs.

That is what a truly hostile long-term market environment looks like.

The current secular bull market will eventually end. It is aging, and nothing lasts forever.

But that does not mean every consolidation, correction, or uncomfortable stretch is the beginning of the next Great Depression.

Zoom out.

The periods that feel unbearable on a daily chart often appear as small interruptions within a much larger advance when viewed across several decades.

That does not mean you ignore weakness, hold blindly, or stop managing risk.

It means you understand context.

Respect the correction. Protect your capital. Reduce exposure when conditions deteriorate.

But relax.

Not every pullback is 2008.

Not every bear market is the beginning of a secular bear market.

Sometimes the market is simply correcting inside a much larger bull market.

View on Substack ↗

Your Strategy Isn't Broken. You're Ignoring the Context.

One of the biggest mistakes beginner traders make is believing strategies, setups, and indicators work the same way in every market.

They don't.

The same strategy can perform extremely well in one environment and struggle badly in another.

The same setup can produce powerful follow-through when the market, industry group, and stock are aligned, then repeatedly fail when those conditions disappear.

The same indicator can be bullish in one situation and meaningless in another.

Education matters, but experience develops the awareness to understand when each signal actually matters.

A novice sees an overbought reading and immediately thinks, "Sell."

An experienced trader asks:

What is the market context?

Did the market just break out of a six-month correction, with institutions returning and the indexes reclaiming key moving averages?

Or are we months into an extended rally, with leadership stocks breaking down, distribution increasing, and volatility rising?

The same indicator can flash in both situations, but the message is completely different.

After months of consolidation, a few powerful weeks may only be the beginning of the move.

After months of running hot, that same reading may be warning you to sell positions and reduce exposure.

The indicator didn't change.

The context did.

The same applies to your strategy and setups.

A breakout strategy has better odds when the market is healthy, leadership is expanding, strong industry groups are producing multiple winners, and institutions are aggressively buying.

That exact same breakout setup has much lower odds when the indexes are weakening, yesterday's leaders are breaking down, and the stock belongs to a weak industry group.

Eventually, you start saying:

"This strategy doesn't work."

But the strategy may not be the problem.

You may be using it in the wrong market, in the wrong group, and in the wrong stocks.

Experienced traders are not reading one signal.

They are reading the entire environment.

Years of screen time do not simply teach you patterns.

They teach you how the pieces fit together.

No single factor makes the decision.

It is the weight of the evidence.

Situational awareness is also difficult to maintain when you are emotionally overwhelmed by oversized positions or unwilling to accept the risk you placed in the market.

Before considering an individual trade, ask:

  • Is my strategy suited for this market?

  • Are my setups currently producing follow-through?

  • Does this indicator matter in the present context?

Before every trading day, ask:

"What kind of market am I in?"

Once you answer that question, everything else becomes easier to interpret.

Context is the lens through which every strategy, setup, and indicator should be viewed.

View on Substack ↗

The Market Already Told You. You Just Weren’t Listening.

Most traders obsess over the news.

Professionals obsess over the market’s reaction to the news.

That difference changes everything.

When a company reports outstanding earnings and sales, raises guidance, announces a major partnership, or receives another bullish catalyst, what should happen?

The stock should go up.

But what if it doesn’t?

What if it barely moves, or worse, sells off?

The news wasn’t the important part.

The market’s reaction was.

The opposite is also true.

When negative headlines seem endless, yet stocks continue making higher highs and higher lows, the market is telling you that buyers are overwhelming sellers. That’s exactly why people say bull markets climb a wall of worry.

Price is revealing something the headlines cannot.

The market is a continuous auction, and price is the final vote on whether the news actually matters.

Strong markets shrug off bad news.

Weak markets can’t capitalize on good news.

If bullish catalysts keep appearing but price refuses to advance, pay attention. Institutions may already be fully invested, expectations may already be priced in, or demand simply isn’t strong enough to push prices higher.

Either way, the message is the same.

Stop asking whether the news is good or bad.

Start asking how the market responded.

Because in the end, price is the truth.

View on Substack ↗

The Market Shift Was Hiding in the Screens

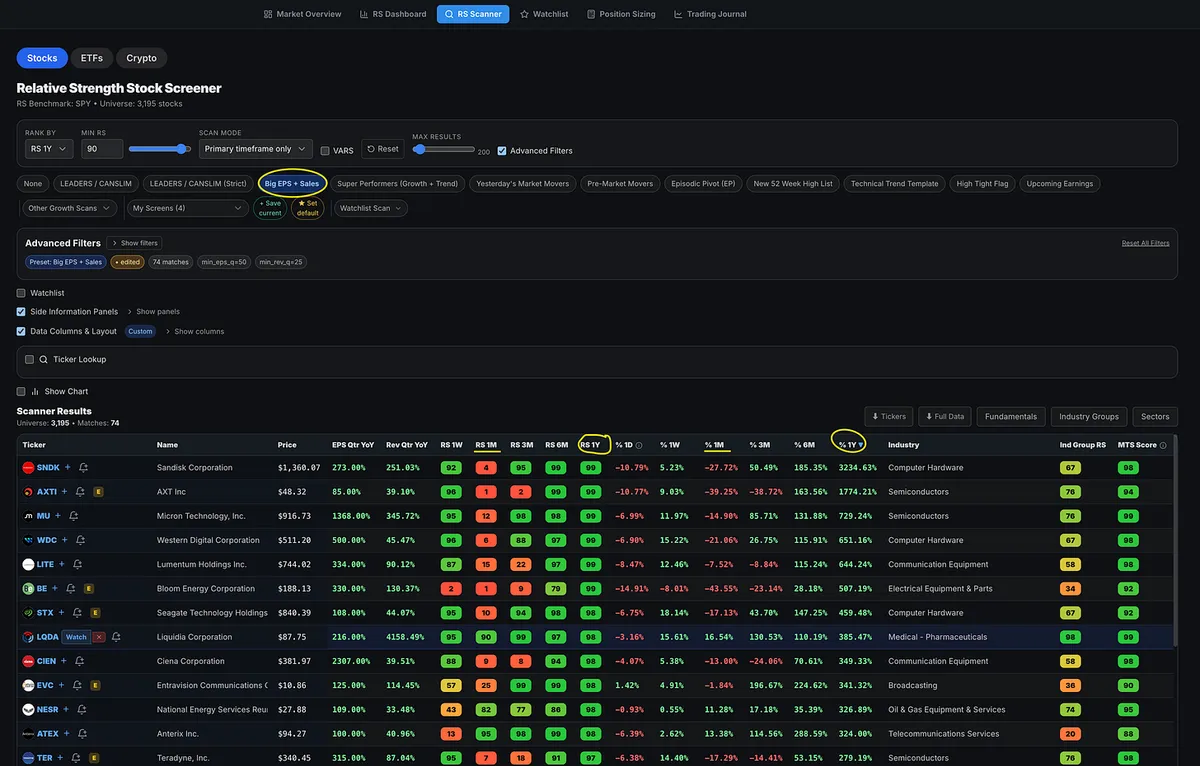
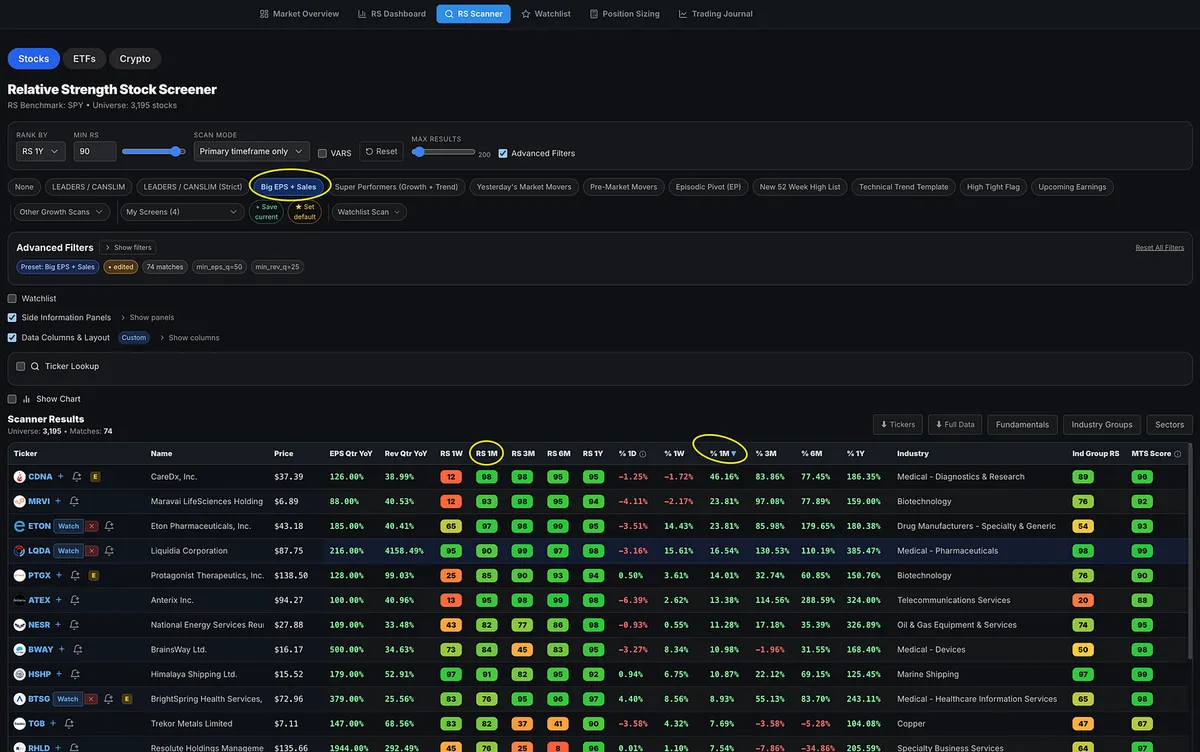
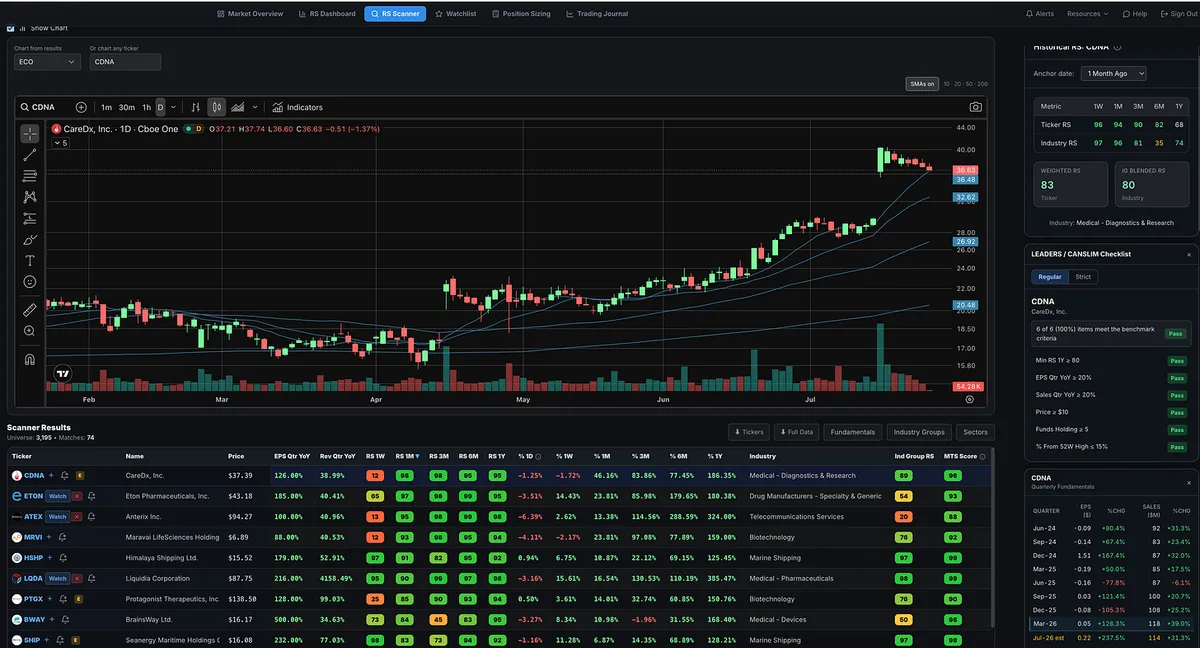
One of my favorite scans, and one I ran for years in MarketSurge, is the Big EPS and Sales screen. I now run the same scan inside the Momentum Trading Strategy software.

When you sort the results by one-year relative strength, the familiar leaders dominate: SNDK, MU, LITE, WDC, WTX, TER, etc.

The strongest groups are also the ones we have become accustomed to seeing: semiconductors, computer hardware, telecom, and communications equipment.

But sort the exact same screen by one-month relative strength, and the picture completely changes.

Now you see medical, biotechnology, pharmaceutical, oil and gas, and marine shipping names moving toward the top.

This shift was visible in the individual stock screens weeks ago.

When the indexes, sectors, industry groups, and individual stock screens all begin telling the same story, you are no longer guessing whether leadership is changing.

You are watching it happen in real time.

View on Substack ↗

The Setup I Almost Can’t Resist

When I see a stock make a powerful move higher and then pull back quietly on declining volume, I almost can’t resist taking the trade.

The initial move shows strong demand. The low-volume pullback suggests the sellers are drying up.

I do not need every trade to work.

No setup works every time.

But when a powerful move is followed by a quiet, low-volume pullback, that is the type of pattern I want to bet on repeatedly. The potential reward can far outweigh the clearly defined risk.

View on Substack ↗

BTSG Looks Good, but Earnings Are Close

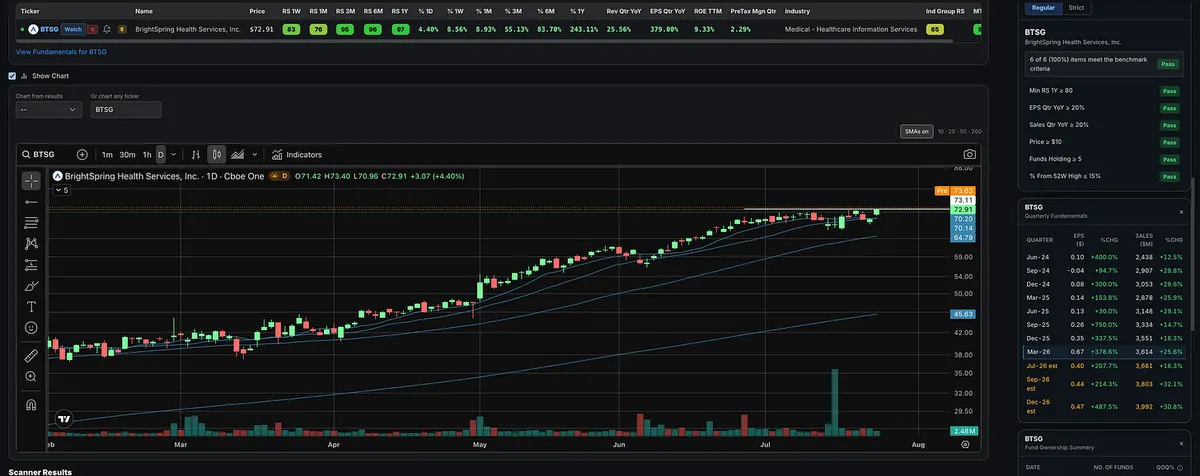
BTSG is another name that has been consistently showing up on my screens. It was appearing last fall as well and continues to display strong relative strength, accelerating earnings, double-digit sales growth, and tightening price action near its highs.

But earnings are only a few days away, which adds significant gap risk.

View on Substack ↗

Not Every Pharma Stock Is Just a Story

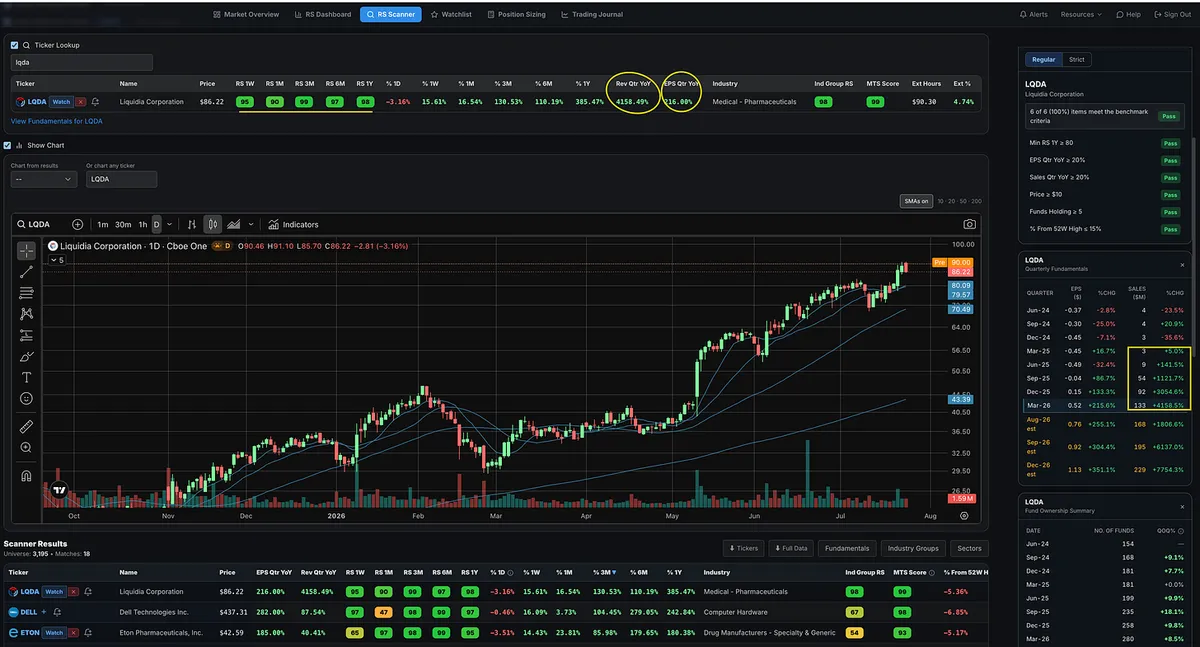
LQDA is a healthcare name that has consistently appeared on my screener over the past several months.

What separates it from many speculative biotech and pharmaceutical stocks is that it has the actual earnings and sales growth behind the move.

The fundamentals have been supported by strong price action. LQDA recently reached another all-time high and has been one of the market’s strongest-performing stocks this year.

Now it is gapping up almost 5% in pre-market trading.

View on Substack ↗

The Market Changed on June 5. Your Relative Strength Lookback Should Too.

Most platforms only let you measure relative strength using default timeframes like three months, six months, or one year.

But the market does not change character according to those defaults.

That is why I added custom relative strength lookback periods to the MTS Trading Software Relative Strength Dashboard and Stock Scanner.

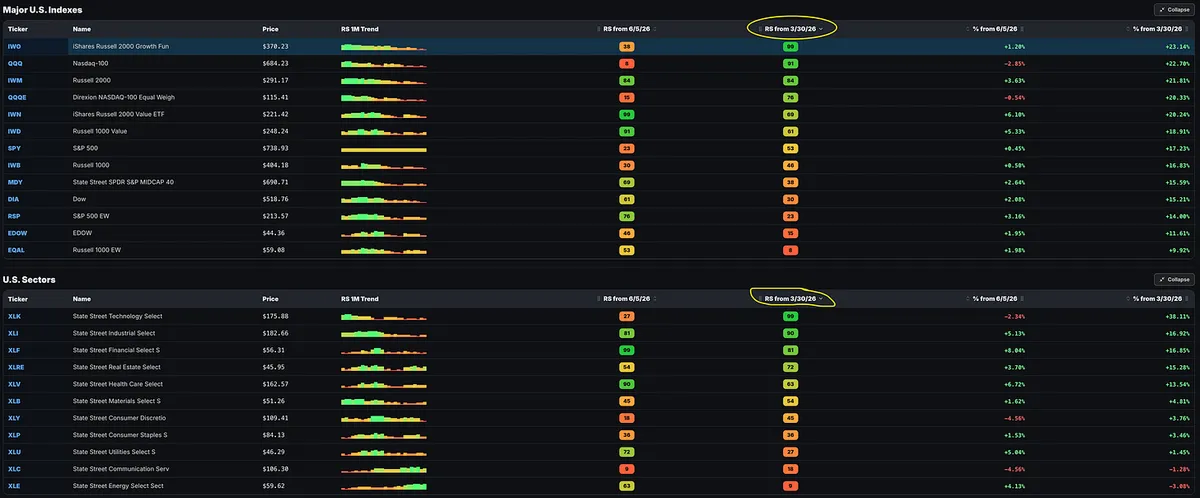
For example, the current uptrend began near the March 30 lows. From that point, leadership was dominated by growth, technology, semiconductors, software, and AI-related names.

But the market changed on June 5, when the Nasdaq gapped down and fell roughly 4%.

When we measure relative strength from that exact date, we see a completely different market.

Russell 2000 Value, Russell 1000 Value, equal-weight indexes, and midcaps have moved to the top.

Financials, healthcare, and industrials have led at the sector level.

Pharmaceuticals, insurance, biotech, banks, oil and gas, and real estate have led among industry groups.

The old leaders can still appear strong over longer default timeframes because of gains made earlier in the advance.

Custom lookbacks let you answer a more important question:

What has been leading since the market actually changed?

View on Substack ↗

The Market Is Warning You. Are You Still Scanning Like Nothing Changed?

Before you start screening for individual stocks this weekend, answer a few questions.

  • Is the market getting stronger or weaker?

  • Is participation expanding or shrinking?

  • Are growth stocks breaking out and following through, or are more setups failing?

  • Is institutional buying increasing, or does distribution remain elevated?

Because the evidence weakened again this week.

Distribution remains elevated on the Nasdaq.

Breadth has now deteriorated for three consecutive weeks.

Up/down volume continues to weaken week over week.

For the first time during this pullback, Nasdaq 52-week lows outpaced 52-week highs on a weekly basis.

The major indexes are below their short-term and intermediate-term moving averages.

Most importantly for growth traders, individual growth stocks continue to struggle.

You can have the best screener in the world.

But none of that changes the environment in which you are placing the trade.

Professional traders from all timeframes study the big picture before deciding how aggressively to trade.

So why would you begin building your watchlist before understanding whether the market is telling you to press the gas or hit the brakes?

Recognize when the odds have shifted before your account forces you to recognize it.

I broke down the full evidence, the areas of relative strength, and what needs to happen before growth traders should become aggressive again in this week’s Big Picture Market Pulse.

Read the full article here:

https://tradingmomentum.substack.com/p/the-market-is-warning-you-again-dont

Zoom out before you zoom in.

On SubstackBig Picture Market Pulse | July 26, 2026: The Market Is Warning You Again. Don’t Ignore It.
View on Substack ↗

Why Great Traders Can Be Bullish and Bearish at the Same Time

One of the most confusing yet surprisingly simple concepts for new traders is hearing one person say they are buying the S&P 500 while another says they are shorting it.

Even more confusing?

Sometimes the same trader is doing both.

No, they are not necessarily hedging.

They are trading different timeframes.

A long-term investor or position trader may believe the S&P 500 remains in a cyclical or secular bull market and continue adding to long-term investments.

At the exact same time, that trader may short the market as a swing trade because a correction is unfolding over the next few days or weeks.

Just look at the chart of any long-term bull market. You will find several meaningful corrections along the way.

Both trades can be profitable because they are answering two completely different questions.

Long-term: Where is the market likely headed over the next 6 to 24 months?

Short-term: What is the highest-probability move over the next few days or weeks?

These are not contradictions.

They are simply different lenses.

Even among investors, timeframes can vary dramatically.

One investor may be buying during a cyclical bear market because they believe the secular bull market remains intact and their outlook is 10 to 20 years.

Another investor may be selling the exact same market because their timeframe is only three to five years.

Both decisions can make sense.

The same is true even among swing traders.

One trader may be long based on a setup expected to play out over the next four to six weeks, while another is shorting a pullback expected to last only three to five days.

Both can be right.

Both can make money.

This is where beginners often get lost.

They hear opinions from investors, position traders, swing traders, and day traders and assume everyone is talking about the same move.

They are not.

Before accepting or rejecting anyone’s market opinion, ask one simple question:

“What timeframe are they talking about?”

Once you understand that, many of the apparent contradictions in the market disappear.

The market can be bullish on one timeframe and bearish on another.

Great traders understand the difference.

View on Substack ↗

You Do Not Have to Become a Market Wizard

The human mind is constantly searching for an excuse.

It wants the easy path. It will give you every reason why you cannot achieve superperformance in the market.

You do not have enough time.

You did not start early enough.

You are not smart enough.

The odds are too low.

But your mind rarely wants to confront the more uncomfortable possibility:

If other ordinary people learned how to do this, maybe you can too.

That does not mean it will be easy.

It will require sacrifice. It will take years of study, hard work, screen time, mistakes, review, and persistence.

But here is what I think many traders completely underestimate:

You do not need to become a legendary Market Wizard to dramatically change your life.

You may never produce the returns of Mark Minervini, William O’Neil, or the traders featured in the Market Wizards books.

That does not mean you cannot beat the market.

It does not mean you cannot make hundreds of thousands, or even millions of dollars, over a lifetime of disciplined trading and investing.

Saying there is no point in trading unless you become a Market Wizard is like saying there is no point in starting a business unless it becomes Facebook, Amazon, or Apple.

That is obviously ridiculous.

There are millions of successful business owners and millionaires whose names you will never know.

They did not build the next Amazon.

They simply built something profitable, stayed consistent, and created financial freedom for themselves and their families.

Trading is no different.

There are thousands of traders who studied the legendary traders I write about, adopted their principles, and made life-changing money.

Most of them will never appear in a book.

They will never be interviewed on television.

They will never become famous.

But they still won.

Your biggest obstacle may not be the market.

It may be your false perception of what is possible.

Limiting beliefs protect you from the discomfort of trying. If you convince yourself success is impossible, you never have to risk failing.

But you also guarantee that you will never discover what you were capable of becoming.

You do not have to become one of the greatest traders in history.

You only have to become far better than you are today.

That alone may be enough to change your life.

View on Substack ↗

Mark Minervini’s Brutally Honest Formula for Success

think this is one of the best pieces of advice Minervini has ever shared because it addresses the biggest obstacle most traders face: their ego.

Yes, Minervini built on William O’Neil’s foundation, and many of the core principles are very similar. But this mindset advice stands on its own:

“I think it’s time to repeat my personal formula for success;

  1. Admit you suck.

  2. Believe you can be great.

  3. Find someone great.

  4. Shut up and listen.” -Mark Minervini

There is a lot of wisdom packed into those four lines.

1. Admit you suck. Not because you’re incapable, but because honest self-assessment is where improvement begins. If you think you already know enough, you’ve stopped learning.

2. Believe you can be great. Humility without confidence leads to quitting. Confidence without humility leads to arrogance. You need both.

3. Find someone great. Success leaves clues. There is no reason to reinvent what already works. O’Neil learned from earlier market operators. Minervini learned from O’Neil. David Ryan learned from O’Neil. The greatest traders almost always stand on someone else’s shoulders before developing their own style.

4. Shut up and listen. This is the step many people skip. They want to debate every rule, modify every technique, and create their own system before they’ve ever mastered one that has already been proven.

The irony is that the traders who eventually develop unique approaches are often the very ones who first spent years following someone else’s proven methodology with discipline. They earned the right to innovate because they first learned what actually works.

That lesson is as valuable today as it was when O’Neil first started teaching CAN SLIM.

View on Substack ↗

The Moment You Think You’re Great, You’re in Trouble

“Don’t be a hero. Don’t have an ego. Always question yourself and your ability. The second you think you’re very good, you’re dead.”

- Paul Tudor Jones

One of the most dangerous moments in trading often comes after a string of wins.

Confidence quietly becomes ego, and it happens so subtly that you may not notice until it is too late. You lose respect for the market, stop listening to price, and begin loosening your rules because you believe you have become that good.

The market always finds a way to punish this. You may get away with it for a while, which only strengthens the ego and makes the eventual fall even worse.

But this is also what I love most about the market.

Eventually, if you survive long enough, you develop a healthy respect for it. You find the balance between having deep confidence in your system and enough humility to understand that anything can happen.

You can usually tell the difference between a newer trader who has not learned this lesson yet and an experienced trader who has.

The experienced trader may be confident.

But he never stops respecting the market.

View on Substack ↗

I Read the New Market Wizards Book Days After It Came Out. The Most Important Lesson Was That There Was Nothing New.

I read the newest Market Wizards book within a few days of its release.

I loved it, just like I loved the earlier books.

But honestly, I did not learn a single major lesson that I had not already learned from the older ones.

Does that mean reading it was a waste of time?

Not at all.

We do not stop working out once we get in shape. We keep training to maintain it.

We do not master a craft once and then walk away from it. We keep practicing, reviewing, and sharpening the same core skills.

Trading is no different.

Some books are not valuable because they introduce a brand-new idea. They are valuable because they reinforce the truths that matter most.

That is how I viewed the newest Market Wizards book.

The fact that it did not contain some revolutionary new secret was actually the biggest takeaway.

It showed, once again, that the most important market principles do not change. Risk management, discipline, patience, adaptability, emotional control, and protecting capital continue to be passed down from one generation of great traders to the next.

Many of today’s Market Wizards grew up reading the original Market Wizards books themselves.

Now they are repeating many of the same lessons in their own words, through their own experiences.

That is not a weakness.

That is confirmation.

The market changes. The participants change. The technology changes.

But the core truths of successful trading remain remarkably consistent.

Sometimes the most important thing a new book can teach you is that the old lessons are still the right ones.

View on Substack ↗

Not Every Note Is Written for You

One thing to keep in mind as you follow my Notes:

Not every Note is meant for every trader.

There is a wide range of experience here. Some people are opening their first chart. Others have been trading for years. Naturally, some Notes will cover beginner concepts, while others will be geared toward traders with more experience.

If a Note feels too simple, it probably wasn't written for where you are today. Just skip it.

If a Note feels over your head, that's okay too. Save it and come back to it later. As your knowledge grows, it may make much more sense the second time around.

The foundation of what I teach is in the MTS Course and the books I've shared over the years. Those are structured resources designed to build your understanding from the ground up.

My Notes are different.

They're simply scattered thoughts, observations, reminders, market lessons, and ideas that cross my mind throughout the day. Some may provide something valuable to you. Others may not.

That's all they are.

So don't take every Note so personally. Not every Note is written for you, and that's okay.

View on Substack ↗

The Market Doesn’t Care About Your Favorite Indicator

One of the biggest mistakes I see traders make is becoming overly bullish or bearish based on a single market indicator.

The truth is, no indicator deserves that much authority.

That is why, in the Big Picture Market Pulse, I don’t rely on one statistic. I look at dozens of market indicators, but I let the weight of the evidence tell the story.

For example, the Advance/Decline Ratio can be below 1.0, yet growth stocks can still be producing excellent opportunities. William O’Neil pointed out that a market advance can be led by a relatively small group of exceptional stocks. As growth investors, we don’t need every stock to participate. We need the right stocks to participate.

The opposite can also be true.

Recently, Net New Highs have remained positive, but many growth stocks have struggled. Why? Because much of those new highs have come from areas outside of traditional growth leadership. Looking at Net New Highs alone could have led you to believe conditions were healthier for growth stocks than they actually were.

The same applies to the percentage of stocks above their key moving averages. The market can have healthy participation on a broad basis while leadership rotates away from the areas you actually trade.

This is why I never interpret any market indicator in isolation.

Instead, I constantly compare them against one another and, more importantly, against the actual price action.

At the end of the day, the major indexes and the behavior of the leading stocks carry more weight than any individual breadth statistic. If the leaders are breaking out, acting well, respecting support, and producing follow-through, that matters far more than whether one indicator is flashing green or red.

Indicators provide context.

Price action provides the verdict.

That philosophy isn’t unique to me. It’s the same evidence-based approach William O’Neil built into CAN SLIM and Investor’s Business Daily: use multiple pieces of evidence, but let the market itself have the final say.