Momentum Trading Strategy

Notes

Short lessons on momentum trading, every day.

Every note from Substack, in one place: risk, setups, leading stocks, market conditions and the mindset behind them. Search them, browse by topic, or filter by stock.

Showing 421–440 of 1223 notes

View on Substack ↗

Do You Actually Want to Be a Trader?

A lot of people say they want to become traders.

But when you watch how they spend their time, what they enjoy studying, and what naturally holds their attention, many of them seem far more interested in being analysts.

Those are not the same job.

Traders still need to perform analysis. If you trade momentum growth stocks, you need to understand the market environment, price and volume, relative strength, earnings and sales growth, industry leadership, risk, and the quality of the setup.

But the analysis is only there to support the trade.

At some point, the trader must make a decision, accept risk, execute, manage the position, and respond when the market does something unexpected.

A great analyst does not automatically become a great trader.

Read enough of the Market Wizards books and you will see this repeatedly. Someone can understand a company, industry, or market better than almost anyone and still struggle to turn that knowledge into profitable trades.

Meanwhile, a great trader may occasionally look like a terrible analyst.

They can buy something and quickly sell it when the price action changes. They can sound bullish today and cautious tomorrow. They are not trying to defend a prediction or prove how intelligent their original thesis was.

They are trying to make money while controlling risk.

I am not saying this to scare anyone away from trading. I am simply saying that you should step back and ask yourself what you actually want to be.

Some people are pursuing trading primarily because of the money, but their behavior shows that what they truly enjoy is researching, forecasting, studying companies, and explaining the market.

There is nothing wrong with that.

You may be better suited to becoming an analyst, writing a newsletter, building a research service, or sharing your ideas through a platform like Substack.

This is where “know thyself” becomes so important.

For anyone following Momentum Trading Strategy, I want to be clear about what I am.

I am a trader at heart.

You should not follow me because you believe I am the greatest market analyst. There are people who are much better at producing detailed economic forecasts, company research, and deep fundamental analysis.

The Big Picture Market Pulse simply shows you how I evaluate the market as a trader. It is similar to how William O’Neil and Mark Minervini incorporate the market into their trading process through the “M” in CANSLIM.

My software is also an extension of how I trade.

It takes much of what I was already doing through MarketSurge and TradingView and combines it with the features, organization, ratings, risk tools, and workflow I always wished I had.

The software supports the system.

The Momentum Trading Strategy course teaches the system.

The market analysis helps guide you through the environment in which that system is being applied.

Over time, because I love the markets, I have gone deeper into certain areas of market analysis. I have learned from traders and authors such as Martin Zweig and incorporated some of those ideas into the way I view the bigger picture.

But at the end of the day, I am still a trader.

I was a trader before Substack.

And whenever I eventually get tired of posting on Substack, I will still be trading.

That is what brings me joy.

That is what I am good at.

That is what I genuinely want to do.

A lot of people are trying desperately to become traders when, deep down, they may simply love being analysts.

There is nothing wrong with either path.

Just make sure you are pursuing the one that actually fits you.
View on Substack ↗

You Cannot Predict the Winner. You Can Control the Risk.

I screen for stocks with the same characteristics shared by many of the biggest winners in market history.

Strong relative strength. Accelerating sales. Triple-digit earnings growth. High ROE and margins. Leading industry groups. The CANSLIM characteristics and many of the traits I teach throughout Modules 4 and 5 of the Momentum Trading Strategy Course.

All of that improves the probabilities.

But even then, I never truly know which stock will become the big winner.

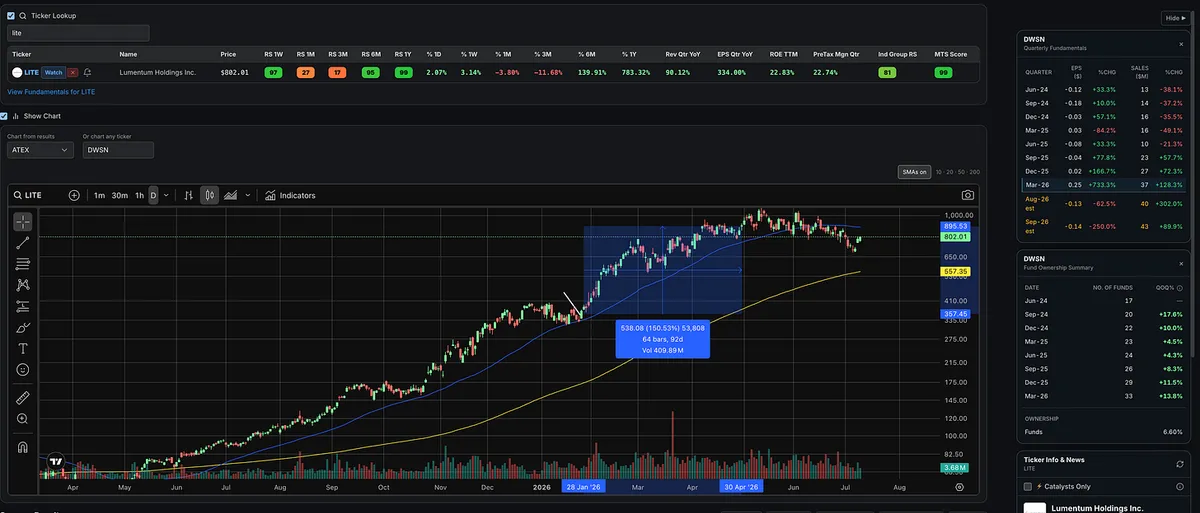
There are plenty of names I expect to work that quickly stop me out. Then there are trades like LITE.

I bought LITE in late January as it found support around the 50-day moving average. It had a 99 RS Rating, accelerating sales, improving triple-digit earnings, strong ROE and pre-tax margins, and belonged to a strong industry group.

I did not know the company well. I did not fully understand the story. I did not even know NVIDIA was a major investor until that news surfaced later.

I was simply following my system.

LITE became a much larger winner than I could have predicted. But there were several other stocks with similar characteristics where I entered, took a small loss, and moved on.

That is trading.

Your criteria create an edge, but they do not create certainty.

The one thing you can control before entering is how much you are willing to risk.

I stay concentrated, cut losing positions, and add to positions that prove themselves. Once I have sold some into strength and raised my stop toward breakeven, I become more adaptable.

Sometimes a trade I expect to hold for a few days becomes a multi-month winner.

Sometimes a stock I expect to hold as a position trade stops acting right, and I exit quickly.

You do not decide which stock becomes the monster winner.

The stock and the market decide.

Your job is to control the risk, follow your system, and stay with the winners that prove themselves.

View on Substack ↗

The Answer: Stock C

Obviously, this one was too easy. You all got it.

This is something Dr. Van Tharp really drives home throughout his work: stop thinking only in percentages and start thinking in terms of R, or the amount you are risking on the trade.

A lot of traders look only at the potential gain.

“How much can I make?”

But the better question is:

“How much am I risking to make it?”

Here is the breakdown:

  • Stock A: Risk 10% to make 30% = 3R

  • Stock B: Risk 8% to make 20% = 2.5R

  • Stock C: Risk 6% to make 24% = 4R

  • Stock D: Risk 3% to make 6% = 2R

  • Stock E: Risk 20% to make 50% = 2.5R

Even though Stock E had the biggest potential gain, Stock C offered the best return relative to the amount being risked.

That is the difference between chasing the biggest number and evaluating the quality of the trade.

William O’Neil, Mark Minervini, David Ryan, and Dan Zanger all built their approaches around buying correctly, defining risk, and keeping losses under control.

There is also another reason Stock C stands out.

Suppose your rule is to risk no more than 1% of your portfolio on any trade.

With a 20% stop, you can only take about a 5% position.

With a 10% stop, you can take about a 10% position.

With a 6% stop, you can take roughly a 16.7% position.

So a tight, logical stop does more than reduce the damage when you are wrong.

It allows you to take a more meaningful position while keeping total portfolio risk exactly the same.

That is why proper entries matter so much.

The goal is not simply to find the stock with the biggest possible upside.

The goal is to find the highest-quality setup with the best reward relative to the amount you must risk.

Amateurs focus on how much they can make.

Professionals focus on how much they can lose.

And they express that relationship in R.

Quoting Momentum Trading StrategyWhich Trade Would You Take? Assume all five stocks are equally high-quality setups and each has met your buy criteria. Which trade would you take? Stock A Risking 10% Potential Gain: 30% Stock B Risking 8% Potential Gain: 20% Stock C Risking 6% Potential Gain: 24% Stock D Risking 3% Potential Gain: 6% Stock E Riskin…
View on Substack ↗

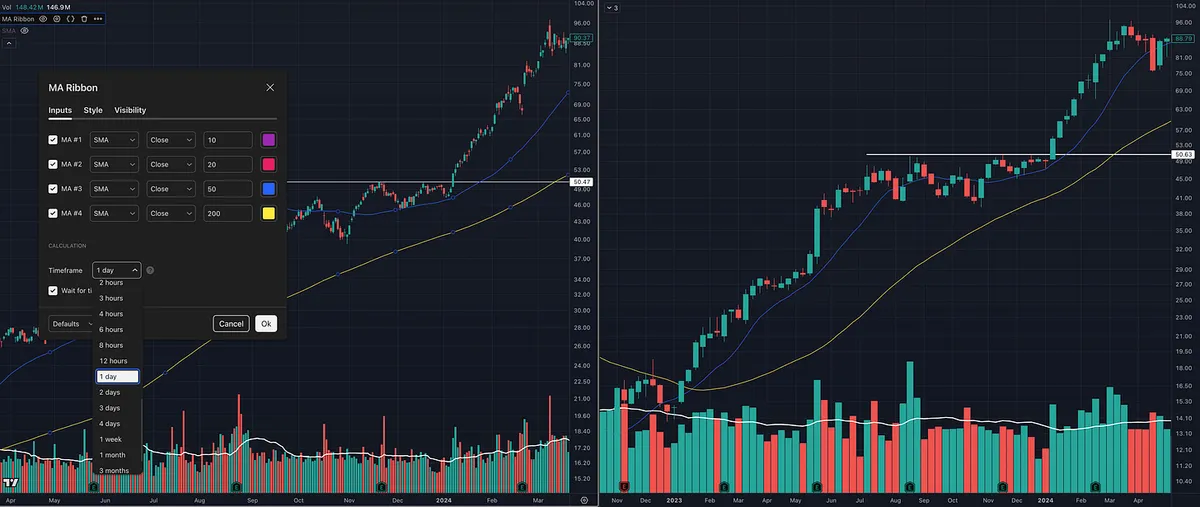
A Simple TradingView Tip for Using Daily and Weekly Charts

Change your moving-average timeframe from Chart to 1 Day.

By default, moving averages follow the chart timeframe. On a daily chart, you will see the 50-day and 200-day moving averages. Switch to a weekly chart, and those same settings become the 50-week and 200-week moving averages.

Changing the timeframe to 1 Day keeps the 50-day and 200-day visible even when you move to the weekly chart.

This is useful because I believe swing and position traders should study both timeframes.

The weekly chart gives you the bigger picture. It helps you see the primary trend, the larger base, and whether the stock is moving through an important long-term area.

The daily chart gives you more detail. It helps you identify the setup, determine your risk, and manage the trade more precisely.

I generally use the weekly chart for context and the daily chart for execution and trade management.

You can even take it one step further.

When executing an entry intraday, keeping the moving-average timeframe set to 1 Day allows you to watch price approach an important daily level, such as the 50-day moving average, in real time.

The weekly chart shows you the forest.

The daily chart shows you the tree.

The intraday chart can help you time the entry.

View on Substack ↗

Your Stop Is Nonnegotiable. After That, the Stock and the Market Get a Vote.

Before I enter a trade, I build a plan.

My initial stop is nonnegotiable. I am 100% strict with it. I do not widen it, lower it, or give the stock more room because I suddenly feel hopeful.

At that point, my principal is still at risk and the stock has not proven itself.

But once the trade begins working, I sell some into strength and move my stop toward breakeven. From there, I still follow my plan, but I become more adaptable.

When I was in the military, we built detailed plans, but we always understood one thing:

The enemy gets a vote too.

Trading is no different.

The stock gets a vote.

Price action gets a vote.

The overall market gets a vote.

Be rigid with your initial risk.

Be adaptable once the trade has earned that flexibility.

View on Substack ↗

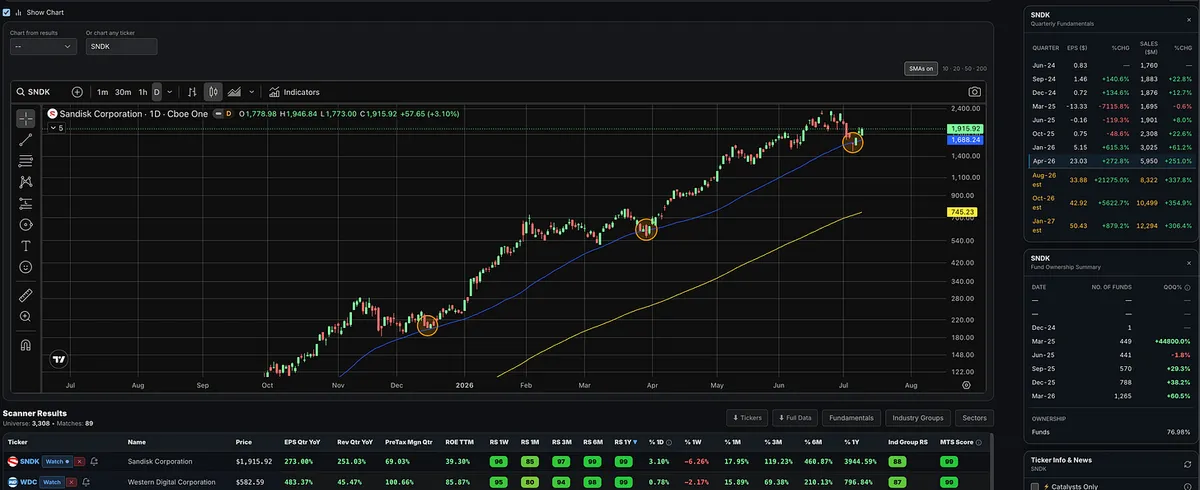
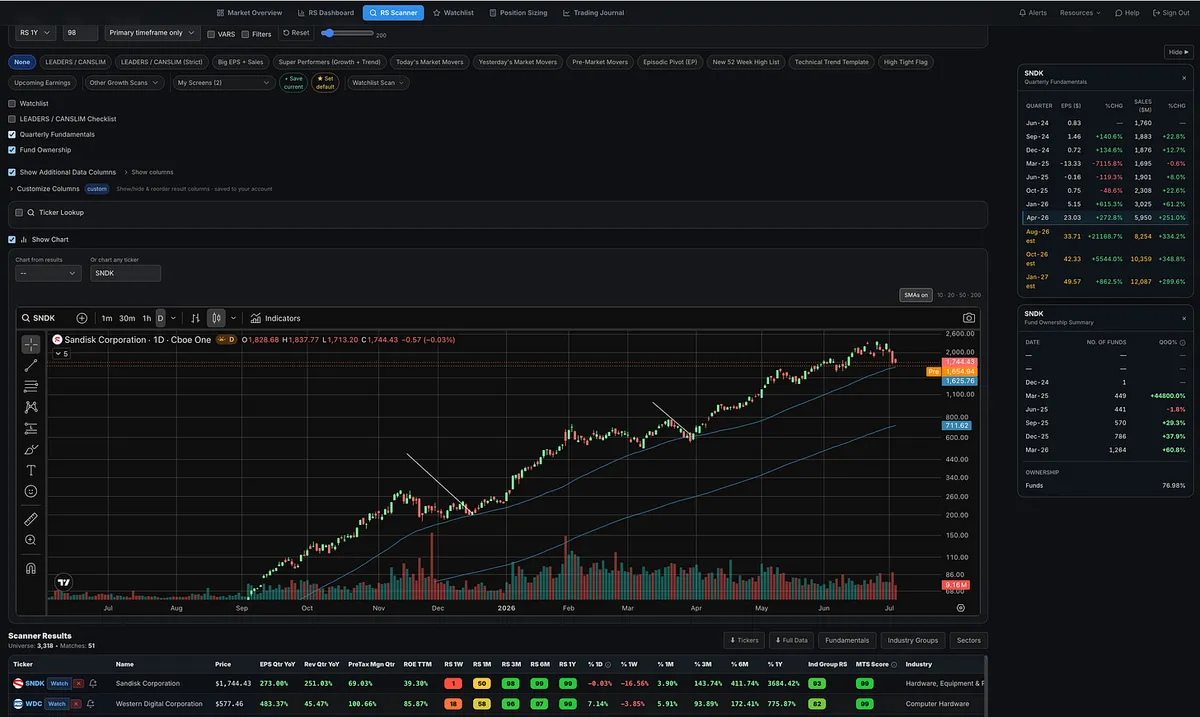
SNDK Loves the 50-Day

SNDK has repeatedly found support around the rising 50-day moving average throughout this massive run.

It happened in December 2025.

It happened again in late March as the market bottomed.

And now, SNDK has done it again, briefly undercutting the 50-day before reversing sharply and closing near the top of the day’s range.

We will see if the trend continues.

“The trend is your friend until the end when it bends.”

-Ed Seykota

View on Substack ↗

Which Trade Would You Take?

Assume all five stocks are equally high-quality setups and each has met your buy criteria.

Which trade would you take?

Stock A

  • Risking 10%

  • Potential Gain: 30%

Stock B

  • Risking 8%

  • Potential Gain: 20%

Stock C

  • Risking 6%

  • Potential Gain: 24%

Stock D

  • Risking 3%

  • Potential Gain: 6%

Stock E

  • Risking 20%

  • Potential Gain: 50%

👇 Comment A, B, C, D, or E.

I'll post the answer tomorrow.

View on Substack ↗

The Human Eye Still Wins

I get a lot of questions from people asking if there are indicators, AI tools, or software platforms that can automatically spot chart patterns and setups.

Bottom line:

I have yet to find anything good enough to replace the human eye.

And trust me, I would love if it existed.

If there were a tool that could accurately identify the best setups, VCPs, tight areas, proper pivots, and actionable patterns with consistency, I’d be one of the first people using it.

Then I could spend a little more time on the beach with my kids instead of reviewing charts.

But I have tried quite a few of them.

MarketSurge, TradingView, TrendSpider, and plenty of others all have some form of pattern recognition.

Some are useful for basic visual cues.

But none of them are good enough to fully rely on.

They miss too many great setups.

They flag too many bad ones.

And they still do not understand the most important part:

Context, supply, and demand.

A pattern is not just a shape.

Even when these tools spot the general structure, they still struggle to factor in everything that actually matters: volume price analysis, price tightening, volume drying up on the contraction, volume surging on the way up, and whether the stock is actually under accumulation.

Small differences matter.

That is what makes this so hard to quantify.

A good setup may not show up.

A bad setup may get flagged.

Trading is both art and science.

Maybe one day we will be replaced by some amazing software, but that time is not now.

The best traders are NOT still reviewing charts because they are dinosaurs who refuse to adapt to new technology. Some of the best traders are actually the most adaptable people in the market.

They still review charts because the software does not work well enough yet.

Period.

The best way to see supply and demand at work is still simple:

Look at price and volume.

Software can help narrow the list.

But the human eye still has to judge the setup.

View on Substack ↗

What’s More Important: The Stock or the Market?

Should you study the market...

Or should you study individual stocks?

You've probably heard both arguments.

"If the market is weak, don't fight it. Most stocks will go down."

True.

But you've also heard this:

"The leading stocks will often break down before the indexes do, and they'll often recover before the indexes confirm a new uptrend."

Also true.

So which one should you focus on?

Both!

Because this isn't an either/or decision.

Think about it.

The market indexes are nothing more than collections of individual stocks. If enough leading stocks begin breaking down, eventually the indexes will reflect it.

But the opposite is also true.

Even the strongest stock with outstanding fundamentals, accelerating earnings, and excellent price action will often struggle if the overall market and its industry group come under heavy selling pressure.

It's the trading version of the classic question:

What came first, the chicken or the egg?

There isn't a useful answer because they're connected.

That's exactly why William O'Neil included the M (Market Direction) in CAN SLIM.

  • Study the market.

  • Study the industry groups.

  • Study the leading stocks.

Each tells you something the others cannot.

The market tells you whether the tide is rising or falling.

The industry groups tell you where the money is moving.

The leading stocks tell you where institutions are placing their biggest bets.

And remember, while the indexes are made up of individual stocks, they don't always tell the whole story.

Sometimes a handful of mega-cap leaders can carry the indexes higher while most stocks quietly struggle. We saw exactly that during parts of 2023 with the Magnificent Seven.

Other times, the leading stocks that carried the market higher start breaking down before the indexes show real damage.

The surface can still look fine for a while.

But underneath, leadership is already changing.

That is often one of the first warnings that the market is weakening.

That's why serious traders don't just watch the indexes.

They watch what's happening beneath the surface too.

Because when you understand the market, the industry groups, and the individual stocks driving them, you see a much more complete picture.

You're seeing the market as it's actually unfolding.

There is no shortcut.

You have to study the market, the groups, and the stocks.

View on Substack ↗

What Is Relative Strength and Why Is It So Important?

Many new traders, or people unfamiliar with relative strength, confuse it with RSI.

They are completely different.

RSI is an oscillator. It moves between 0 and 100 and is often used by traders to identify overbought or oversold conditions.

Relative strength, popularized by William O’Neil and Investor’s Business Daily, is completely different.

It is not asking:

“Is this stock overbought?”

It is asking:

“Is this stock outperforming the market and outperforming almost everything else?”

That is a much more important question.

William O’Neil said it best:

“I rarely pay attention to overbought/oversold indicators.”

And many Market Wizards have expressed a similar idea in one way or another.

The strongest growth stocks can stay “overbought” for long periods of time.

That is often what they do when they are under real accumulation.

They get strong.

They stay strong.

They keep making new highs.

And while everyone else is worried that the stock is “overbought,” the real leaders keep leading.

So that is why we do NOT care about RSI.

That is why relative strength is so valuable.

A true RS Rating is not just telling you whether a stock is moving up.

It is telling you how that stock is performing compared to a benchmark index, usually the S&P 500, and then how it ranks against all the other stocks in the market.

A 99 RS Rating means the stock is beating the market and outperforming almost everything else. It is in the top 1%.

A 90 RS Rating means it is in the top 10%.

A 50 RS Rating means it is roughly middle of the pack.

A low RS Rating means the stock is lagging badly.

Remember, as growth stock investors and momentum traders, we are:

Not looking for cheap.

Not looking for oversold.

We are looking for leadership.

The biggest winning stocks usually show strong relative strength before and during their major advances.

A stock can have an RS Rating of 80, 90, or 99 and still move hundreds or even thousands of percent. SNDK had a 99 RS Rating at the start of the year and moved another 300%.

They hold up better during market pullbacks.

They recover faster.

They push toward new highs while weaker stocks are still stuck below resistance.

RSI does not tell you that.

Relative strength does.

Inside the Momentum Trading Strategy Software, I break relative strength down across multiple timeframes, including 1 week, 1 month, 3 months, 6 months, and 1 year.

We also have functionality to set a minimum RS level across all timeframes, see what is accelerating and getting stronger, and see what is decelerating and losing strength.

That way, you are not stuck looking at one blended number.

You can see whether a stock is showing short-term strength, intermediate-term leadership, long-term leadership, or all three.

The goal is:

Find the strongest stocks in the strongest areas of the market.

Relative strength helps you do that.

View on Substack ↗

The Biggest Lie in Trading Is That Someone Else Has the Secret.

Everyone understands this in almost every profession.

Want to become a great surgeon?

Study the best surgeons.

Want to become a great hitter in baseball?

Study great hitters and put in thousands of quality reps.

Nobody expects a secret shortcut.

Yet the moment people enter the stock market, they start searching for a hidden algorithm, black box system, or magic indicator.

Yes, temporary market inefficiencies have existed. Many disappeared as technology improved.

But that’s not what traders like William O’Neil or Mark Minervini built their careers on.

Their edge wasn’t secrecy.

It was mastering timeless principles rooted in human behavior, supply and demand, leadership, and disciplined risk management.

Those principles have worked for decades because people haven’t changed.

The biggest edge isn’t finding a secret.

It’s becoming exceptionally good at executing principles that most people never stick with long enough to master.

View on Substack ↗

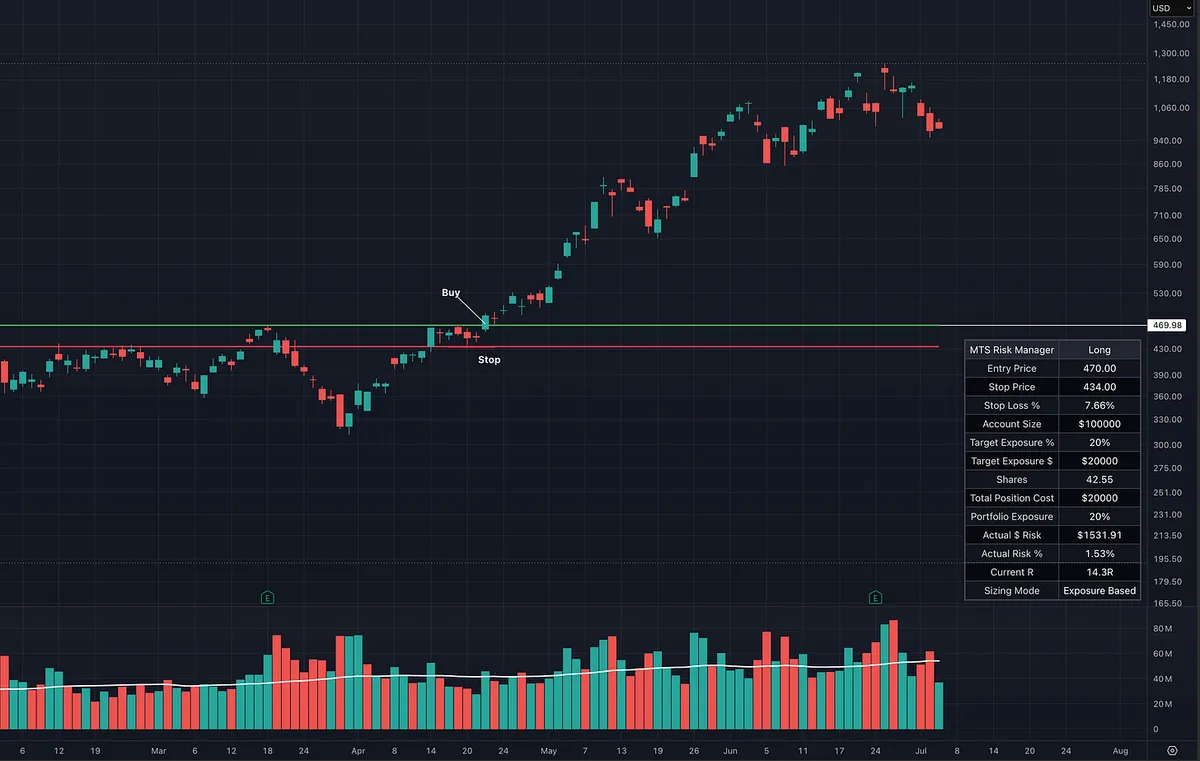
Position Size Like a Market Wizard

Using Bruce Kovner’s stop-loss principle to plan the trade before the trade begins.

“Whenever I enter a position, I have a predetermined stop. That is the only way I can sleep. I know where I’m getting out before I get in. The position size on a trade is determined by the stop, and the stop is determined on a technical basis.” - Bruce Kovner

Watch the video on Substack →
View on Substack ↗

The Great Investing Paradox: The Longer You Hold, the More You Have to Predict

I recently listened to the founder of Perplexity.

When asked what AI and the future will look like, he basically said, “It’s very hard to know.”

His point was simple.

If you went back just five years, even many of the smartest people in AI would not have predicted the exact state we are in today.

They would not have predicted the breakthroughs.

They would not have predicted the bottlenecks.

They would not have predicted the demand for compute, chips, power, and infrastructure.

Because if they had, they would have already secured the compute, bought the chips, locked up the power, and built the capacity years ago.

But they didn’t.

Everything is reactive to the demand we are seeing today.

And that is just five years.

That got me thinking.

If some of the smartest people in the world cannot reliably predict where AI will be in five years, why do so many investors believe it is easy to predict which individual companies will dominate over the next 5, 10 or 20 years?

This is one of the reasons I have always preferred swing and position trading.

Not because I am trying to predict the future.

Because I am trying not to.

I am not trying to forecast what a company will look like a decade from now.

I am looking at what institutions are doing today.

  • Is the stock under accumulation?

  • Is relative strength improving?

  • Are earnings and sales accelerating?

  • Is price confirming the story?

If the answer is yes, I participate.

If demand disappears, I leave.

The market tells me when I am right, and it tells me when I am wrong.

I do not need to predict the future.

I need to manage risk and follow the evidence.

Ironically, many people think trading is harder than investing.

I think they are confusing psychology with prediction.

Trading is emotionally harder because you have to admit when you are wrong, cut losses, and follow rules with discipline.

But long-term investing in individual companies often requires making far bigger assumptions about a future that nobody can truly know.

For me, the sweet spot has always been swing and position trading.

Long enough to capture meaningful trends.

Short enough that I am not pretending I know what the world will look like 10 years from now.

I do not get paid for predicting the future.

I get paid for aligning myself with the market while the evidence is there and leaving when it isn’t.

View on Substack ↗

America Is Still the Trade

O’Neil’s entire investing philosophy was built around the idea that America’s greatest stock market winners came from innovation, entrepreneurship, new industries, new products, and people willing to take risk.

He believed that for decades.

Warren Buffett has consistently believed it too.

And that is what I think is so important.

You are talking about two completely different types of investors.

O’Neil was a growth stock investor who studied America’s biggest winning stocks, new industries, new products, institutional demand, earnings growth, relative strength, and price action.

Buffett is a value investor who built his career around buying great businesses and holding them for the long term.

Different styles.

Different systems.

But both men understood the same bigger truth:

America still produces opportunity.

And I believe they were both right.

That belief in American business, American innovation, and American entrepreneurship still matters today.

From railroads to autos, from airplanes to computers, from semiconductors to the internet, and now into AI, robotics, software, energy, medical technology, and whatever comes next, America has continued to create massive opportunities for investors and entrepreneurs.

That does not mean America has no problems.

Of course it has problems.

Debt is a problem. Taxes are a problem. Political dysfunction is a problem. Inflation, regulation, division, and constant fear are all real issues.

But as traders and investors, we cannot let politics, emotion, or personal beliefs get in the way of making money.

I am looking at this the same way I look at stocks.

  • Where is the leadership?

  • Where is the relative strength?

  • Where is the innovation?

  • Where are the biggest winners still being created?

For those of you reading this outside the United States, this is not a political statement or some “America is better than everyone else” speech.

This is about capital allocation.

If I lived in another country, I would still want my capital invested wherever I believed the best risk/reward opportunity existed. If another market became the best place to invest, I would invest there too.

But for now, the long-term trend is still clear.

America is still the place where many of the world’s biggest companies, biggest innovations, and biggest wealth-building opportunities are being created.

This is the same lesson I teach with individual stocks.

Follow the trend.

Do not argue with the market.

Do not let your opinions get in the way of what is actually happening.

“The trend is your friend until it ends when it bends.”

- Ed Seykota

And right now, betting against American innovation, American business, and American entrepreneurship still looks like a lower-probability bet to me.

The American dream may look different than it used to.

It may be harder for some people than it should be.

But American opportunity is still alive.

The question is whether you are going to complain about the problems or position yourself to benefit from the opportunities that still exist.

View on Substack ↗

No One Is Coming to Save You. Learn to Invest.

William O’Neil wrote in How to Make Money in Stocks:

“Today it’s not enough for you to just work and earn a salary. To do the things you want to do, go where you want to go, and have the things you want to have in your life, you must save and invest intelligently. The income from your investments and net gains you can make will, in time, let you reach your goals and provide you real security.”

I believe that is still 100% true today.

Through all the negativity, the media, politics, debt, taxes, wars, inflation, and constant fear being pushed at people every day, one thing has not changed.

It is still up to you.

You can complain about the system, or you can learn how to use the opportunities that still exist inside it.

Yes, people are being left behind. Yes, there is a growing debt problem. Yes, it feels like politicians on both sides of the aisle are not making a huge difference in the average person’s life.

And yes, no matter who is in office, you are probably still going to be taxed an outrageous amount, with very little of that money feeling like it actually comes back to improve your life.

But that does not change the responsibility you have over your own life.

  • You still have to learn.

  • You still have to save.

  • You still have to invest.

  • You still have to build skills.

  • You still have to take personal responsibility.

  • You still have to stop waiting for someone else to fix your life.

That is one of the biggest lessons in O’Neil’s work. He was not just teaching people how to buy stocks. He was teaching people that they had to take control of their financial future.

Working hard matters, but working hard alone is usually not enough. At some point, you have to learn how money works. You have to learn how markets work. You have to learn how great companies grow. You have to learn how to put capital to work intelligently.

That does not mean you need to become a professional trader. It does not mean you need to take reckless risk. It means you need to understand that saving, investing, and building wealth are skills.

And like any skill, they can be learned.

  • So learn to trade.

  • Learn to invest.

  • Start a business.

  • Build a skill.

  • Invest in yourself.

But do not sit around waiting for the perfect economy, the perfect government, the perfect policy, or the perfect time.

That will likely never come.

The opportunity is still here.

You just have to take responsibility and go after it.

View on Substack ↗

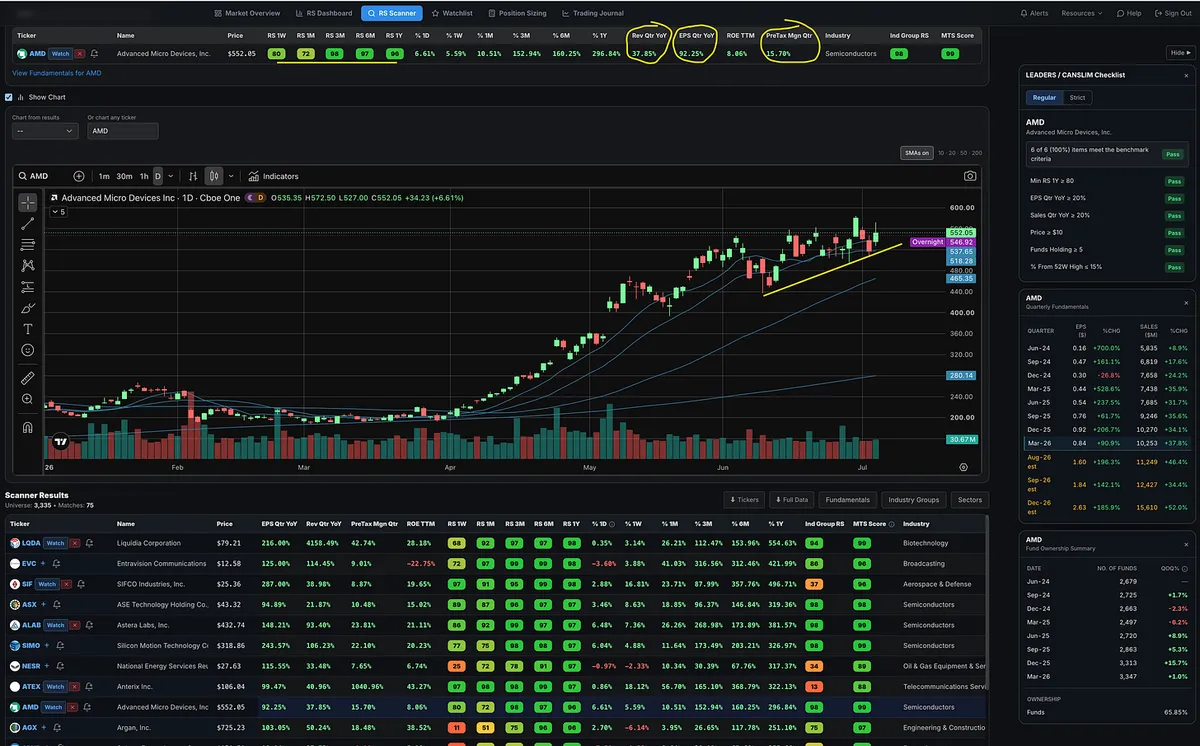
AMD Is Holding Up While Semis Cool Off

While semiconductors have been beaten down over the last few weeks, AMD has held up pretty well.

That is one of the first things I look for when a leading group starts to come under pressure. I want to find the names that are refusing to break down.

AMD is sitting near highs, consolidating in a fairly tight range, and continuing to build higher lows. Price has been finding support around the 10-day and 20-day moving averages, which tells me buyers are still showing up before the stock can pull back too deeply.

When a group gets hit and most names start falling apart, the stocks that hold up near highs are worth paying attention to. They are showing relative strength both within their industry group and against the Nasdaq and S&P.

AMD is still showing strong numbers. Earnings growth is strong, sales growth is strong, and the forward estimates look impressive. That combination of technical strength and fundamental strength is exactly what I want to see.

If the group recovers and the Nasdaq and S&P break out of this consolidating range, AMD could be primed for a nice move higher.

View on Substack ↗

The Market Wizard Rule Most Traders Ignore

One of the biggest lessons from Market Wizards is that great traders do not enter positions casually. They know where they are wrong before they ever get in. Bruce Kovner explained this perfectly when he said:

“Whenever I enter a position, I have a predetermined stop. That is the only way I can sleep. I know where I’m getting out before I get in. The position size on a trade is determined by the stop, and the stop is determined on a technical basis.”

- Bruce Kovner

View on Substack ↗

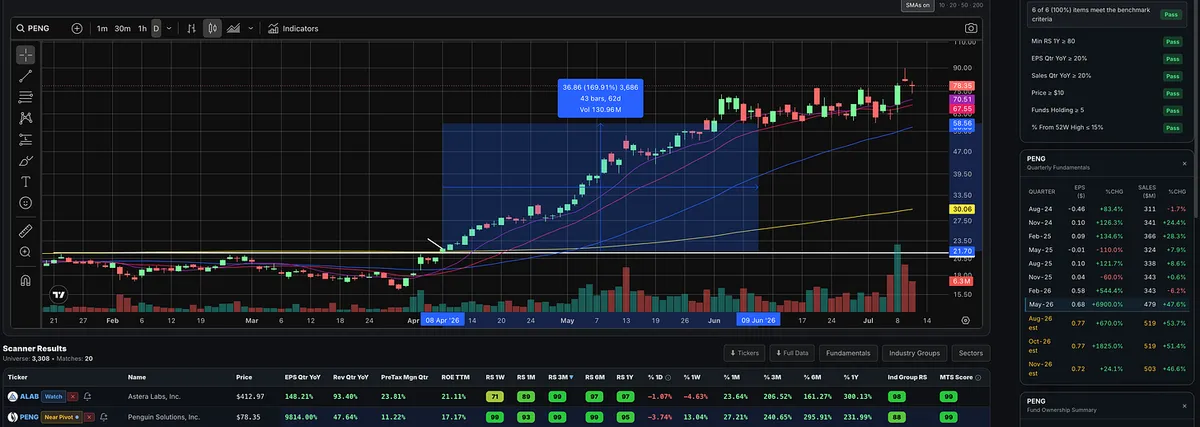
The Episodic Pivot (EP) Setup Most Traders Miss

I get a lot of questions about episodic pivots.

  • What are they?

  • How do you find them?

  • And more importantly, how do you make sure you do not forget about them?

An episodic pivot is a powerful price and volume move caused by a meaningful catalyst, usually earnings, guidance, FDA news, contract news, or some other event that forces the market to reprice the stock.

But here is what most traders miss.

The best setup does not always happen on the day of the big move.

Sometimes the stock gaps up, runs hard, pulls back, volume dries up, tightens, and then gives a much cleaner entry days, weeks, or even months later.

That is why tracking these names matters.

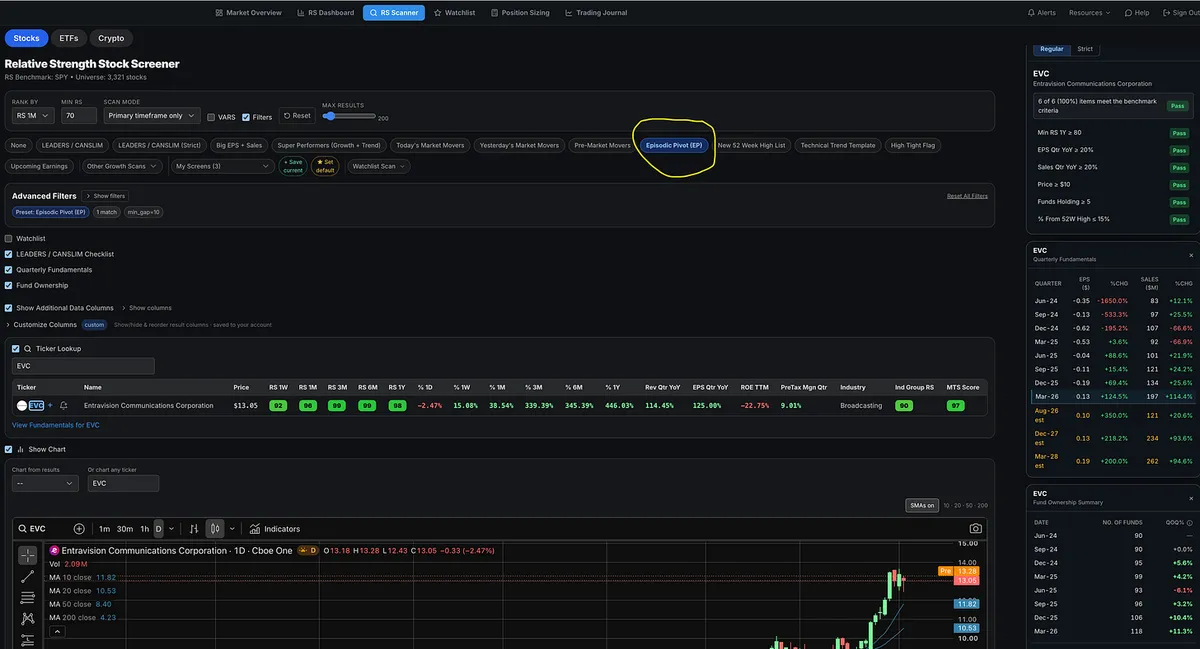
Inside the Momentum Trading Strategy software, we have an episodic pivot preset screen to help find these stocks.

But finding them is only step one.

The real edge is creating an Episodic Pivot watchlist inside the Relative Strength Stock Screener.

Under Manage Sub-Categories, create one called EPs.

Now you have your episodic pivots organized in one place.

Add the names when they show up.

Review them daily or weekly.

Do not force the trade.

Just wait.

Some will fail.

Some will go nowhere.

But some will tighten up and set up again.

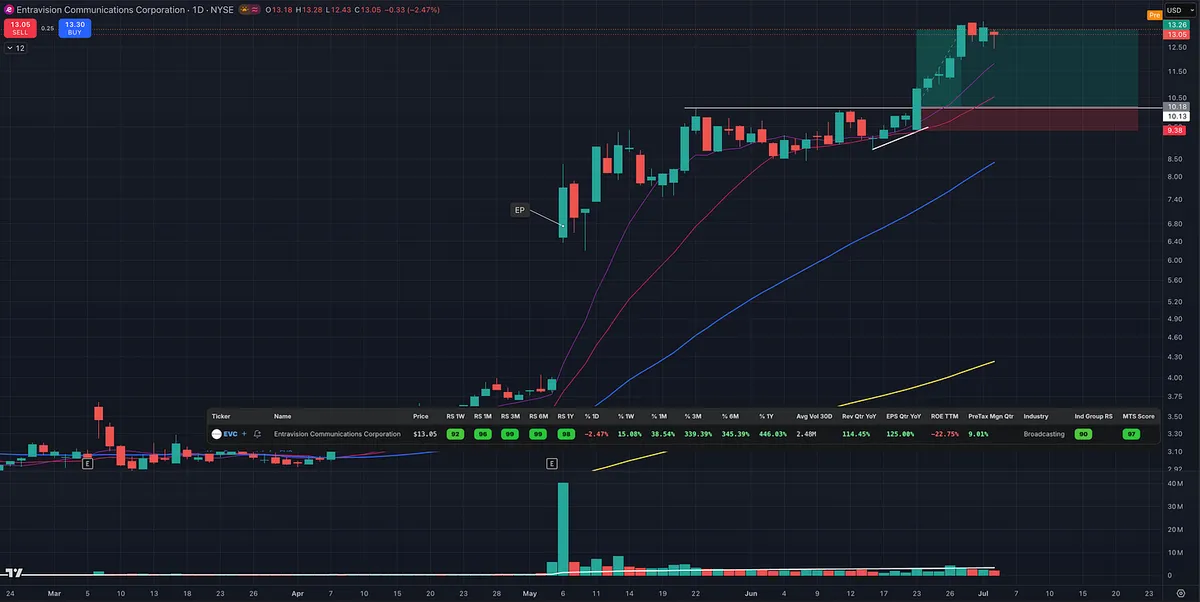
EVC is a good example.

The earnings catalyst launched the stock higher, but the cleaner opportunity came later after it consolidated, tightened up, and broke out again.

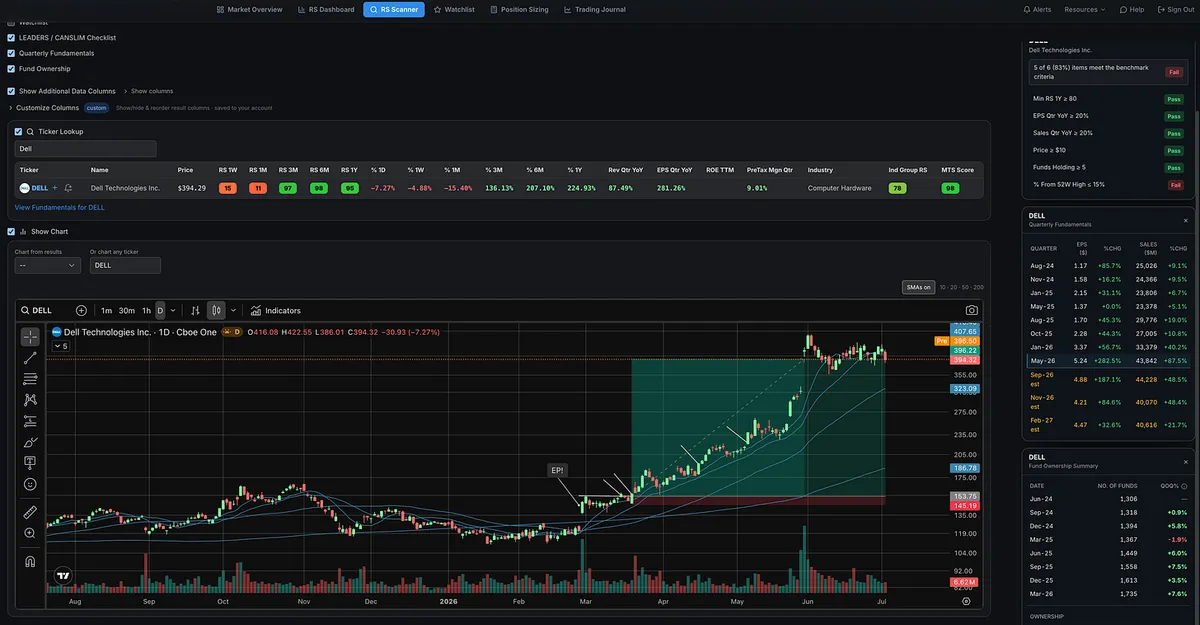
DELL was another great example.

The episodic pivot should gets your attention.

The watchlist keeps it on your radar.

The setup tells you when to act.