Momentum Trading Strategy

Notes

Short lessons on momentum trading, every day.

Every note from Substack, in one place: risk, setups, leading stocks, market conditions and the mindset behind them. Search them, browse by topic, or filter by stock.

Showing 21–30 of 30 notes

$MU ×
View on Substack ↗

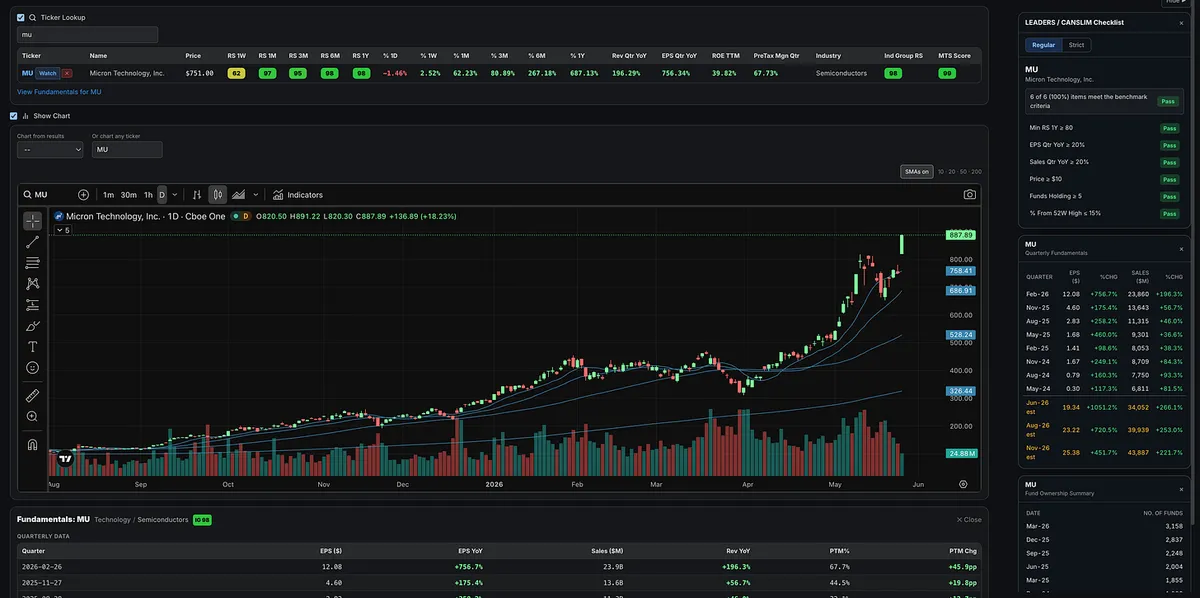
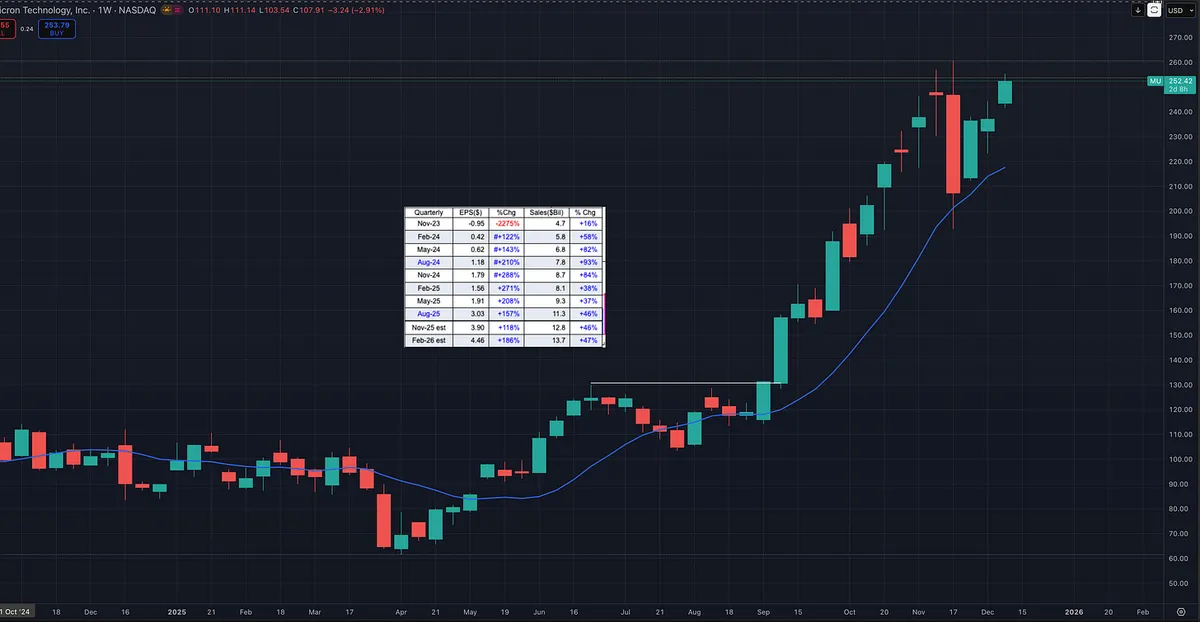
MU Breaks Out Again

I’ve been talking about MU since January.

And now we have another breakout to new highs.

Why have I liked MU?

Same thing I keep saying over and over again.

  • Big earnings.

  • Big sales.

  • Amazing return on equity.

  • Strong margins.

  • A hot industry group.

  • One of the strongest stocks in that group.

  • Aligned with the current bull market theme.

  • Fund ownership also continues to increase quarter over quarter.

Yes, there have been higher-performing relative strength stocks on a pure price basis.

But when you combine fundamentals and price action, there are not many names that come close to MU.

This is not about chasing random names.

It is about identifying super performance characteristics, tracking the leaders, and staying aligned with the strongest stocks in the strongest groups as long as the evidence remains intact.

MU continues to check those boxes.

View on Substack ↗

The Leaders Were Hiding in Plain Sight

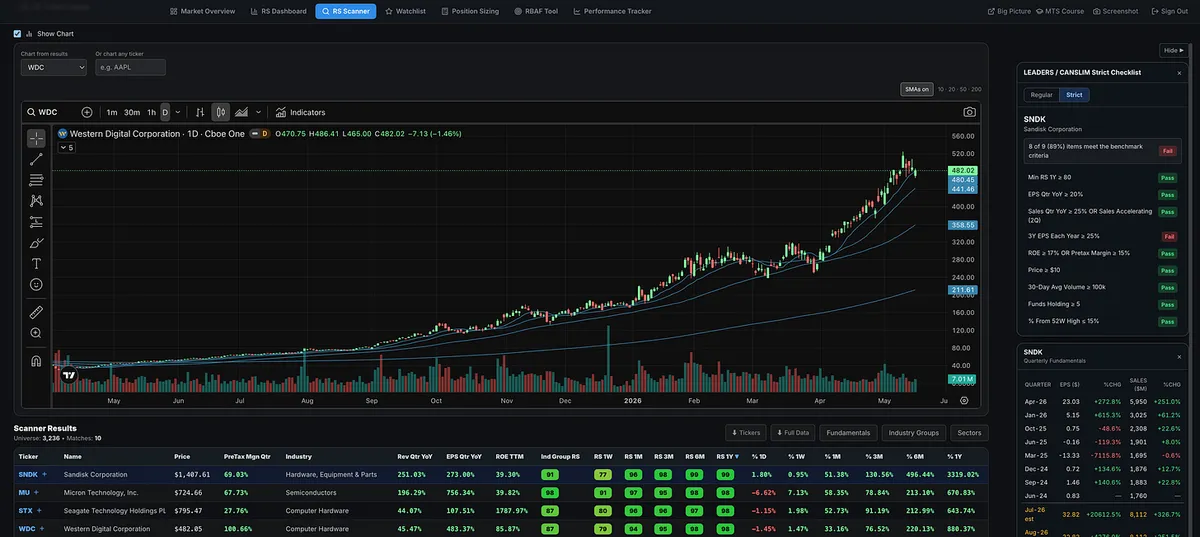
Back in January, when I first started sharing names, SNDK, MU, STX, and WDC were some of the stocks I kept coming back to.

Why?

Because they checked almost every box.

  • They were aligned with the dominant bull market theme: AI.

  • They were sitting inside a hot industry group.

  • They were among the strongest stocks in that group.

  • They had explosive earnings growth, big sales growth, strong margins, high return on equity, and elite relative strength.

That is not complicated. That is exactly what the legendary growth stock traders have been teaching for decades.

Look for the strongest stocks, in the strongest groups, supported by the strongest fundamentals, during a confirmed bull market.

Were there other high-flying names?

Of course.

But many of them did not have all the ingredients these names had.

The only major O’Neil-style box these stocks have not consistently checked is the three-year annual EPS growth requirement of 25% or greater each year.

But outside of that, they had almost everything you want to see in a potential market leader.

And today, finding these names is easier than ever.

View on Substack ↗

“Nothing to Buy?” MU Was Hiding in Plain Sight

I keep hearing the same thing since the follow-through day on April 8th and the move back above the 50-day and 200-day moving averages:

“There’s nothing to buy. Everything is extended.”

I don’t think that’s true.

The issue usually isn’t that there are no stocks setting up. The issue is that most traders are not prepared before the setups happen.

If you had a proper watchlist built, many of the names breaking out right now have been showing leadership for a long time. Yes, some moved before the market gave us confirmation to start getting involved again. That happens. But some broke out after.

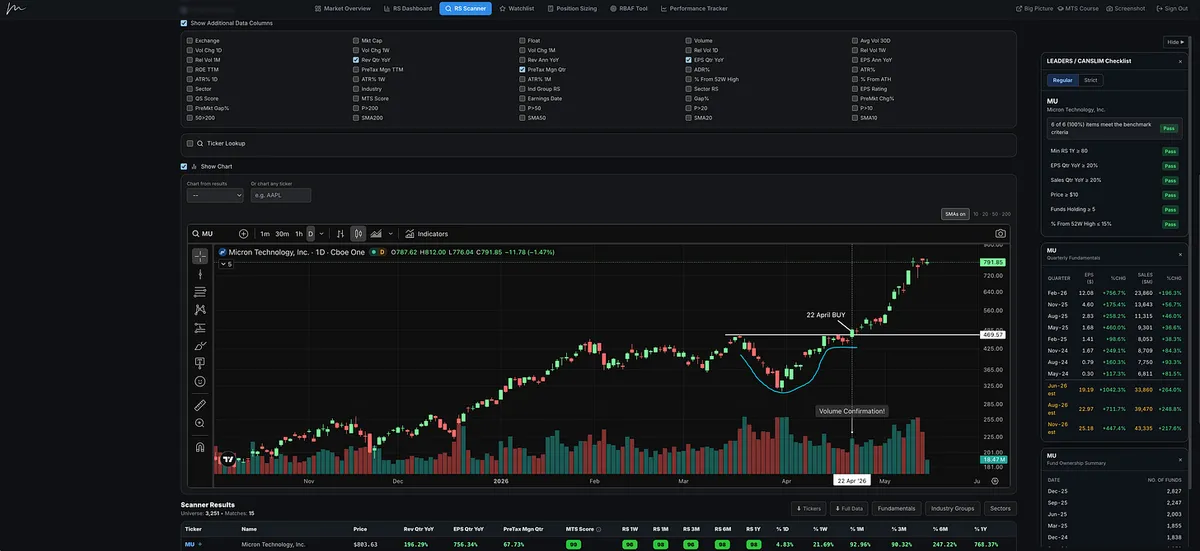
MU is a great example.

Micron had a beautiful cup-with-handle setup and broke out on April 22nd, roughly 10 to 11 days after the market gave us the signal to start getting back involved.

And this wasn’t some random laggard.

MU had strong relative strength, a hot industry group, big earnings growth, strong sales growth, powerful forward estimates, and a chart that was setting up.

This is exactly why I built the Relative Strength Stock Screener.

The goal is simple: narrow your watchlist down to the strongest leadership names before the move happens, so you don’t miss these types of setups.

Also, try using the MTS Score.

That is our proprietary leadership rating that looks at relative strength, earnings, sales, pre-tax margins, ROE, industry group relative strength, and proximity to 52-week highs.

It is designed to help you quickly separate true leadership from average names.

There have been plenty of stocks.

You just need to know where to look.

View on Substack ↗

Is a 5% Stop Too Tight in Today’s Market?

I got a great comment recently:

“It’s just that -5% is not much in today’s markets. Not enough not to get whipsawed. What’s your view?”

Here’s my answer.

I disagree.

There are still plenty of setups where you can risk 5 percent or less.

If that wasn’t the case, traders like Kristjan Kullamägi wouldn’t be as successful as they are.

Same with Mark Minervini. He won the U.S. Investing Championship in 2021. He’s still finding tight entries in today’s market.

It comes down to tactics and timing.

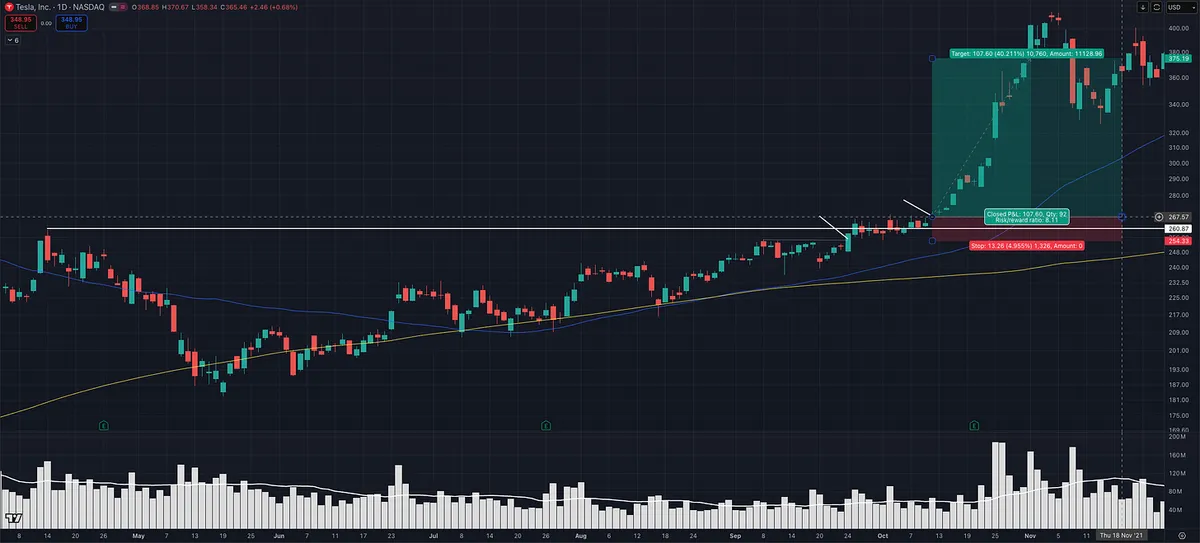
This TSLA example is a good illustration.

On the right side of the base, price was tightening and structure was clean. That created multiple opportunities where risk could be kept at 5 percent or less.

Recently (2025-2026), with many of the big winners already extended in Stage 2 uptrends, it’s a different environment.

If you’re only buying standard breakouts here, then yes, your stop likely needs to be 7 to 10 percent.

But that’s just one way to play it.

A lot of the big winners from 2025 to now in areas like computer data storage and telecom, names like LITE, SNDK, MU, CIEN, WDC, were harder to trade with tight risk using traditional breakout entries.

Their ADR% was higher, and there was less contraction into the pivot, so traders had to adapt.

Pullback entries. Low cheats. Intraday entries like ORB.

Those allow you to define risk much tighter and still participate without getting shaken out.

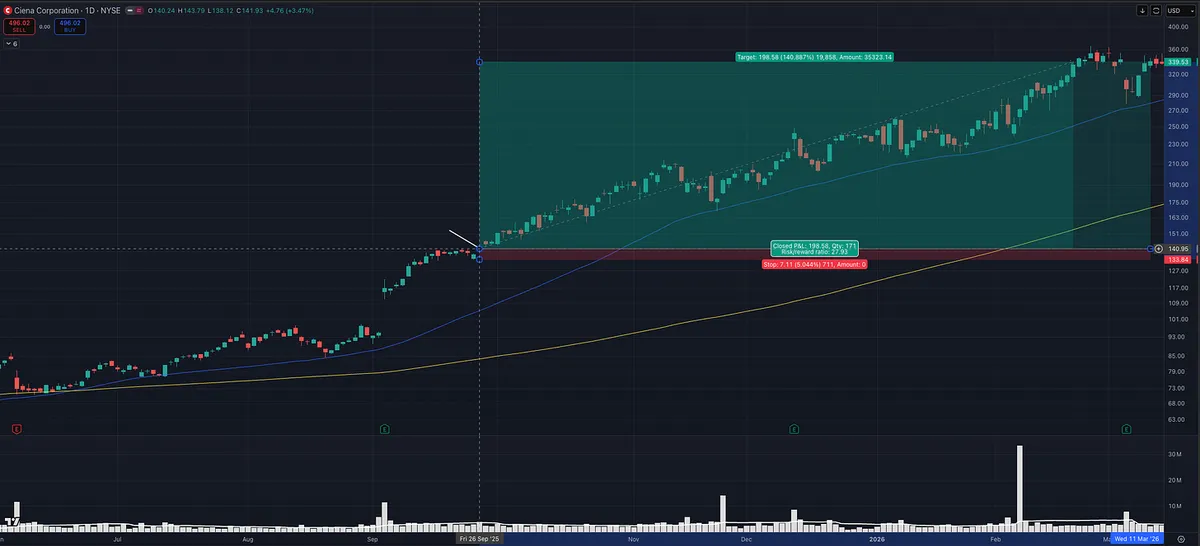
CIEN is another good example.

After an episodic pivot on earnings, price ran, then tightened sideways. That created a clean opportunity to enter with defined, tight risk.

This isn’t about forcing a fixed 5 percent stop on every trade.

It’s about finding entries with proven setups where tight risk actually makes sense.

Timeframe matters. Setup matters. Execution matters.

And just like Minervini, I’m not rigid with it.

Some trades might be 3 percent risk. Some 5 percent. Some 6 to 8 percent depending on the setup.

I’ll even go up to 10 percent and adjust position size, but I prefer tighter risk when the setup allows it.

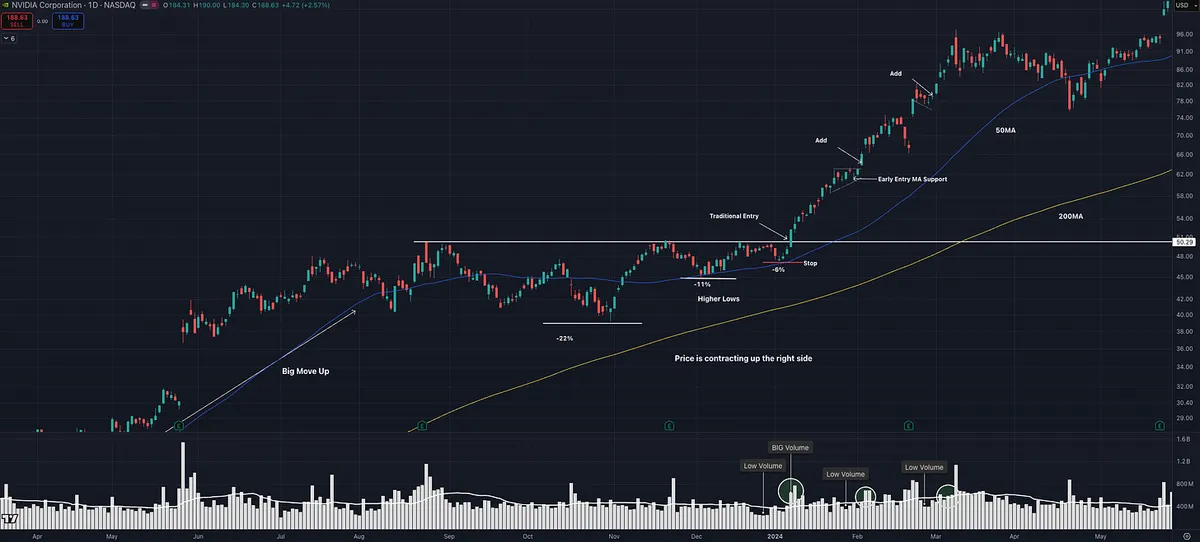
Another good example is NVDA in 2024. I had about 6 percent risk. Someone else could have taken the same trade and used the breakout day opening range low as a stop and risked closer to 1.82 percent and likely wouldn’t have been stopped out.

Like David Ryan often emphasizes, the best trades tend to be hard to buy, work right away, and don’t look back.

The principle stays the same.

Keep losses small. Don’t let one trade do real damage.

And at the end of the day, we all trade differently and that’s ok.

That’s what makes a market.

Different styles can still make money.

View on Substack ↗

Why MU Keeps Showing Up

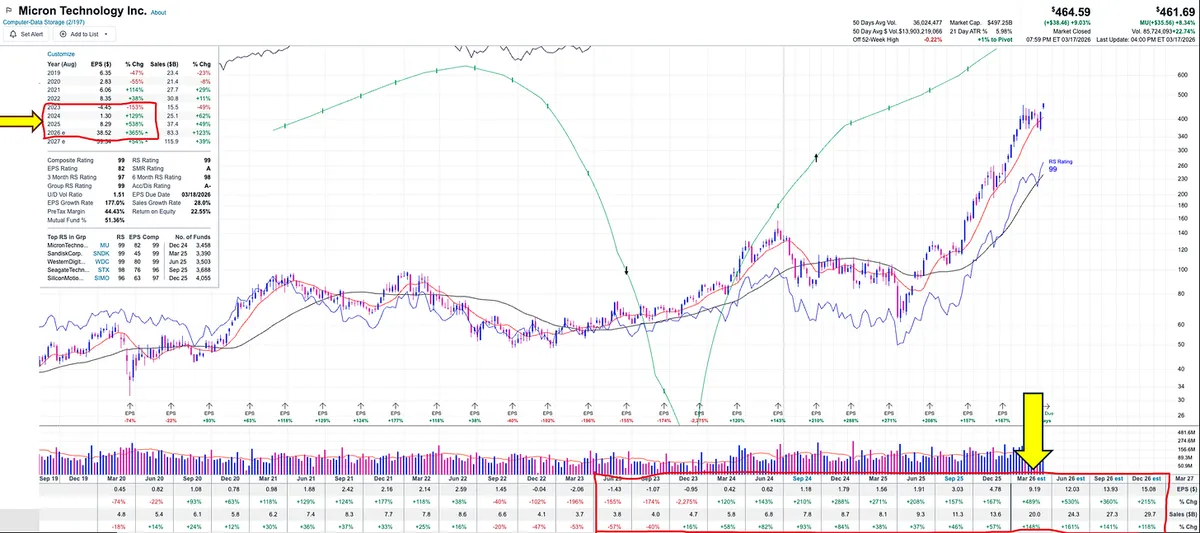
There is a reason I keep bringing up Micron in the Substack chat.

Look at what is happening under the surface.

Earnings and sales are not only strong, they are improving quarter after quarter. That is the key.

Now combine that with:

• A leading industry group, one of the strongest in the market

• Return on equity around 22%

• Expanding margins above 40%

• Relative Strength Rating of 99

• Increasing institutional ownership quarter over quarter

The stock continues to find support at the 50-day and 10-week moving averages and pushes higher.

This is what a true leader looks like.

View on Substack ↗

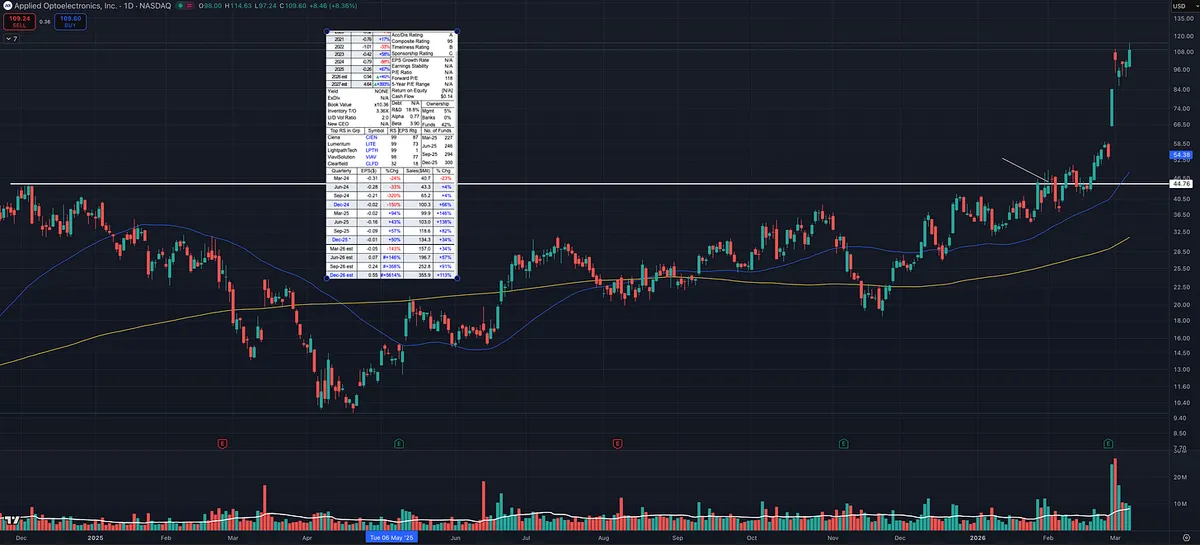
Why I Mentioned AAOI Before Earnings

Someone asked why I mentioned AAOI in early February with earnings coming up.

First, the stock checked several boxes I look for.

It was in a HOT group (telecom) showing strong relative strength across multiple timeframes. I had already seen success with LITE and CIEN, which are in the same space. It reminded me of past industry runs like the computer data storage group when SNDK, MU, WDC, and STX all moved together.

AAOI also had:

• Strong earnings and sales acceleration

• Rising forward estimates

• Accelerating fund ownership

• Tight price action on the right side of the chart

• Trading near new 52 week highs

Since that mention the stock has moved about 150%, but the trade management is the important part.

I normally do NOT buy a stock a few days before earnings. There is too much risk and no time to build a cushion.

I follow the advice from Paul Tudor Jones:

“Never trade in situations where you don’t have control. For example, I don’t risk significant amounts of money in front of key reports, since that is gambling, not trading.”

In this case there were about three weeks before the report, which gave the trade time to work.

From the original buy, the stock moved roughly 30% before earnings.

At that point the plan becomes simple:

• Trim a large portion before the report

• Lock in gains and reduce risk

• Hold a smaller position into earnings

Even great stocks can drop 15–20% overnight on earnings.

By trimming beforehand, the position already has a profit cushion, so the remaining shares carry much less risk.

This is something I learned studying the playbooks of William O’Neil, Mark Minervini, and David Ryan.

The goal isn’t predicting earnings.

The goal is managing risk while letting strong stocks work in your favor.

View on Substack ↗

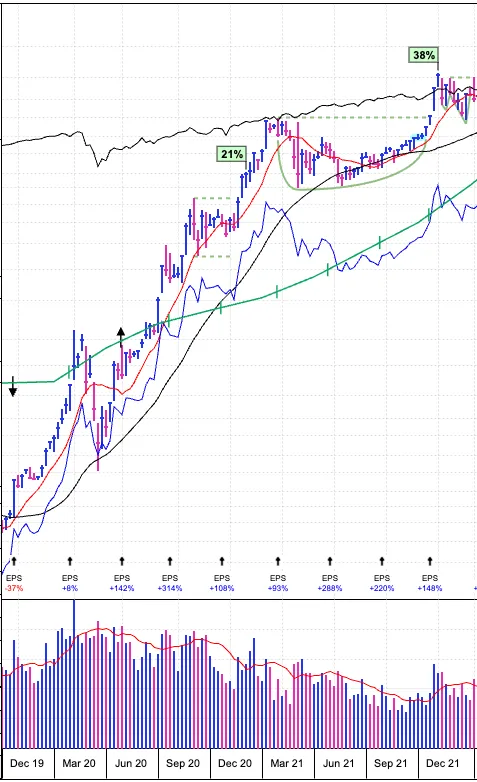
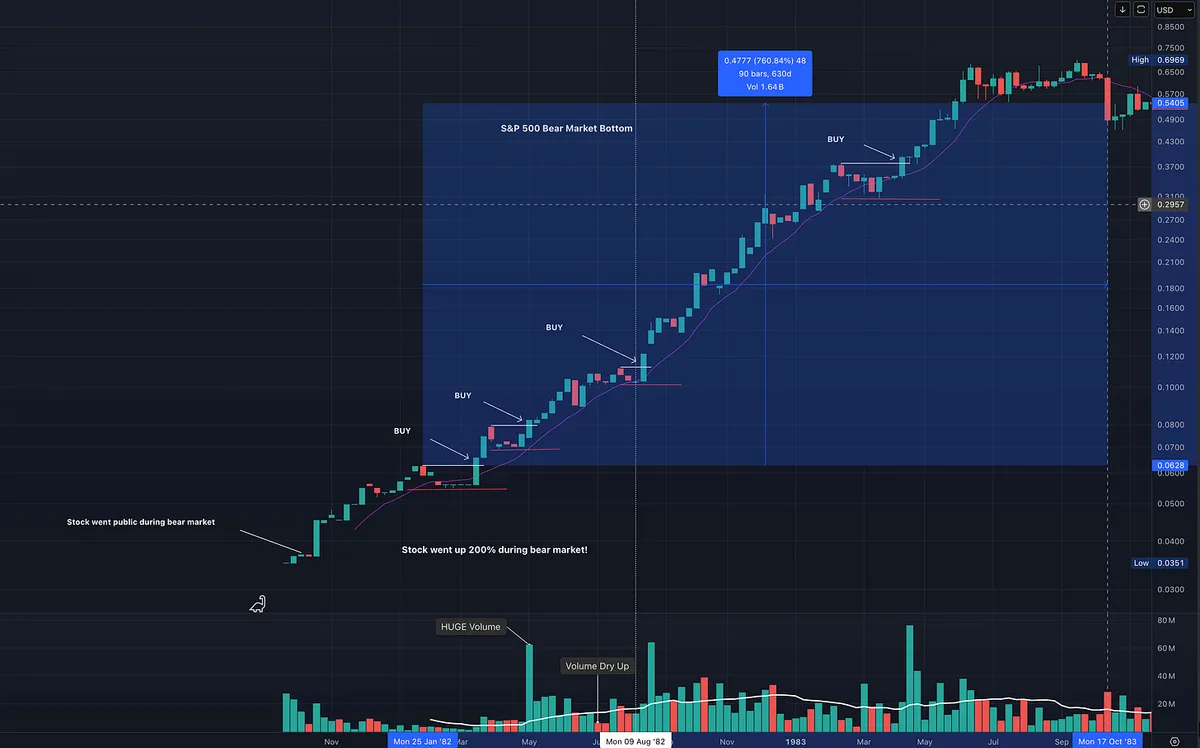
“It’s extended.”

That’s what people say when they haven’t studied enough.

This chart, originally shown in How to Make Money in Stocks by William J. O’Neil , shows something important.

Yes, the stock is extended from what most would call a traditional base.

But Home Depot in the early 80s kept offering low risk, high reward entries inside a powerful Stage 2 uptrend.

Look at the areas marked BUY:

  • Tight consolidations

  • Volume contraction

  • Higher lows

  • Breakout through short resistance

  • Immediate continuation

That is not chasing.

That is entering strength with defined risk.

You do not always need:

  • A cup with handle

  • A massive reset

  • A 30 percent correction

Big institutional leaders often stair step higher.

They build tight flags. They pause. They break out. They continue.

If the stock is trending above a rising moving average, If price is contracting, If volume dries up before expansion,

That is opportunity.

This is not FOMO into a straight up name. We are still being patient. We are still waiting for tight pullbacks inside strength.

It looks very similar to some of the biggest winners we have had recently.

How many could have stepped into MU, LITE, or AVGO using similar entry tactics?

Study that difference.

View on Substack ↗

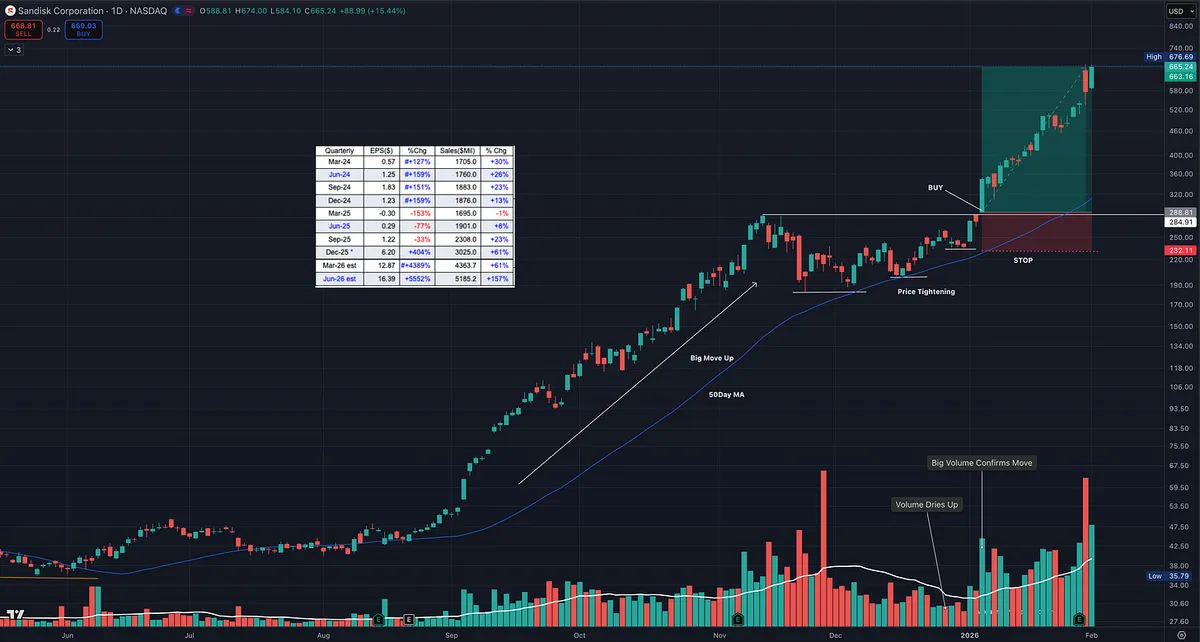
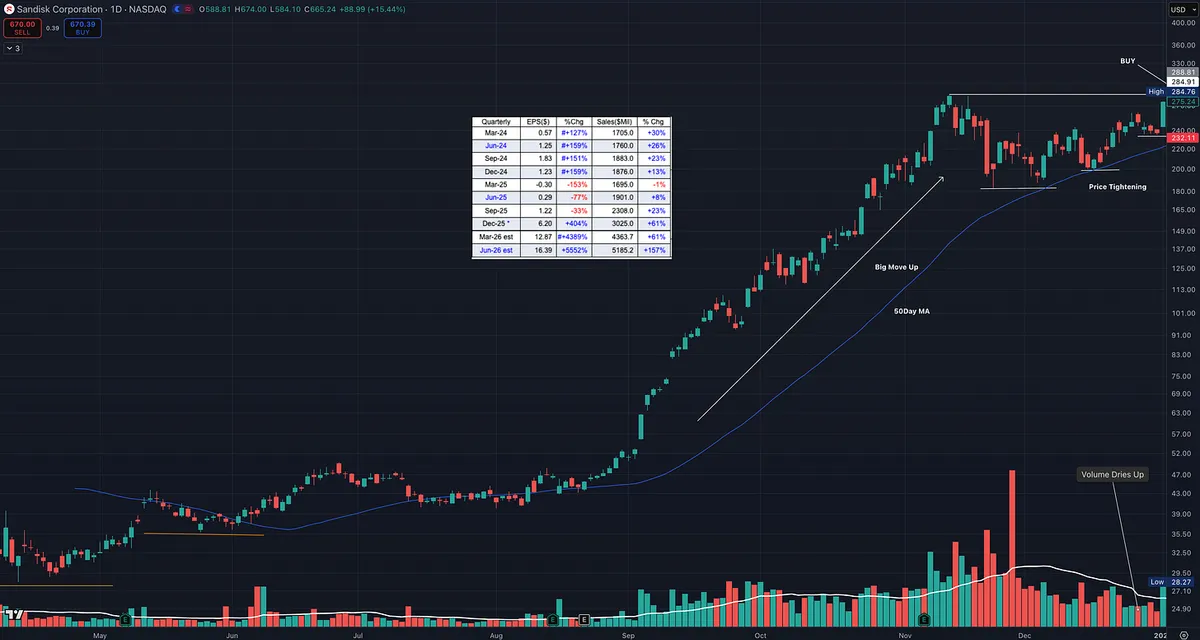
Study This Chart: One of the Best Low Risk Breakout Setups

This chart is a perfect example of the type of setup we look for.

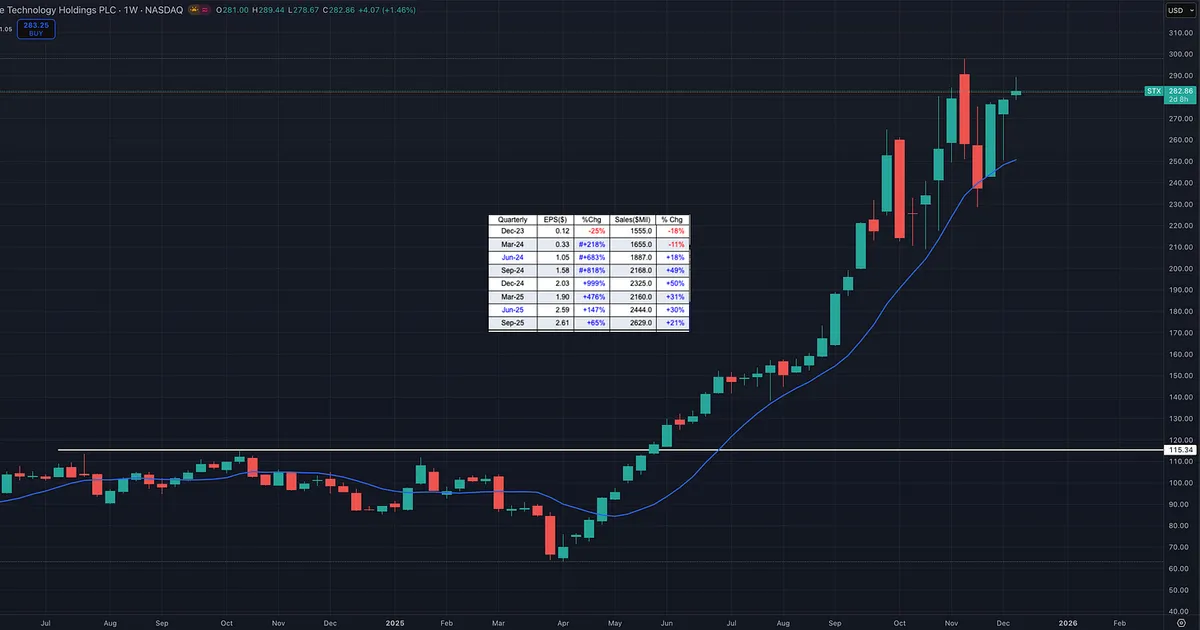
The stock is sitting inside a subsector that supports the main market theme right now, AI. When a subsector is strong, it tends to lift the entire group. That is why you see other names in the space acting well too, like Micron Technology, Western Digital, and Seagate Technology.

Now zoom in on the important part.

What makes this a premium setup is that it checks the fundamental boxes that show up in many of the biggest winners of all time, the type of characteristics William J. O'Neil wrote about after studying market history going back over a century.

But fundamentals alone are not what makes this special.

The real edge is the price action.

1) High relative strength

When a stock has RS in the 90s, it is telling you institutions are already voting with their money. This is what you want in a true leader.

2) Big earnings and big sales

Strong numbers are the fuel. Price action is the trigger. When both line up, it is hard for the market to ignore.

3) Big move up, then price tightens

This is the cheat code. A strong advance followed by tight price action. That is where the market gives you a gift.

Tightening action does two things.

  • It shows supply is drying up.

  • It gives you a clean place to define risk.

Why this is low risk and high reward

When price tightens near highs and then breaks out, you can build a trade that is asymmetric.

You are not guessing. You are defining a level that proves you wrong.

If it fails, you are out quickly.

If it works, you can ride a trend and manage it.

That is how you end up with trades that can pay 3R, 5R, even 10R plus while keeping the downside controlled. Study what what it looks like before and after.

View on Substack ↗

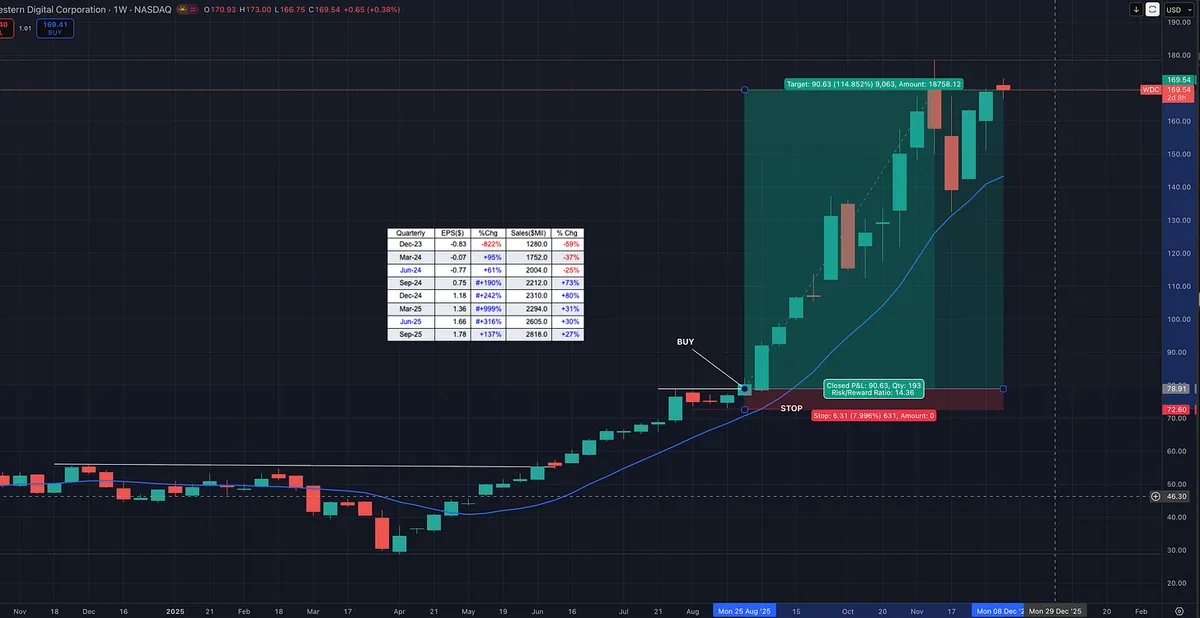
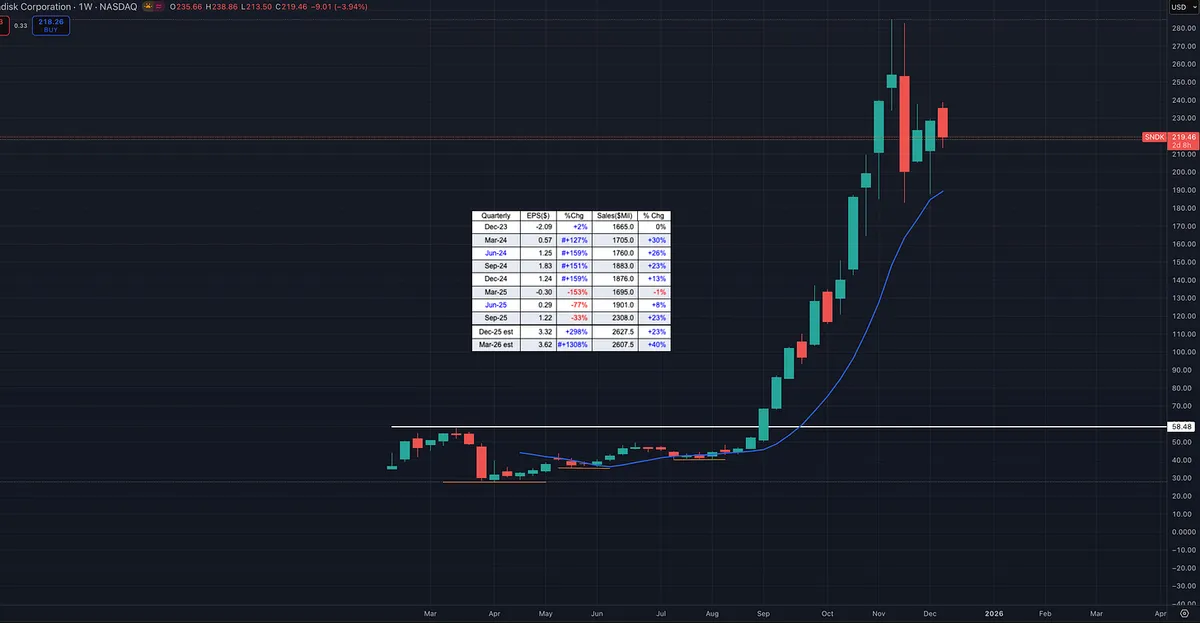
Data Storage Quietly Became One of the Strongest Leadership Groups in the Market

While everyone kept talking about chips, metals, and AI all year, the real expansion of this bull cycle has been happening somewhere else: data storage.

MU, WDC, STX, and even SNDK have been posting massive earnings and sales acceleration. SNDK has not delivered the same near-term numbers, but analysts and funds are clearly positioning for future growth and the stock has surged alongside the leaders.

This entire group started emerging back in April. Since then, the charts, the tape, and the fundamentals have all lined up.

This is exactly why serious traders track relative strength stocks and relative strength industry groups. Leaders rarely move alone. The biggest moves come when multiple stocks in the same industry begin showing strength at the same time, which is a sign that big money is rotating into that group.

When a major theme like AI takes hold, leadership does not stay static. It expands. And by the time most people finally recognize the True Market Leaders, the next group is already breaking out.

Watch the stocks. Watch the groups. Watch the earnings and sales.

View on Substack ↗

The Art of Sleeping Well: Risk Management Like Bruce Kovner

“Whenever I enter a position, I have a predetermined stop. That is the only way I can sleep. I know where I’m getting out before I get in. The position size on a trade is determined by the stop, and the stop is determined on a technical basis. For example, if the market is in the midst of a trading range, it makes no sense to put your stop within that range, since you are likely to be taken out. I always place my stop beyond some technical barrier.” — Bruce Kovner, Market Wizards

The Lesson

This quote captures one of the most timeless principles in trading: control risk first, profit comes second. Kovner didn’t guess where the market might go; he defined exactly where he’d be wrong before entering the trade.

The Example: Translating the Quote Into Action

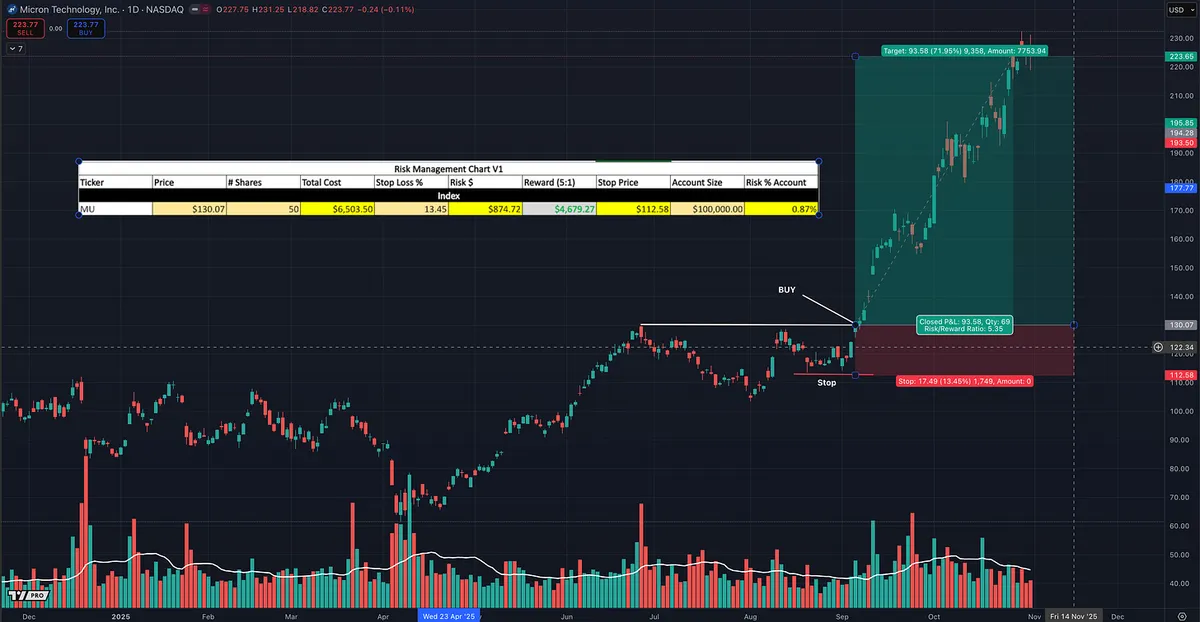
Let’s bring this to life with Micron (MU).

  • Entry: $130.07

  • Stop: $112.58

  • Stop Loss %: 13.45%

  • Account Size: $100,000

  • Target Risk per Trade: 1% (or $1,000)

If we simply bought any random number of shares, a 13.45% stop could easily blow through our target risk. But instead, we let the chart dictate where the stop goes — just below a key technical level — and then we adjust our position size so that the dollar loss stays within 1% of the account.

That’s how we arrive at 50 shares, risking $874.72 total.

Why the 13.45% Stop Makes Sense

Looking at the chart, you can see how the stop sits below prior support and the breakout zone — a level where, if price falls back through, the trade idea is invalidated. That’s exactly what Kovner meant by placing your stop beyond a technical barrier.

Setting the stop inside the range would’ve exposed us to random volatility and a likely premature exit. By respecting market structure, we give the trade room to breathe — but by managing position size, we keep risk capped and consistent.

The Takeaway

The professional mindset isn’t about predicting the next big move — it’s about controlling the downside so you can stay in the game long enough to catch the upside.

Every trade starts with two questions:

  1. Where am I wrong? → defines your stop.

  2. How much am I willing to lose? → defines your position size.

When you combine those answers, you get clarity, consistency, and, as Kovner said, the ability to sleep at night.