Momentum Trading Strategy

Notes

Finding Leading Stocks

What to buy: how to find, screen and rank the strongest stocks and industry groups.

Showing 161–180 of 299 notes

View on Substack ↗

Buying Strength Is Not a New Idea

A lot of traders think buying strength is some modern momentum concept.

It is not.

Bernard Baruch understood this more than 100 years ago.

In My Own Story, he described watching Goldfield Consolidated get hit with a large sell order, but instead of crumbling under that supply, the stock barely moved.

Baruch wrote:

“Instead of being driven down, the stock held to within a fraction of a point. This showed a market strength in Goldfield Consolidated that few had dreamed possible.”

That is strength.

Not necessarily relative strength against the entire market in that exact passage, but strength against selling pressure.

And that is the same thing growth stock and momentum traders still look for today.

  • When a stock gets hit with supply, does it break?

  • When the indexes are weak, what stocks are holding key levels?

  • When sellers show up, where are buyers still stepping in?

Because those are often the names that can become leaders when conditions improve.

Weak stocks break under pressure.

Strong stocks absorb supply.

The amateur looks for what is down the most.

The trained trader looks for what refuses to go down when it should.

Because strength is critical information.
View on Substack ↗

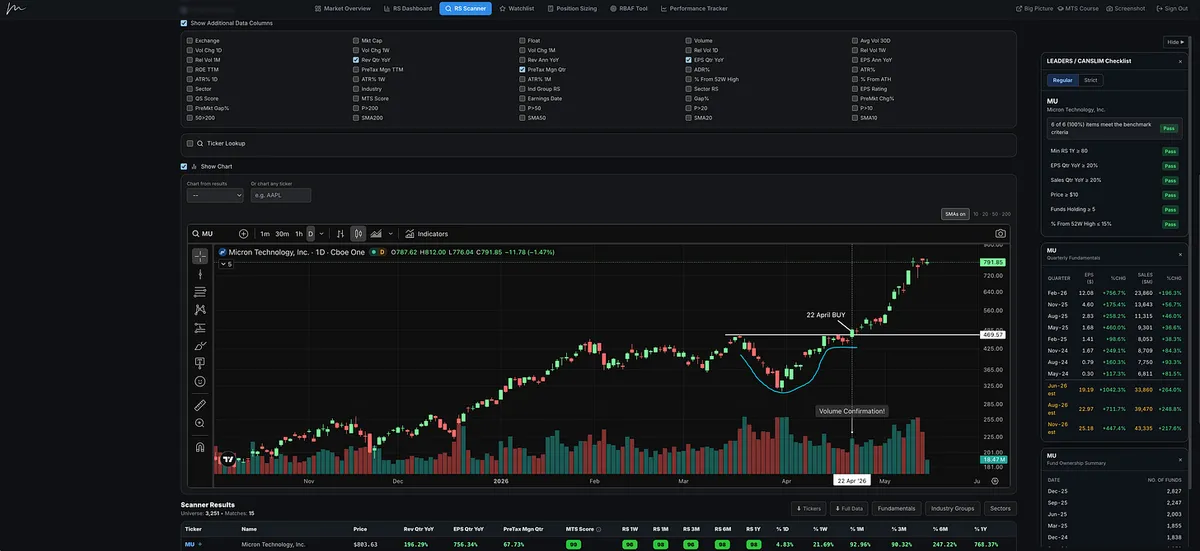
“Nothing to Buy?” MU Was Hiding in Plain Sight

I keep hearing the same thing since the follow-through day on April 8th and the move back above the 50-day and 200-day moving averages:

“There’s nothing to buy. Everything is extended.”

I don’t think that’s true.

The issue usually isn’t that there are no stocks setting up. The issue is that most traders are not prepared before the setups happen.

If you had a proper watchlist built, many of the names breaking out right now have been showing leadership for a long time. Yes, some moved before the market gave us confirmation to start getting involved again. That happens. But some broke out after.

MU is a great example.

Micron had a beautiful cup-with-handle setup and broke out on April 22nd, roughly 10 to 11 days after the market gave us the signal to start getting back involved.

And this wasn’t some random laggard.

MU had strong relative strength, a hot industry group, big earnings growth, strong sales growth, powerful forward estimates, and a chart that was setting up.

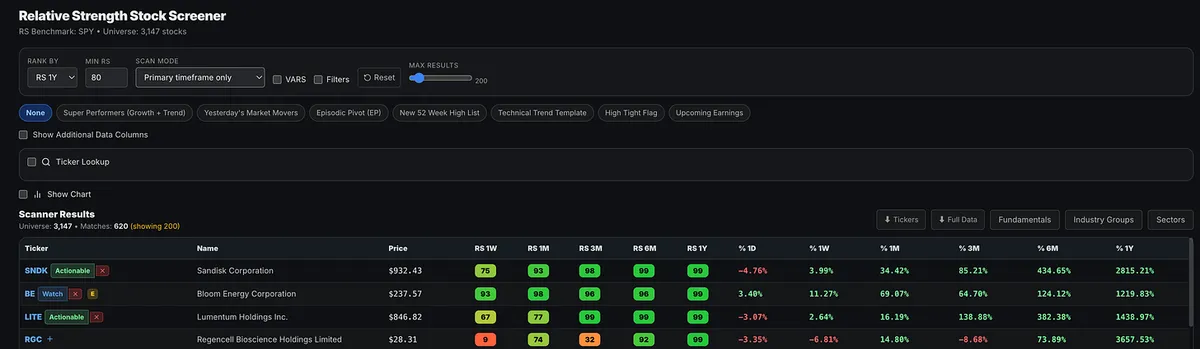
This is exactly why I built the Relative Strength Stock Screener.

The goal is simple: narrow your watchlist down to the strongest leadership names before the move happens, so you don’t miss these types of setups.

Also, try using the MTS Score.

That is our proprietary leadership rating that looks at relative strength, earnings, sales, pre-tax margins, ROE, industry group relative strength, and proximity to 52-week highs.

It is designed to help you quickly separate true leadership from average names.

There have been plenty of stocks.

You just need to know where to look.

View on Substack ↗

Why the Best Stocks Usually Come From the Strongest Industry Groups

Most traders are obsessed with finding the right stock.

But the better question is:

Is this stock in the right neighborhood?

William O’Neil taught that the majority of leading stocks are usually found in leading industries.

That matters because studies show that 37% of a stock’s price movement is tied to the performance of its industry group, and another 12% comes from the strength of its broader sector.

In other words, roughly half of a stock’s move can be influenced by the strength of the group it belongs to.

Then add the “M” in CAN SLIM: market direction.

O’Neil also taught that roughly three out of four stocks follow the overall market trend.

So if you are buying a stock in a weak market, inside a weak sector, inside a weak industry group, you are not just making a stock pick.

You are fighting probability.

That is why I put so much emphasis on:

  • Market direction.

  • Sector strength.

  • Industry group leadership.

  • Relative strength.

Leading stocks inside leading groups.

Recently, that has meant paying close attention to areas like technology and semiconductors, because that is where a lot of the real leadership has been.

The goal is not just to find a good company.

The goal is to find a strong stock, in a strong group, aligned with the strongest market theme, while the general market is supporting risk.

Before buying a stock, ask:

  • Is the market helping or hurting me?

  • Is the sector leading or lagging?

  • Is the industry group attracting money?

  • Is this stock one of the strongest names in that group?

Because the best stock ideas usually do not happen in isolation.

Leadership clusters.

Money rotates.

The strongest stocks are often found where the strongest institutional demand is already flowing.

View on Substack ↗

The Growth Stock Blueprint Traders Have Studied for More Than 60 Years

One of the most influential growth stock investing frameworks ever created came from William J. O’Neil’s How to Make Money in Stocks.

CAN SLIM helped shape how generations of momentum traders and growth investors think about earnings, leadership, relative strength, institutional demand, market timing, and risk management.

My new article breaks down the CAN SLIM playbook and why it still matters for finding true market leaders before they become obvious.

Read it here:

https://tradingmomentum.substack.com/p/the-canslim-growth-stock-playbook

ArticleThe CANSLIM Growth Stock Playbook Behind America’s Biggest Winners
View on Substack ↗

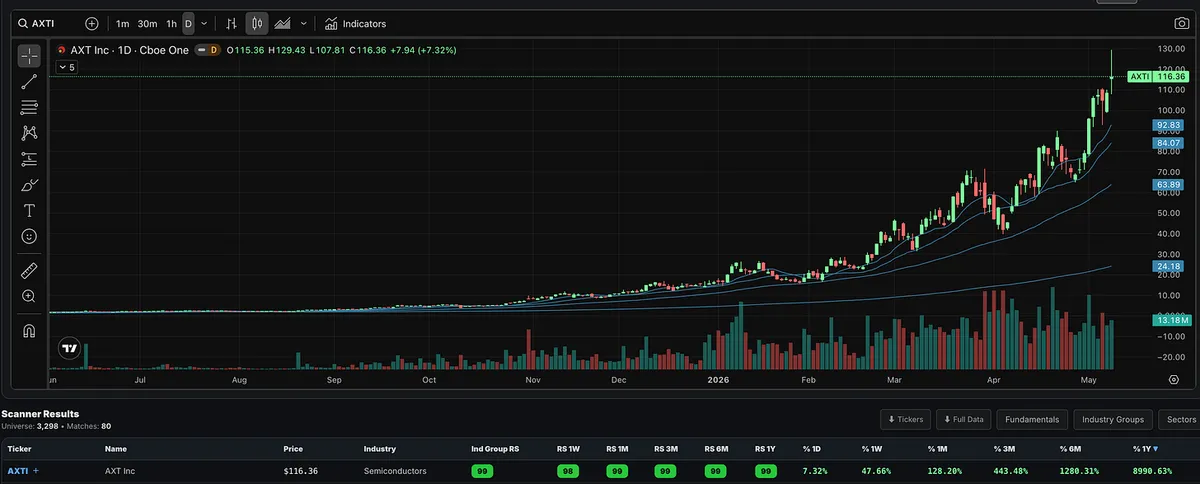
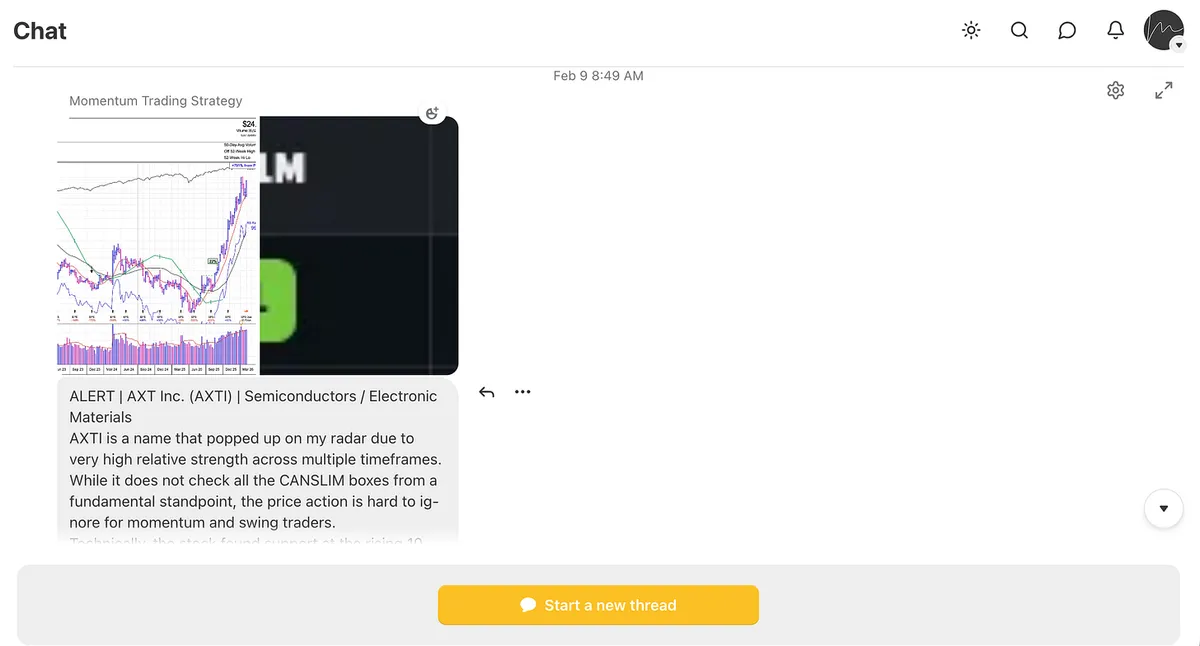
AXTI still refuses to quit.

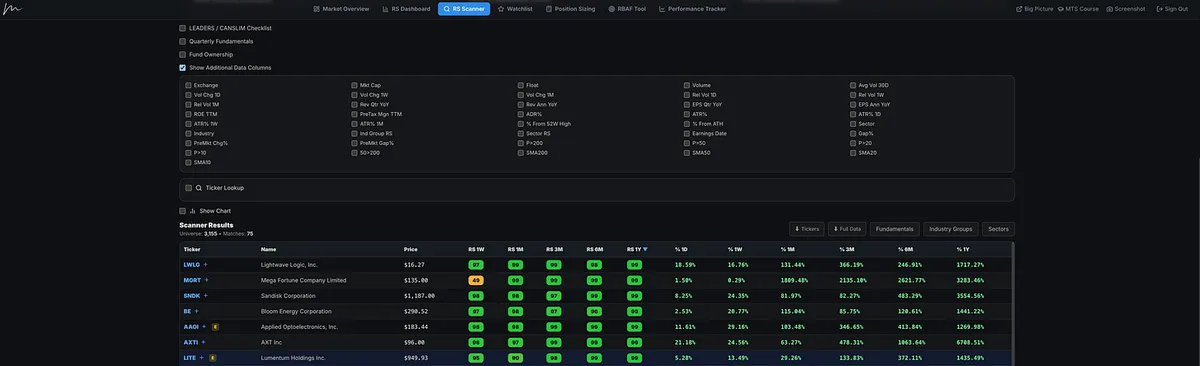
Still making new highs and once again sitting near the top of my relative strength screen.

Current RS profile:

Industry Group RS: 99

Stock RS: 99

  • AI bull market theme.

  • Semiconductors are one of the leading industry groups.

  • AXTI is one of the leading stocks in that group.

That is exactly the type of alignment I want to see in a growth-led market: strong theme, strong group, strong stock.

View on Substack ↗

New Highs Aren’t the Problem. Trapped Sellers Are.

Most people think a stock making new highs is “too expensive.”

William O’Neil taught almost the opposite.

In How to Make Money in Stocks, O’Neil explains the concept of overhead supply.

Overhead supply is created when a stock has previously traded at higher prices, then falls.

Think about what happens psychologically.

A stock runs from $25 to $40.

A bunch of people buy near $38, $39, or $40.

Then it drops to $30.

Now those buyers are trapped.

They are sitting on losses.

And many of them are thinking the same thing:

“If this thing just gets back to my price, I’m selling.”

So when the stock climbs back toward that old price area, selling pressure shows up.

Not because the company necessarily got worse.

Not because the chart is broken.

But because all those trapped buyers finally have a chance to get out even.

That is overhead supply.

It acts like a ceiling.

Every time the stock tries to move higher, old buyers become sellers.

This is why beaten-down stocks can look “cheap” but still struggle to make real progress.

They have to fight through layers of prior buyers who want out.

Now flip that around.

A stock breaking into new high ground has a major advantage.

There are fewer trapped sellers above it.

At all-time highs, there are no prior buyers sitting above the current price waiting to “get back to even.”

That does not mean every new high is a buy.

The stock still needs proper price action, volume, fundamentals, market alignment, and risk control.

But structurally, new highs have one huge edge:

There is little or no overhead supply.

That is why the strongest stocks often look “too high” before they go much higher.

The crowd sees new highs and thinks danger.

O’Neil saw new highs and asked a better question:

Is demand strong enough to absorb supply and push the stock into open air?

That is where many of the biggest winners begin.

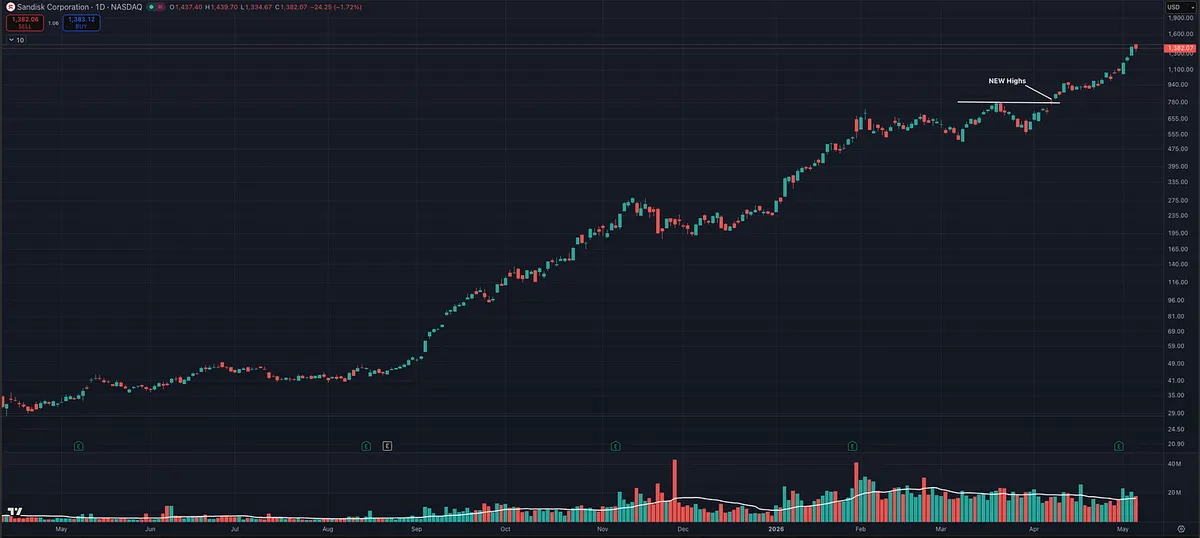
SNDK breaking into new highs before the market. That is leadership. Little overhead supply, strong demand, and price moving into open air.

View on Substack ↗

This Is Why You Track Leadership Before Everyone Else Sees It

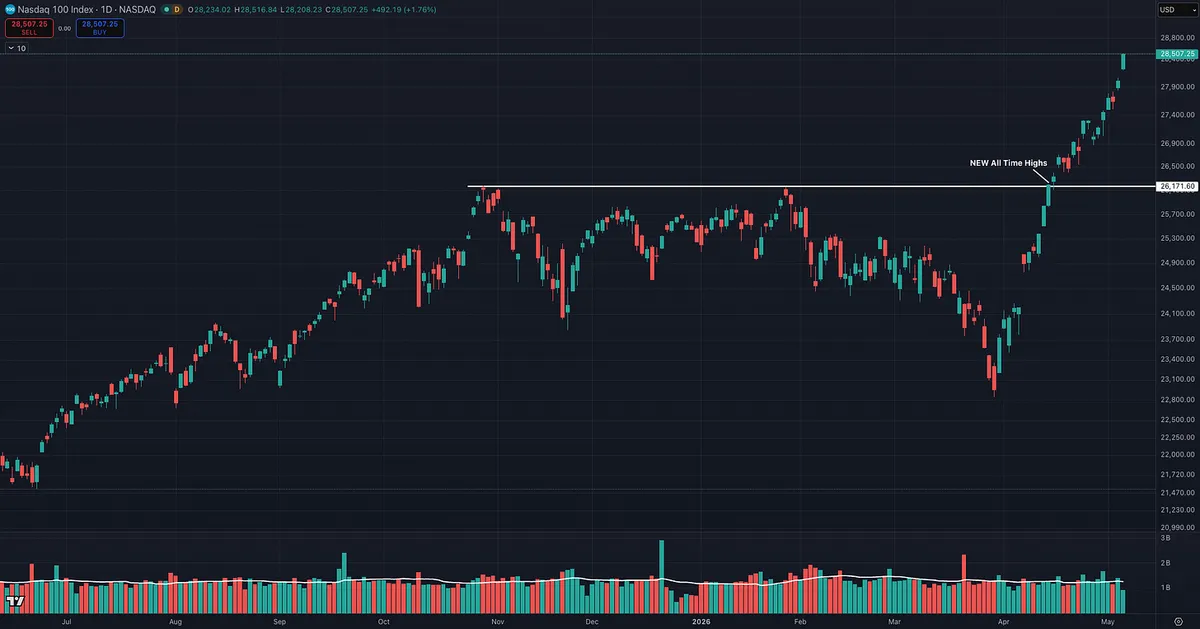
On April 8, the market gave us the signal.

We had a follow-through day, the NASDAQ-100 reclaimed key moving averages, including the 50-day and 200-day, and the conversation shifted from defense back toward offense.

But the real edge was not just knowing the market was improving.

The edge was knowing where to look.

When the market gets stronger, I want to be focused on the strongest industry groups and the strongest stocks inside those groups.

That is exactly what we had been tracking for months.

  • Telecom.

  • Computer Data Storage.

  • Semiconductors.

Many of these names were not random new ideas. They had already been showing up in our work, some for months, and some even last year.

So when the market confirmed on April 8, there was no need to bounce around looking for the next hot ticker.

The leadership was already there.

From the April 8 signal to yesterday’s close:

AAOI up 40%

LITE up 12%

CIEN up 12%

VIAV up 30%

SNDK up 81%

WDC up 38%

STX up 53%

TER flat

AEIS down 4%

AEHR up 50%

LRCX up 12%

FIX up 30%

GLW flat

Not every stock works.

That is normal.

But when the market confirms, and multiple stocks from the same leading groups start moving together, that is usually not a coincidence.

That is institutional money flowing into a theme.

Strong market.

Strong industry groups.

Strong stocks.

That is the process.

The goal is not to chase every move.

The goal is to already know where the strength is clustering before the move becomes obvious.

View on Substack ↗

How do you find stocks that can go up 100%, 200%, or 300%?

Relative strength.

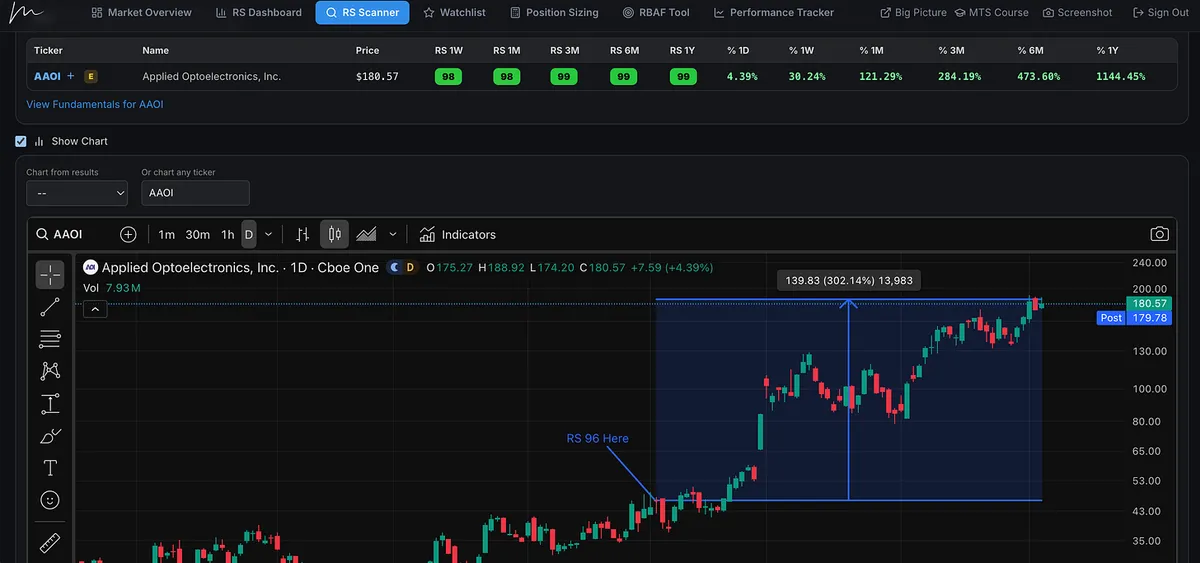
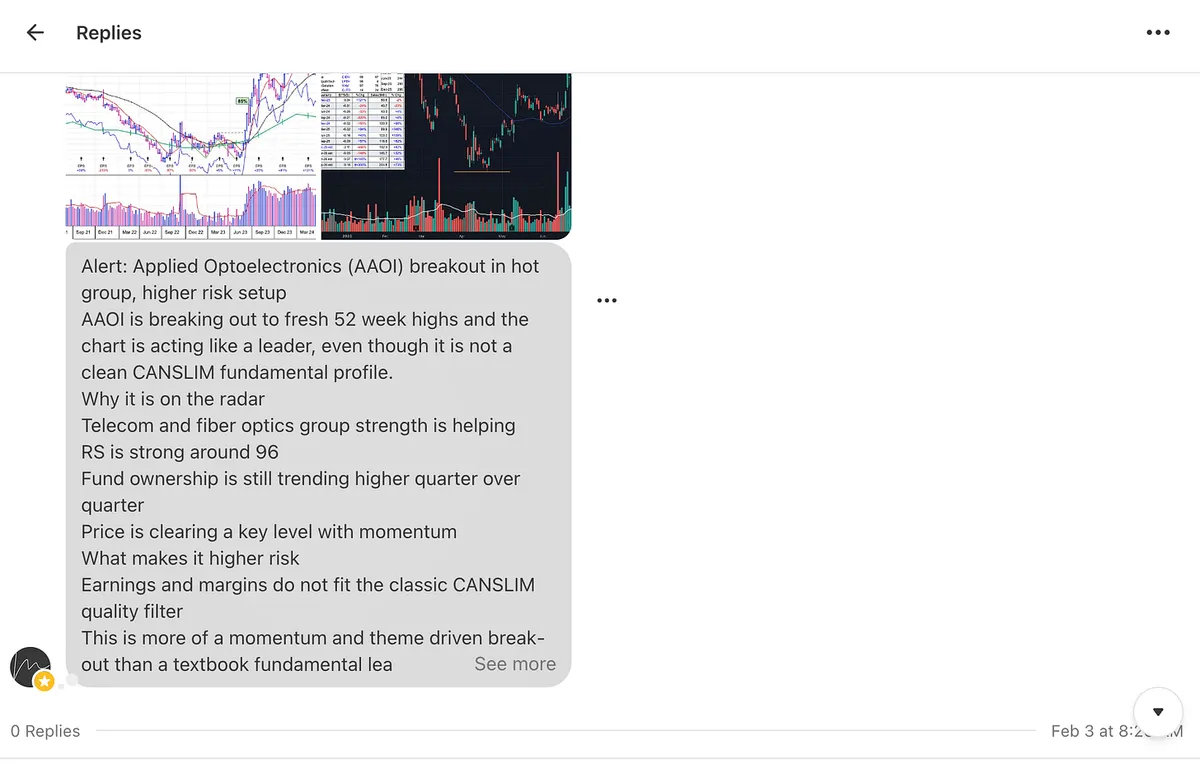
On February 3, I posted AAOI as a breakout in a hot group.

At the time, AAOI had a 96 RS rating.

It was not “cheap.”

And I’m sure plenty of people would have said the same thing they always say about strong stocks:

“But it’s extended.”

Since then, AAOI is up more than 300%.

Let that sink in.

The stock was already strong.

The group was already strong.

The relative strength was already obvious.

And that was the point.

This is exactly why I built the Momentum Trading Strategy Web App and why I literally give this tool to my paid subscribers to use.

The process is simple, but most people skip it:

Follow strength.

Find the strongest industry groups.

Then find the strongest stocks inside those groups.

That is how AAOI ended up on the radar.

AAOI was not random.

It was a strong stock in a strong group, telecom and fiber optics, breaking out with powerful relative strength.

The biggest winners rarely look comfortable early. They usually look “too high,” “too extended,” or “too late” to people who are trained to look for bargains instead of leadership.

Relative strength does not guarantee a stock will become a huge winner.

But it does one very important thing:

It puts you in the right hunting ground.

Strong stocks in strong groups, breaking out to new highs, with institutional demand behind them, are where many of the biggest moves begin.

This is why I don’t spend my time randomly bouncing around looking for the next hot ticker.

I start with relative strength.

I look for leadership.

I track the strongest industry groups.

Then I wait for the market, the setup, and the risk/reward to align.

AAOI was not a surprise.

It was on the radar because the process put it there.

The screenshots show the “then” and the “now.”

February 3: AAOI with a 96 RS rating.

Today: AAOI up more than 300%.

This is why relative strength matters.

Not because every strong stock works.

But because the biggest winners are almost always strong before most people believe they can go much higher.

View on Substack ↗

“Relative Strength Doesn’t Work.” Okay.

“It only finds extended names.”

“I don’t want to buy strong stocks because they’ve already moved too much.”

I hear this all the time.

Most of that fear does not come from relative strength being flawed.

It comes from people not knowing how to manage risk, or frankly, not studying big winning stocks cycle after cycle.

If you understand position sizing, proper entries, logical stops, and low-risk, high-reward setups, high relative strength is not something to fear.

It is something that should grab your attention.

AXTI is a great example.

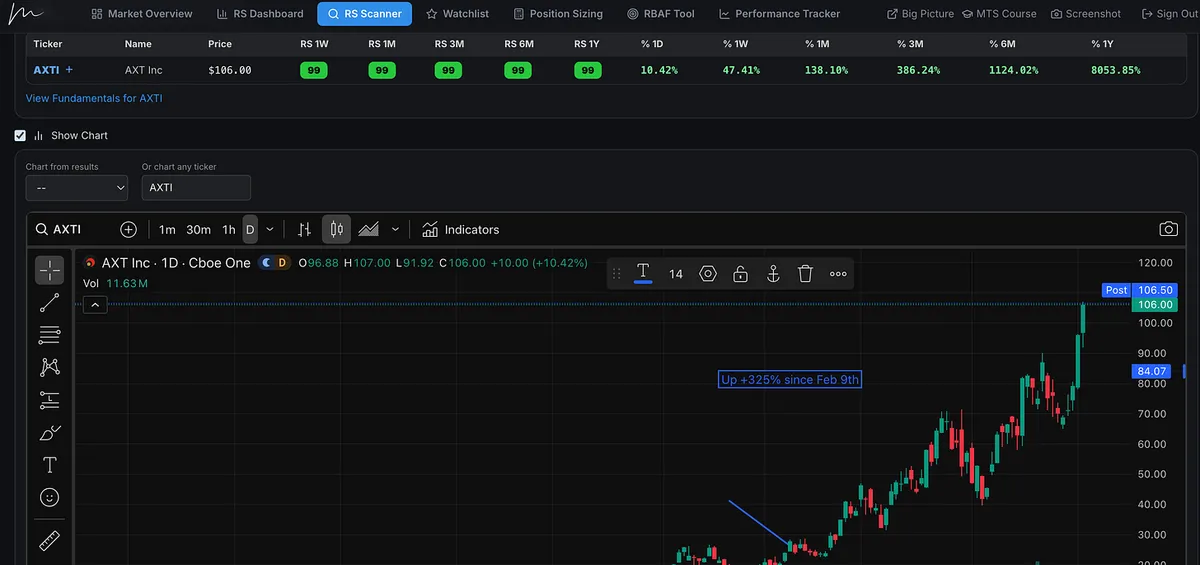
Back in February, it had a 99 RS and was sitting near the top of my Relative Strength Stock Screener.

It kept showing up week after week.

Month after month.

And since then, it has gone up more than 325%.

That is what strong stocks often do.

They go much higher than most people expect.

And weak stocks often go much lower than most people expect.

AXTI also had something else going for it:

A strong stock, in a strong group, aligned with a major bull market theme.

That is a principle that has shown up in market leaders for decades.

Follow relative strength.

Do not fear strength just because other people do not know how to manage risk.

If the trade does not work, you get out with a small loss.

If it works, you have the potential for a huge gain.

View on Substack ↗

The Best Stocks Usually Look Strong Before They Look Obvious

William O’Neil said this in Market Wizards, and it still applies today:

“The 500 best-performing stocks during the 1953–1985 period had an average relative strength of 87 before their major price increase actually began.”

That is the point most investors miss.

The best stocks usually do not start their big moves from weakness.

They start from strength.

They are already outperforming the market, already showing demand, and already separating themselves from the average stock before the crowd fully recognizes what is happening.

This is why relative strength matters so much.

It helps us focus on where institutional money is already flowing instead of wasting time digging through laggards because they look “cheap.”

Strong stocks can always get stronger.

LITE is a recent example. Back in January, it already had a 99 Relative Strength Rating, and it still went on to gain more than 100%.

Strength should not scare you away.

It should get your attention.

Weak stocks can stay weak much longer than people expect.

The goal is not to find the lowest-priced stock.

The goal is to find the leaders before the move becomes obvious.

View on Substack ↗

Stop Trying to Outsmart Strength

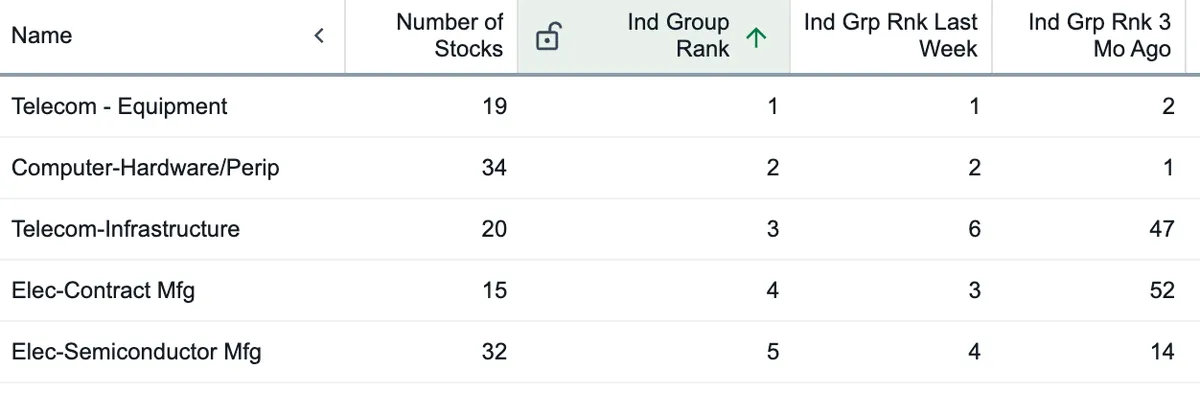
Same industry groups. Week after week.

  • Telecom equipment and infrastructure.

  • Computer hardware/peripherals (data storage).

  • Semiconductors.

There is no secret here.

Computer data storage and telecom have been strong for over a year. Semis have been hot on and off this entire bull market.

Yet traders still want to work harder than smarter.

They keep digging through weak groups, trying to find the “next” thing, while the current leaders keep leading.

At some point you have to ask:

Do you want to be clever?

Or do you want to make money?

Leadership usually leaves clues.

View on Substack ↗

How I Find Stock Market Leaders

Did a quick 20-minute walkthrough video of the Relative Strength Stock Screener and Web App for those who’ve been asking about it.

This is exactly how I’m finding leading stocks each week. Nothing fancy. Just a structured process that actually works.

If you’ve been wondering how I use relative strength, fundamentals, and industry groups together, it’s all in here.

Watch it here ↓ https://tradingmomentum.substack.com/p/find-the-leaders-a-structured-approach

ArticleFind the Leaders: A Structured Approach to Relative Strength
View on Substack ↗

Why My Relative Strength Screener Finds Leaders Earlier

People have asked what the difference is between my Relative Strength Stock Screener and Investor's Business Daily.

Short answer: same concept, better execution.

Both measure performance vs SPY and rank stocks on a percentile basis.

But the differences are what matter.

First, I allow multiple timeframes.

Not just the standard 12 month view.

You can see 1 week, 1 month, 3 month, 6 month, and 1 year relative strength.

That 1 month view has consistently helped surface names before they show up on traditional RS rankings.

It also lets me track acceleration vs deceleration across timeframes.

That has been one of the biggest edges. You can quickly spot when leadership is gaining momentum… or when it is starting to fade.

Second, and more important:

I filter the universe before assigning an RS rating.

IBD ranks against 11,000+ stocks.

I start there, but remove low price, low volume, and low cap names that do not meet CANSLIM-style criteria.

So instead of ranking against everything…

You are ranking against stocks you would actually trade.

Bottom line:

The concept is the same.

But the signal is cleaner.

And cleaner signals lead to better decisions.

View on Substack ↗

The Market Is Telling You Where To Look… Are You Listening?

You want the #1 stock.

The one that defines the cycle. The one everyone talks about. The one that goes 300%+.

And yes, if you land in that name, that is where life-changing returns come from.

But here is what most traders miss.

You do not need the #1 stock.

You can win big with #2, #3, #4, and so on.

How the market actually moves

Trends do not show up in isolation.

They show up in clusters.

Strong stocks inside strong industry groups. Aligned with powerful themes.

This is not new.

Nicolas Darvas was doing this in the 1950s.

He focused on stocks that stood out like a beacon above weaker names and moved into powerful advances.

He was not chasing random stocks.

He was following where strength was concentrating.

What the market is showing right now

Top groups:

  • Telecom Fiber Optics

  • Computer Data Storage

  • Semiconductor Equipment

That is where institutions are putting money.

That is where trends are forming.

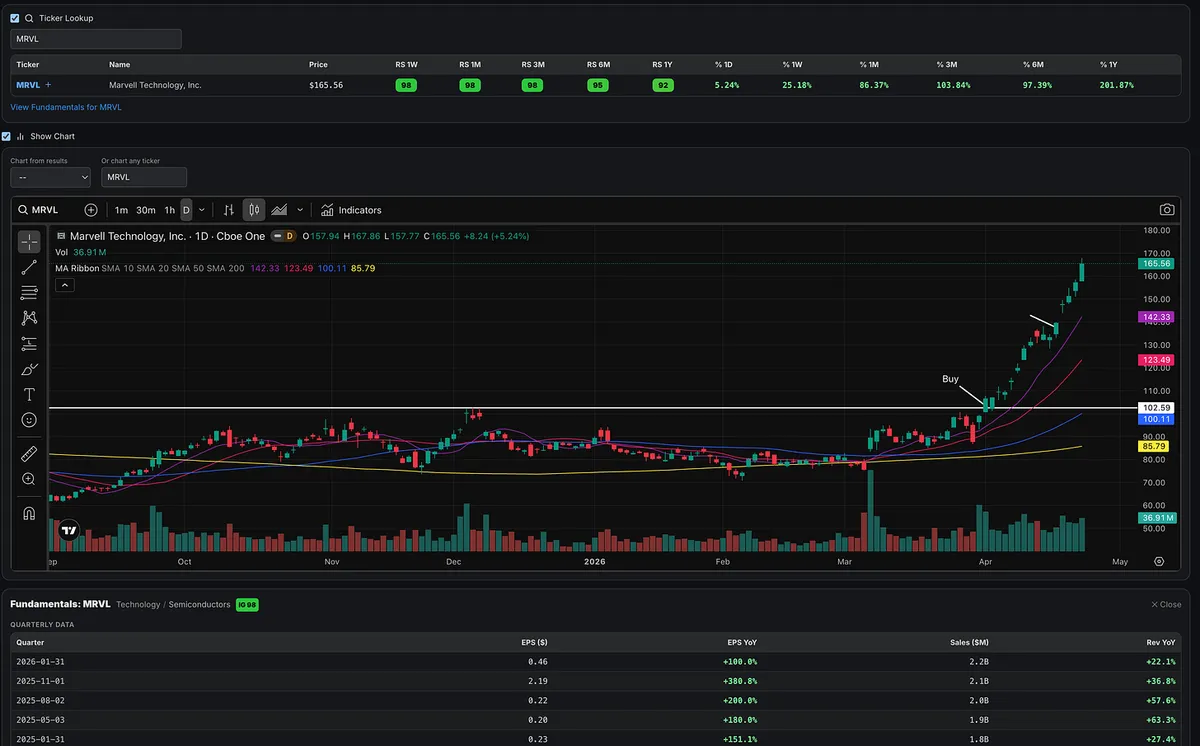
Then you look at Marvell Technology.

Now everything lines up.

  • Relative strength in the highest percentile across timeframes

  • Strong earnings and sales growth

  • High return on equity

  • Strong pre-tax margins

  • Leader inside a top ranked group

This is what alignment looks like.

Not just a good stock.

A strong stock in the right place at the right time.

What most people miss

It is not just about the stock.

It is also about the group.

The takeaway

Focus on:

  • Leading stocks

  • In leading groups

  • With real fundamental strength

You do not need to find the one.

You just need to be positioned where strength is already working.

View on Substack ↗

The AI Trade Isn’t Over. It’s Just Moving Deeper

The theme expands… and so do the leaders.

One of the most important principles in growth investing and momentum trading is simple:

Align yourself with the dominant theme of the market.

This bull market has had a clear driver. AI.

But what matters is not just identifying the theme. It is recognizing how that theme expands over time.

It started where you would expect.

Semiconductors led the way as demand for compute exploded.

Then the theme broadened.

Capital flowed into the software layer, where AI moved from concept to real world application.

After that, the market pushed further down the chain.

From software into infrastructure:

  • Data centers

  • Data storage

  • Networking and telecom

  • Energy infrastructure

Because once demand surged, a new problem showed up.

Supply could not keep up.

And that brings us to what is still in the highest demand today.

Data centers.

The buildout is not slowing down. If anything, the gap between demand and supply is becoming more obvious.

This is all part of the same theme. The need for compute.

What we are seeing now is not a new theme. It is a broadening of the same one.

More capital flowing into the smaller pieces that make the entire system work.

Electronic components. Power systems. The underlying infrastructure that allows these data centers to operate and scale.

There are many sub industries involved in this buildout.

This is just one piece of that puzzle.

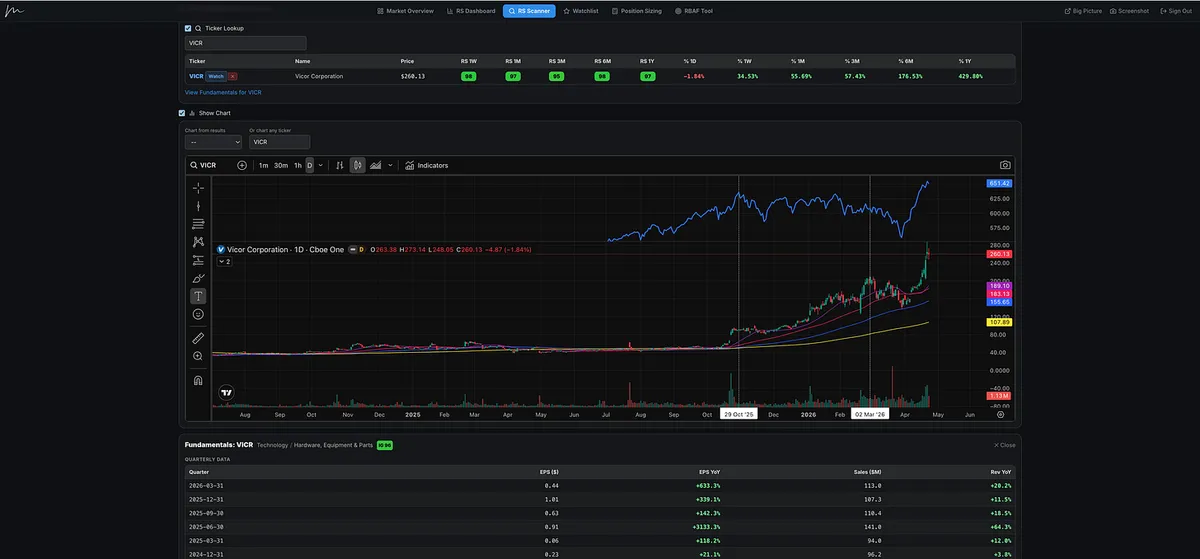
Now look at the chart.

While the market was going sideways from November to December, this stock was moving higher.

As the market drifted lower in January and February, it continued making new highs.

That is not normal behavior.

That is relative strength.

It was not until the broader weakness in early March that it pulled back with the market.

But once the market bottomed around March 30th and started to rally, it did not just bounce.

It accelerated.

Up significantly from those lows.

This is exactly what we look for:

  • Leaders out performing the market

  • They resist weakness during pullbacks

  • And they lead coming out of corrections

That is where institutions are allocating capital.

And when you combine that with:

  • Strong earnings

  • Improving sales

  • Solid margins

  • Good return on equity

  • New demand

  • Strong industry group

  • Alignment with the dominant theme

You get market leaders.

View on Substack ↗

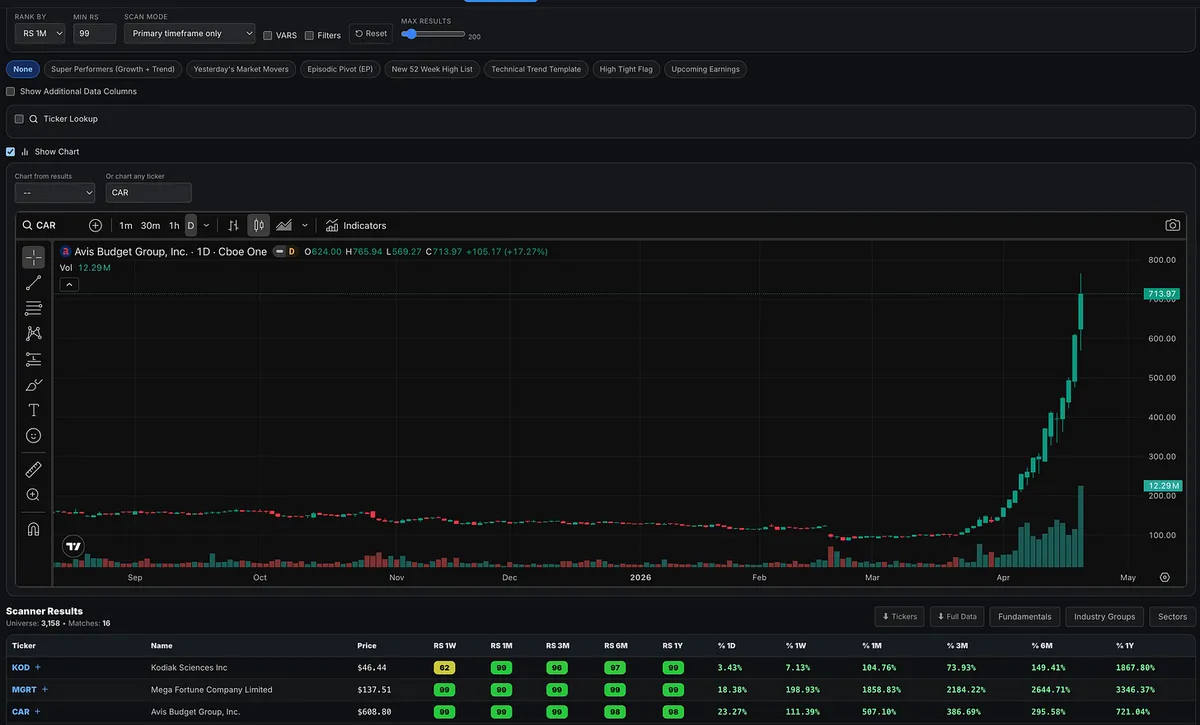
This Is Not A Normal Rally: Inside CAR’s Wild Short Squeeze

What a wild ride.

Since April 1, Avis Budget Group (CAR) has ripped nearly 400% higher, trading more like a speculative momentum name than a traditional rental car business.

This isn’t about a great quarter or a few positive headlines.

This is what happens when positioning collides with supply.

The setup was there.

A large percentage of shares were sold short, while a concentrated group of holders controlled most of the stock.

Once buyers stepped in and price started moving, short sellers were forced to cover.

That covering pushed price higher.

Which forced more covering.

And just like that, a feedback loop formed.

At some point, the narrative flipped.

It stopped being about what the business is worth…

…and became about how far positioning could push it.

Under the surface, the business didn’t change in three weeks.

Avis Budget Group is still operating in the same cyclical, capital-intensive industry, with the same long-term dynamics.

There’s no meaningful growth shift here.

The move was driven by positioning.

From the sidelines, it’s easy to feel like you missed the trade of the year.

But the same mechanics that launch a squeeze…

…can unwind just as fast.

Once shorts are covered and late buyers become the marginal holders, liquidity often disappears on the way down.

What feels like a once-in-a-lifetime move on the way up…

can turn into a sharp lesson in downside volatility.

So how do you actually find these?

Start with what most people ignore:

Float and short interest.

Squeezes are not driven by valuation.

They are driven by supply and positioning.

A simple framework:

Tier 1: Ultra-tight float names

  • Float: 1M to 25M

  • Short interest: 20-30%+

These are your classic small float squeezes.

But CAR didn’t fit that mold.

Its float was closer to 34–35 million shares.

Too big for most “low float” scans.

But the key was how crowded the short side was:

  • ~8–9 million shares sold short

  • Roughly 50–60% of the float

That’s an explosive setup.

Then comes the trigger.

You don’t just buy because short interest is high.

You wait for:

  • A powerful upside move

  • Massive volume expansion

  • A clear shift in behavior

That’s when demand overwhelms supply.

That’s when squeezes start.

CAR checked every box.

And once it started moving…

The feedback loop took over.

For traders, this is the takeaway:

Float.

Short interest.

Watching for that big price and volume surge.

View on Substack ↗

Why Growth Stock Investors Don’t Focus on Cash Flow

I’m going to be very honest with you.

Cash flow is one of the most important metrics in a business.

I know that because I actually run one.

I own a skincare brand with my wife, and the way we operate is very simple.

We focus on:

  • Sales

  • Cost of goods sold

  • Operating expenses

  • Profit

That’s it.

And since we don’t take investor funding, because we don’t want to give up ownership, we accepted something a long time ago:

We are okay with slower growth if it means we keep 100% of our business.

We’ve watched other skincare brands explode in growth, pass us, and then disappear when investors shut them down.

We chose control over speed.

So our model is simple.

Sales minus costs of goods sold minus operating expenses equals profit.

And that profit is what we live on and what we reinvest.

Because we don’t carry much debt, our profit is usually very close to our cash flow.

The only things that really change that are:

  • Loan payments

  • Large one-time investments

If we take on a loan, the monthly payment reduces our cash.

If we open a store or buy something big, that reduces our cash.

But those are decisions we make after the profit is already there.

That’s a completely different model than most high-growth companies.

Now let’s talk about growth stocks.

When you look at growth companies in their early stages, their cash flow often looked terrible.

Not because they were bad businesses.

Because they were aggressively reinvesting.

They were spending ahead of profits.

They were using debt and investor capital to scale as fast as possible.

Investors weren’t focused on today’s cash flow.

They were betting on what those businesses could become years down the road.

That’s the key difference.

As small business owners, cash flow is about survival and control.

As growth investors, it’s about future potential.

Eventually, those companies mature.

Cash flow improves.

That’s when a different type of investor steps in.

People like Warren Buffett start paying attention.

So it’s not that cash flow isn’t important.

It is.

In many cases, it’s everything.

But for the type of trading we’re doing, focusing on high-growth, high-momentum companies early in their lifecycle, it’s simply not the primary metric.

Different game.

Different rules.

View on Substack ↗

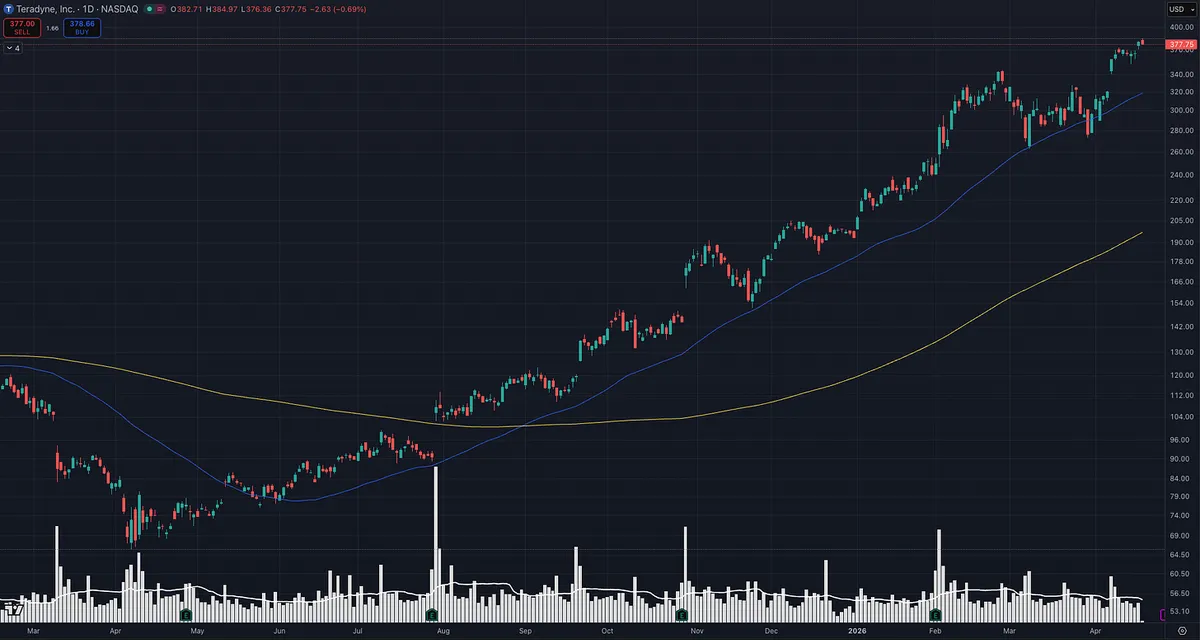
Everyone’s Asking Why I Like TER… You’re Asking the Wrong Question

Somebody asked me why I like TER.

Honestly… what is there not to like?

99 Relative Strength.

89% EPS growth last quarter.

44% sales growth last quarter.

That alone puts it in elite territory.

But it gets better.

Sales are accelerating. Earnings are accelerating. ROE is pushing 20%. Pre-tax margins are above 20%.

This is exactly what real leadership looks like.

Then you look at the chart.

Clean uptrend. Higher highs. Higher lows. No mess. No confusion. Just strength.

And while the market was breaking down?

TER held up well.

That tells you everything you need to know about demand.

This isn’t just a good stock.

It’s part of a powerful theme in a strong industry group and more importantly, it’s a leader within that group.

That’s where the real money is made.

So again… why do I like TER?

Wrong question.

The real question is… why don’t you?

View on Substack ↗

What We Actually Do As Momentum Traders

For those of you that are new, here’s what we actually do.

Momentum Trading Strategy primarily focuses on swing and position trading, mainly in growth stocks, while following the trend.

Our strategy is rooted in principles that have worked for over 100 years.

The foundation comes from traders such as Jesse Livermore, Gerald Loeb, Bernard Baruch, Richard Wyckoff, Nicolas Darvas, William O'Neil, and more modern traders like Mark Minervini, David Ryan, Dan Zanger, Kristjan Kullamägi, along with many U.S. Investing Champions.

Different eras.

Same principles.

So what are we primarily looking for?

When the market is bad, we are preserving capital.

We are mostly in cash.

We are preparing for the next Stage 2 uptrend.

When the market is healthy, we are looking to participate in the strongest industry groups.

This changes cycle to cycle.

More recently, we’ve seen strength in areas like computer data storage with names like SNDK.

Telecom with LITE.

And semiconductors with AAOI.

Within these hot industry groups, we are looking to trade the biggest names and the best leaders.

These tend to have high relative strength (RS), meaning they are outperforming the index and most other stocks in the market.

They also have fuel driving that strength.

That fuel usually comes from:

  • Strong earnings

  • Strong sales

  • Or acceleration in earnings and sales

Also, something that might catch the market off guard.

These stocks are typically making new highs repeatedly.

If you look at the chart, they are consistently forming higher highs and higher lows.

So what we are doing is aligning:

  • The overall bull market theme

  • The hottest industry groups

  • The strongest stocks within those groups

All while looking to enter at points that offer low-risk, high-reward opportunities.

If we are wrong, we lose a small amount.

If we are right, we make multiples of that risk.

3x. 5x. 10x. 15x. 20x.

That’s the entire game.

My goal is to provide you with all the tools necessary to actually do this.

Paid subscribers get access to:

  • A web app with a Relative Strength Stock Screener to find these types of stocks

  • A weekly market newsletter to help you stay aligned with the market

  • A Relative Strength dashboard

  • A watchlist feature and additional risk management tools

  • Shared stock ideas and scans

  • And a full course that breaks all of this down in depth.

All for $120 per year.

That’s only $10 per month.

If that’s too expensive, then frankly, you probably shouldn’t be trading.

View on Substack ↗

How to Spot Institutional Buying Before the Big Move

Most traders try to predict the next big move.

The best traders?

They follow the money.

Dan Zanger said it best:

“I want to go with the institutions when they go… I see massive volume, not just petty volume. If a stock is trading 4 or 5 million shares a day and all of a sudden it’s trading 15 or 20 million…”

That’s the tell.

Not opinions. Not headlines. Not indicators.

Volume.

But not just any volume…

Unusual volume. Massive volume.

Zanger takes it a step further:

He looks for percent change in volume. If a stock normally trades 4M shares and it’s already traded that in the first couple hours… it could finish the day at 12M, 16M or more. That’s a 300%–600% surge.

That doesn’t happen by accident.

Retail doesn’t do that.

Institutions do.

Hundreds of millions of dollars flowing into a name…

That’s what creates real trends.

And when you combine that with:

• Strong earnings and sales growth

• High relative strength

• A stock breaking out or acting right

You don’t just have a stock…

You likely have a market leader.

This is where most traders mess up.

They look for “cheap” setups. They overanalyze indicators. They ignore the one thing that actually matters:

Demand.

Massive demand.

If institutions want it badly…

You want it badly.

If they’re not there…

You shouldn’t be either.

Scan for volume.

Look for 300%+ spikes.

Find the leaders.

Then follow the money.