
Trading articles/Find the Leaders: A Structured Approach to Relative Strength
Apr 24, 2026 · Momentum Trading Strategy
Find the Leaders: A Structured Approach to Relative Strength
Turning a repeatable process into a practical tool through the Relative Strength Stock Screener inside the Momentum Trading Strategy App
Originally published on Substack.
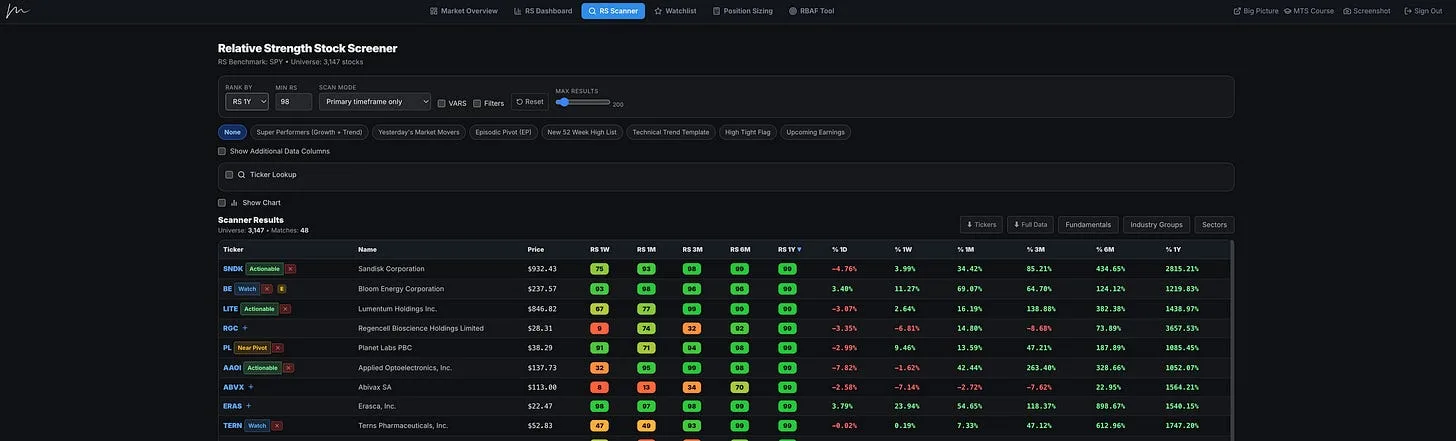
Over time, I found myself returning to the same core question:
How do you consistently identify the strongest stocks in the market?
Not occasionally. Not based on opinion. But through a repeatable process.
After years of using various platforms and approaches, I simplified my workflow down to a few essential principles. From that process, I built a tool to support how I actually analyze the market each week.
This article outlines that process.
Watch the full walkthrough of the tool and process below:
The Starting Point: Relative Strength
Everything begins with relative strength.
At its core, relative strength measures how a stock is performing compared to the broader market, typically the S&P 500.
But that is only the first layer.
It also measures how that stock is performing relative to all other stocks in the market.
This concept is widely used and forms the foundation of many growth-oriented strategies.
The objective is straightforward:
Identify the stocks that are outperforming.
Not just outperforming the market, but outperforming their peers.
Rather than scanning thousands of names without direction, relative strength allows you to immediately narrow your focus to a subset of stocks that are already demonstrating leadership characteristics.
Refining the Universe
Before applying any ranking or filtering, it is important to define the universe of stocks being analyzed.
In my process, I exclude:
- Stocks trading below a minimum price threshold
- Illiquid securities with low average trading volume
- Companies with very small market capitalizations
The goal is to focus only on tradable, institutionally relevant stocks. This step alone removes a significant amount of noise and improves the quality of results.
Ranking Strength Across Timeframes
Once the universe is defined, stocks are ranked based on their relative strength.
While traditional approaches often em
phasize a one-year timeframe, I found it useful to incorporate multiple timeframes, including shorter-term periods such as one month and three months.
This provides two advantages:
- It highlights established leaders over longer periods
- It helps identify emerging strength earlier in the cycle
By adjusting the relative strength threshold, the list of candidates becomes more concentrated and actionable.
Adding the Fundamental Layer
Relative strength alone is not sufficient.
To build conviction, it should be supported by underlying business performance.
For each stock, I evaluate:
- Quarterly and annual earnings growth
- Quarterly and annual sales growth
- Profit margins
- Return on equity
- Institutional ownership trends
This step ensures that price strength is not occurring in isolation, but is supported by improving fundamentals.
For traders who prefer a purely technical approach, the tool can be used with relative strength alone.
However, for growth investors following a CANSLIM-style framework, these fundamental filters provide an additional layer of confirmation and help narrow the focus to higher-quality leaders.
Combining Strength and Structure
After narrowing the list based on relative strength and fundamentals, the next step is to evaluate technical structure.
This includes:
- Price position relative to key moving averages
- Trend alignment
- Consolidation patterns and breakout setups
At this stage, the focus shifts from identifying strong stocks to identifying tradable opportunities within those stocks.
To streamline this process, I developed preset scans that combine these characteristics. For example, a “super performer” screen may include:
- High relative strength
- Strong earnings and sales growth
- Price above key moving averages
- Proper trend alignment
This reduces the list further and highlights only the most compelling candidates.
The Importance of Industry Groups
One of the most overlooked aspects of stock selection is the role of industry groups.
Strong stocks rarely operate in isolation. They tend to emerge within strong groups that are benefiting from broader market themes.
By analyzing industry group performance, it becomes easier to identify where institutional capital is flowing.
This provides important context.
Instead of evaluating a stock independently, it is evaluated as part of a broader ecosystem of strength.
To support this, the tool assigns a relative strength rating to each industry group and displays that group’s strength alongside individual stocks during the screening process.
This allows you to quickly determine whether a strong stock is also supported by a strong group.
Organizing the Process
Once potential candidates are identified, they are organized into a structured workflow:
- Watchlist (stocks of interest)
- Near pivot (approaching actionable levels)
- Actionable (within a defined buy zone)
This creates a clear progression from idea generation to execution.
It also reduces the likelihood of impulsive decision-making, as each stock is evaluated within a defined framework.
Risk Management and Position Sizing
Identifying strong stocks is only part of the process.
Equally important is managing risk.
To support this, I incorporate position sizing tools that account for:
- Account size
- Risk per trade
- Maximum portfolio exposure
This ensures that each position is aligned with an overall risk management strategy, rather than being sized arbitrarily.
Bringing It All Together
The goal of this process is not to create a perfect system.
It is to create a consistent and repeatable framework for identifying and acting on market leadership.
At a high level, the process can be summarized as:
- Identify relative strength
- Confirm with fundamentals
- Evaluate technical structure
- Align with strong industry groups
- Manage risk appropriately
Each step builds on the previous one.
Final Thoughts
There is no shortage of tools, data, or opinions in the market.
The challenge is not access to information.
It is filtering that information into something usable.
By focusing on relative strength and layering in fundamentals, structure, and context, it becomes possible to consistently narrow the field to the stocks that matter most.
From there, execution becomes significantly more straightforward.
More in Software & Tools
All Software & Tools articles →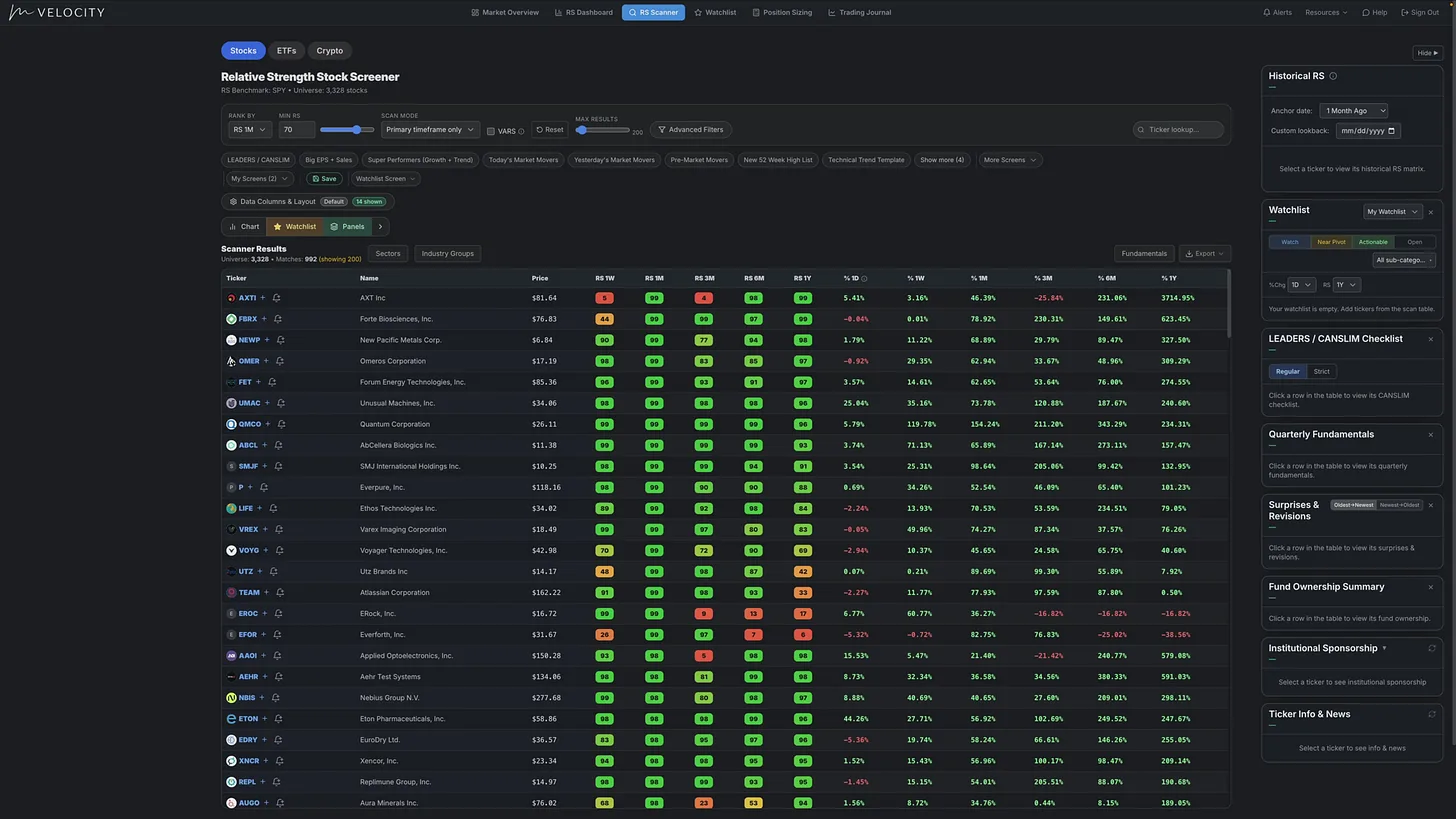
Aug 15, 2026 · Software & Tools
MTS Velocity: How I Find the Market’s Strongest Stocks | Complete Software Tutorial
See how I use Relative Strength, stock screens, charts, watchlists, risk tools, trade planning, journaling, and analytics to find and manage leading stocks.
- Momentum Trading
- CANSLIM
- Growth Stock Trading
- Stock Market
- growth stock investing
- Relative Strength Stock Screener
- Momentum Trading Strategy
- Find Stocks
Jul 3, 2026 · Software & Tools
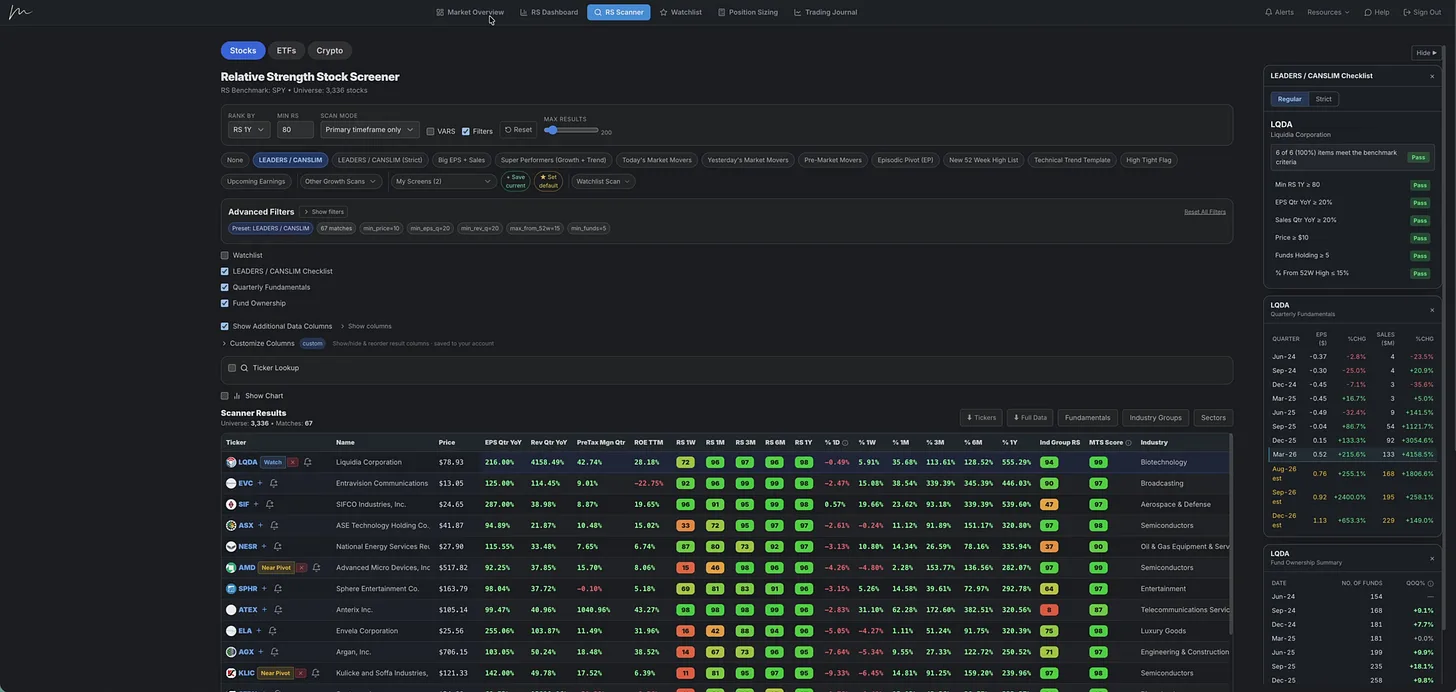
Inside the Momentum Trading Strategy Software: A Full Trading Process in One Platform
See how the platform helps traders read the market, find relative strength, manage risk, and review performance from start to finish.
- Momentum Trading
- CANSLIM
- Trading Journal
- position trading
- Growth Stock Trading
- Stock Scanner
- Relative Strength Stock Screener
- Momentum Trading Strategy

Jun 11, 2026 · Software & Tools
Big Updates Just Dropped Inside the Momentum Trading Strategy Web App
The Relative Strength Stock Screener has come a long way in just a few months.
- find growth stocks
- Investing
- CANSLIM
- Trading
- position trading
- Growth Stock Trading
- Growth Investing
- Scanning for stocks