Momentum Trading Strategy

Notes

Finding Leading Stocks

What to buy: how to find, screen and rank the strongest stocks and industry groups.

Showing 261–280 of 299 notes

View on Substack ↗

Why I Follow Strength And Don’t Fight the Current

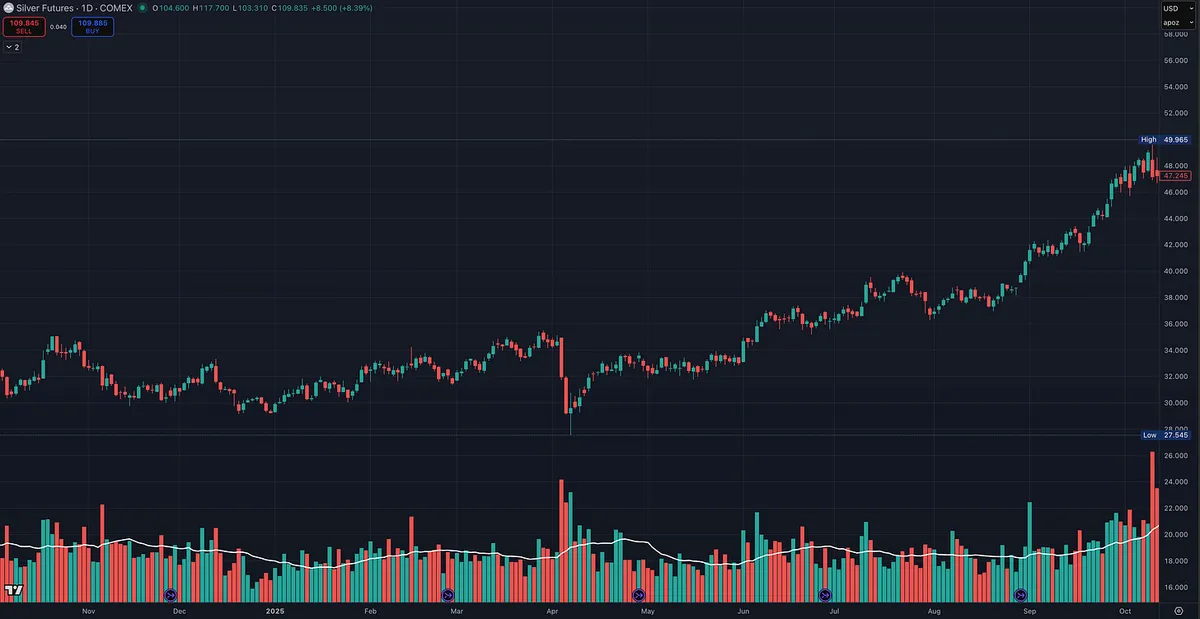
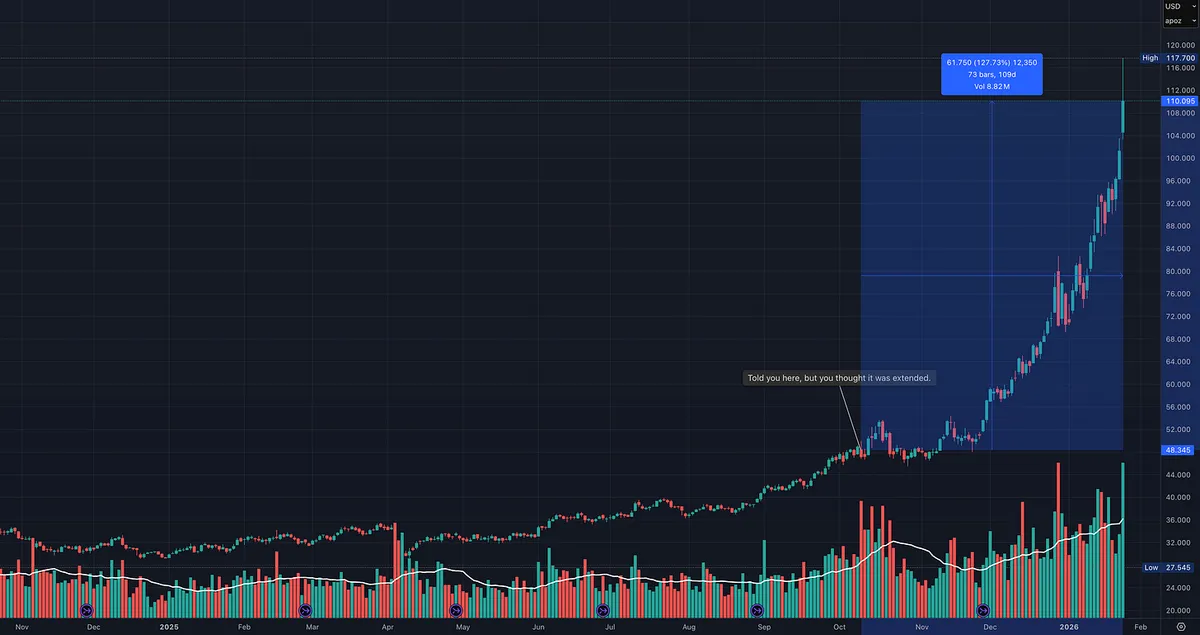
If you look at the charts I’m attaching, the message is pretty clear.

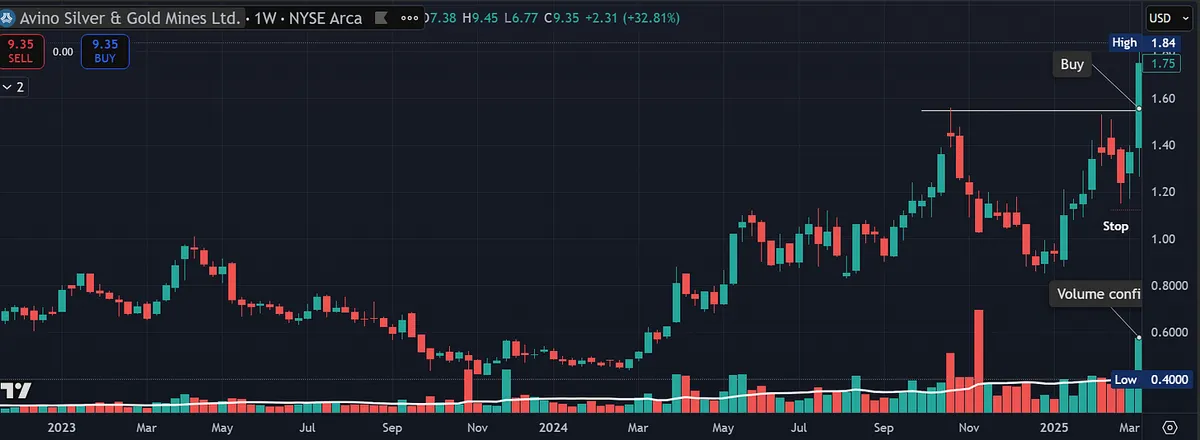
Metals and mining didn’t just work for a day or a week. They’ve been in a sustained uptrend.

I’ve been talking about this area for a while now, and week after week it kept showing up at the top of the Relative Strength Dashboard. The same dashboard all premium subscribers have access to.

Most people ignored it.

Some thought it was “extended.” Others stayed focused on areas they felt more comfortable with. A few kept trying to call the top.

Meanwhile, price kept doing what it always does in strong trends.

This is an important lesson:

All boats rise with the tide.

When a major theme is leading, individual opinions don’t matter much. Capital flows into the space. Breakouts work. Pullbacks get bought.

The goal isn’t to predict where a move should go. The goal is to align yourself with where money is actually flowing.

That doesn’t mean you chase blindly or abandon risk management. It means you stop fighting the strongest trend on the board.

Trying to fade leadership because it feels uncomfortable is one of the easiest ways to underperform.

Strong markets reward alignment, not stubbornness.

Go where the strength is. Respect the trend. Let price lead.

Fighting the current might feel smart in the moment, but going with it is what actually pays.

View on Substack ↗

This Is What a Super Performer Looks Like

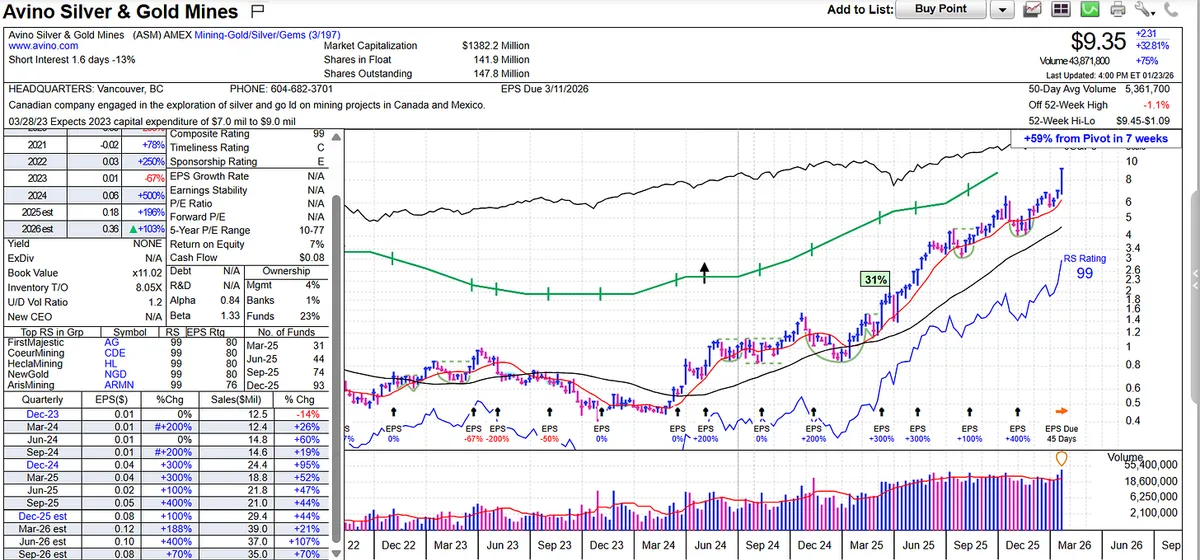
This is the type of stock every growth investor studies.

  • Massive earnings growth.

  • Explosive sales acceleration.

  • Expanding margins.

  • RS 88-90 year ago during setup and now 99, placing it among the strongest stocks in the market.

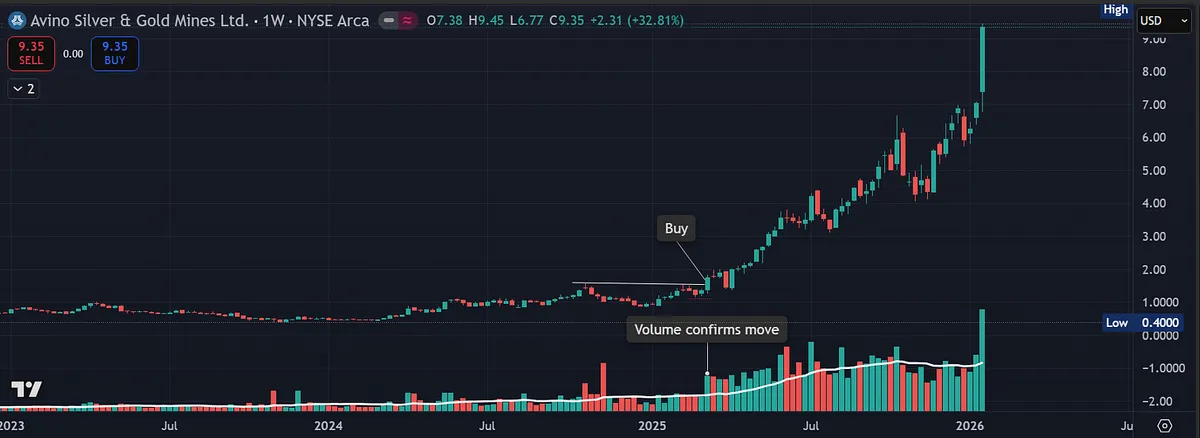
Price action confirms the fundamentals. After a nice base, the stock broke out on heavy volume and has continued to trend higher.

What separates this from most breakouts is context. This is happening inside a hot industry group with accelerating fund ownership.

With all charts attached, I included one that shows what this looked like before the move. Train your eye to recognize that setup in real time. Then compare it to the result. It is a reminder that true leaders often go much further than most expect.

If you want to understand what true leadership looks like structurally, fundamentally, and technically, study this chart.

All charts attached.

View on Substack ↗

Leadership Is Rotating. Your Screener Should Too.

The market has slowed recently, but small- and mid-cap stocks continue to act well. You can see this clearly in the price action, with IWM outperforming both the S&P 500 and the Nasdaq. While the major indexes have struggled to make sustained upside progress, capital has been quietly rotating out of the mega-cap leaders and into smaller names.

This is a normal and healthy part of a market cycle. At some point, every investor has to let go of what worked in the past and focus on where capital is actually flowing today. Leadership does not last forever, and markets reward those willing to adapt.

The Relative Strength Dashboard has been signaling this shift for some time. Strength has been broadening beneath the surface, with smaller stocks and select industry groups steadily moving into leadership while many of the former mega-cap leaders consolidate or lose momentum.

As a result, I’m becoming less interested in crowded mega-cap trades and increasingly focused on areas that are less familiar, less followed, and smaller in size. This is often where new leadership emerges and where the best risk-reward opportunities begin to form.

The good news is that this shift is easy to reflect in your process. A simple adjustment to your screener, such as tightening market cap ranges, float, or shares outstanding, can quickly realign your universe with where the market is allocating capital today.

Markets change. Leadership rotates. Your job is not to predict it, but to recognize it and follow the money.

I have a detailed post coming soon that will walk through the different screens I use to help identify these names.

View on Substack ↗

Why Great Investors Buy at New Highs

In an old interview, William O’Neil talked about the people who had the biggest impact on his thinking.

One name stood out: Jack Dreyfus.

Dreyfus ran an extremely successful fund, and O’Neil had the opportunity to study his actual trades in detail.

What surprised him most?

When he reviewed the fund’s biggest winners, a clear pattern emerged.

The largest gains came from stocks that were purchased as they were breaking out from new highs.

This flies directly in the face of what most investors are taught.

Many people feel uncomfortable buying stocks at new highs or all-time highs. It feels risky. It feels late. It feels like you are chasing.

But O’Neil’s research showed the opposite.

When you are buying the right stocks, in the right market, strong breakouts to new highs are often where the biggest institutional moves begin.

New highs are not a reason to avoid a stock.

They are often the signal that something important is happening.

The market does not reward comfort. It rewards strength.

And historically, the strongest stocks tend to show that strength first… at new highs.

View on Substack ↗

Why Relative Strength Matters

William O’Neil studied the biggest stock winners over decades and found this:

“The 500 best performing stocks during the 1953–1985 period had an average relative strength of 87 before their major price increase actually began.”

Before the breakout. Before the crowd. Before the headlines.

Relative strength is not confirmation after the move. It is evidence of leadership already in place.

The biggest winners almost never come from laggards. They come from stocks already outperforming the market.

Relative strength does not tell you when to buy. It tells you where to look.

Leaders lead for a reason.

View on Substack ↗

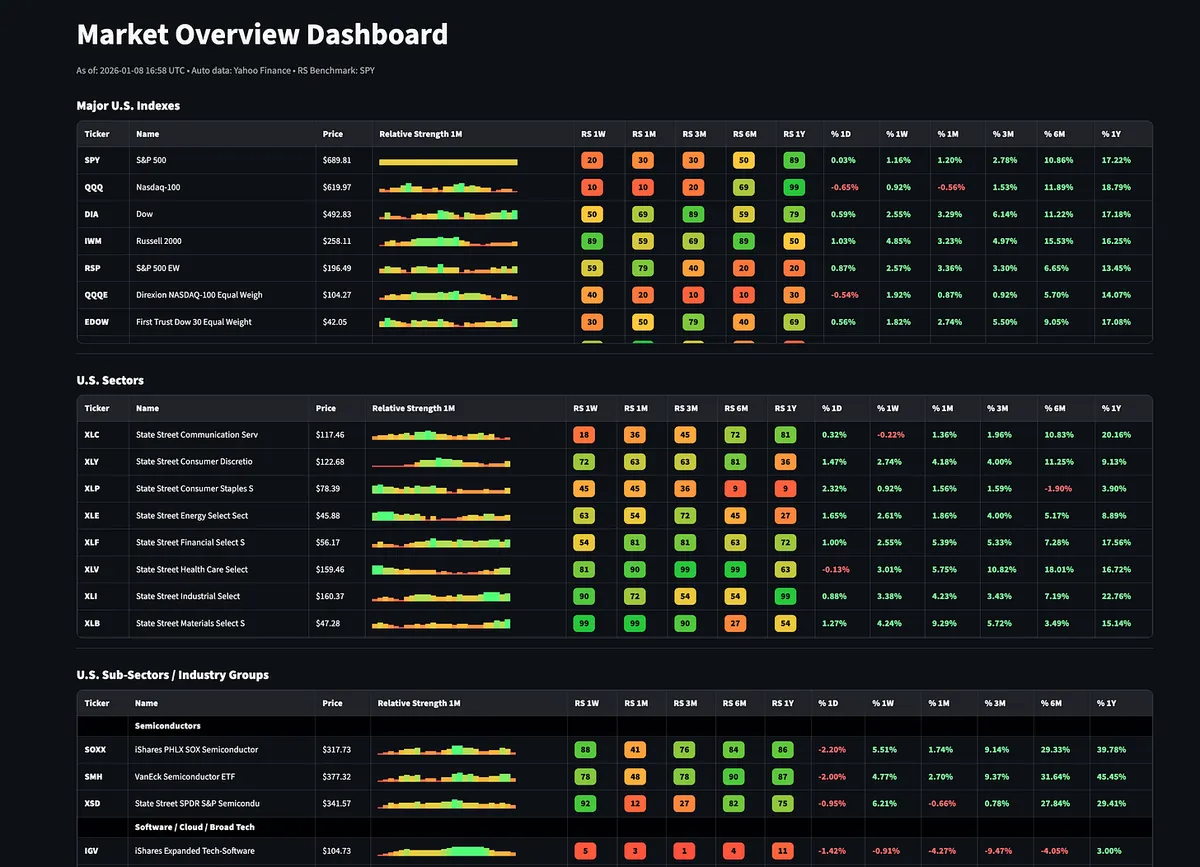
Most traders don’t struggle because they can’t find stocks. They struggle because they’re looking in the wrong places.

I built a Relative Strength Dashboard to fix that.

It’s a top-down snapshot of the market that starts with major U.S. indexes and works down through sectors, industry groups, global markets, commodities, bonds, and large-cap stocks.

The goal is to quickly see where strength is building, where it’s fading, and what areas of the market are actually in play.

Unlike most tools that only show one timeframe, this dashboard lets you view relative strength across:

  • 1 week

  • 1 month

  • 3 months

  • 6 months

  • 1 year

That makes it much easier to separate:

  • Real leadership

  • Acceleration vs deceleration

  • Short-term noise vs sustained trends

Think of it as a market radar, not a replacement for your scans.

Once you know where strength is developing, you can build smarter watchlists and focus your energy where it actually matters.

Access the Relative Strength Dashboard (paid subscribers):https://tradingmomentum.substack.com/p/relative-strength-dashboard

On SubstackRelative Strength Dashboard
View on Substack ↗

Great question and a very real challenge.

This is exactly why I always come back to the full CANSLIM framework, not price action alone.

To filter out meme stocks, I start with the fundamentals.

• Strong and accelerating earnings, sales, and margins

• A real catalyst, such as a new product, service, or structural shift in the business

• Alignment with a leading industry group or market theme

• Rising institutional sponsorship, quarter over quarter

All of this data is readily available on tools like MarketSurge and will usually eliminate pure meme stocks very quickly.

Where it gets tricky is with small and mid-cap leaders, because they can look similar to meme stocks in the early stages. These names are naturally more volatile and often move fast when institutions begin building positions.

That is where risk management and position sizing matter.

Relative strength on its own can absolutely capture meme stocks. That is why RS should never be used in isolation. When you combine relative strength with CANSLIM fundamentals, you dramatically reduce false positives and improve the odds that you are participating in a real institutional move, not a temporary crowd driven spike.

Price tells you when to act.

Fundamentals tell you what is worth acting on.

That combination is what separates leaders from noise.

ArticleThe Best Trades Put You in the Money Immediately and Never Look Back
View on Substack ↗

Why Stock Screens Find Candidates but Charts Find Winners

One of the biggest mistakes traders make with stock screening is treating it like a final answer instead of a starting point.

Screens are powerful.

They narrow the universe.

They save time.

They force discipline.

Every great trader uses them.

But screens alone do not make you money.

Mark Minervini talks extensively about screening for strength, earnings, sales, and leadership. What often gets missed is what comes next. Screening is only the first filter, not the decision.

Even today, with AI, algorithms, and real time data, nothing replaces visually screening stocks yourself.

Charts reveal things screens cannot:

- Tight price action

- Volatility contraction

- Subtle accumulation

- Clean support behavior

- Where risk is actually defined

Screens are binary. Charts are contextual.

Another common mistake is taking screening criteria too far.

Make your rules too strict and you eliminate future leaders before they ever have a chance to appear. Many great stocks do not look perfect yet. They evolve into leaders.

A stock may meet 9 out of 10 requirements and still become a major winner, but you will never see it if your filters demand perfection. That is why separating scans matters.

Run one scan for relative strength.

Run one for earnings and sales.

Run one for price action.

Sometime you will see the same names on multiple scans, which can be a powerful signal.

Looser screens do not lower standards. They allow you to spot leaders earlier, before the crowd.

Make your rules too loose and you drown in noise.

The goal is balance.

Use screens to find potential.

Use charts to confirm behavior.

Use judgment to decide timing and risk.

This approach is not new. Minervini did not invent it. He refined it by studying the same greats who came before him.

This is why trading is both an art and a science. There is no perfect formula I can give you, but this may help you recognize whether your screening is too strict or not strict enough.

View on Substack ↗

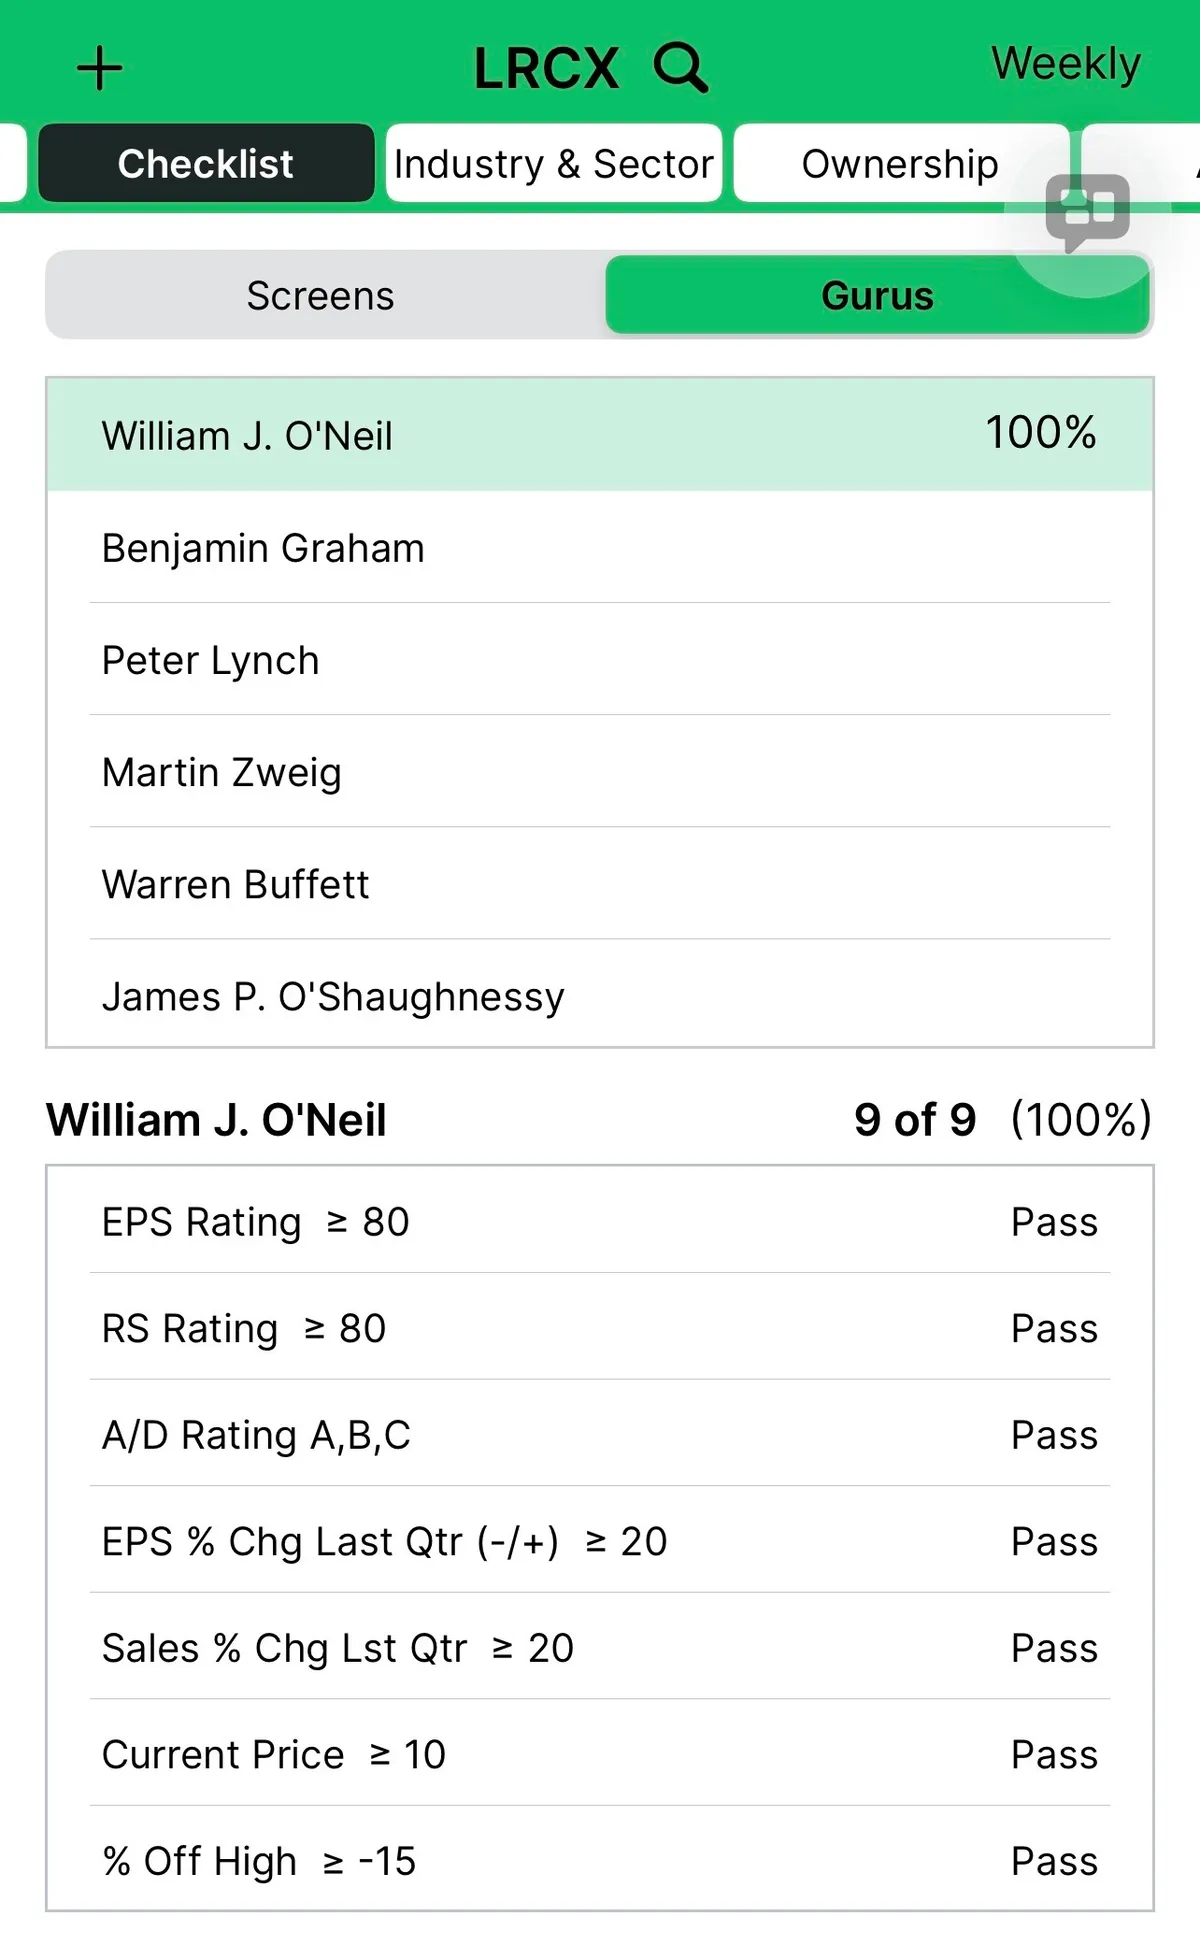
LRCX: A Textbook CANSLIM Leader With Ideal Price and Volume Action

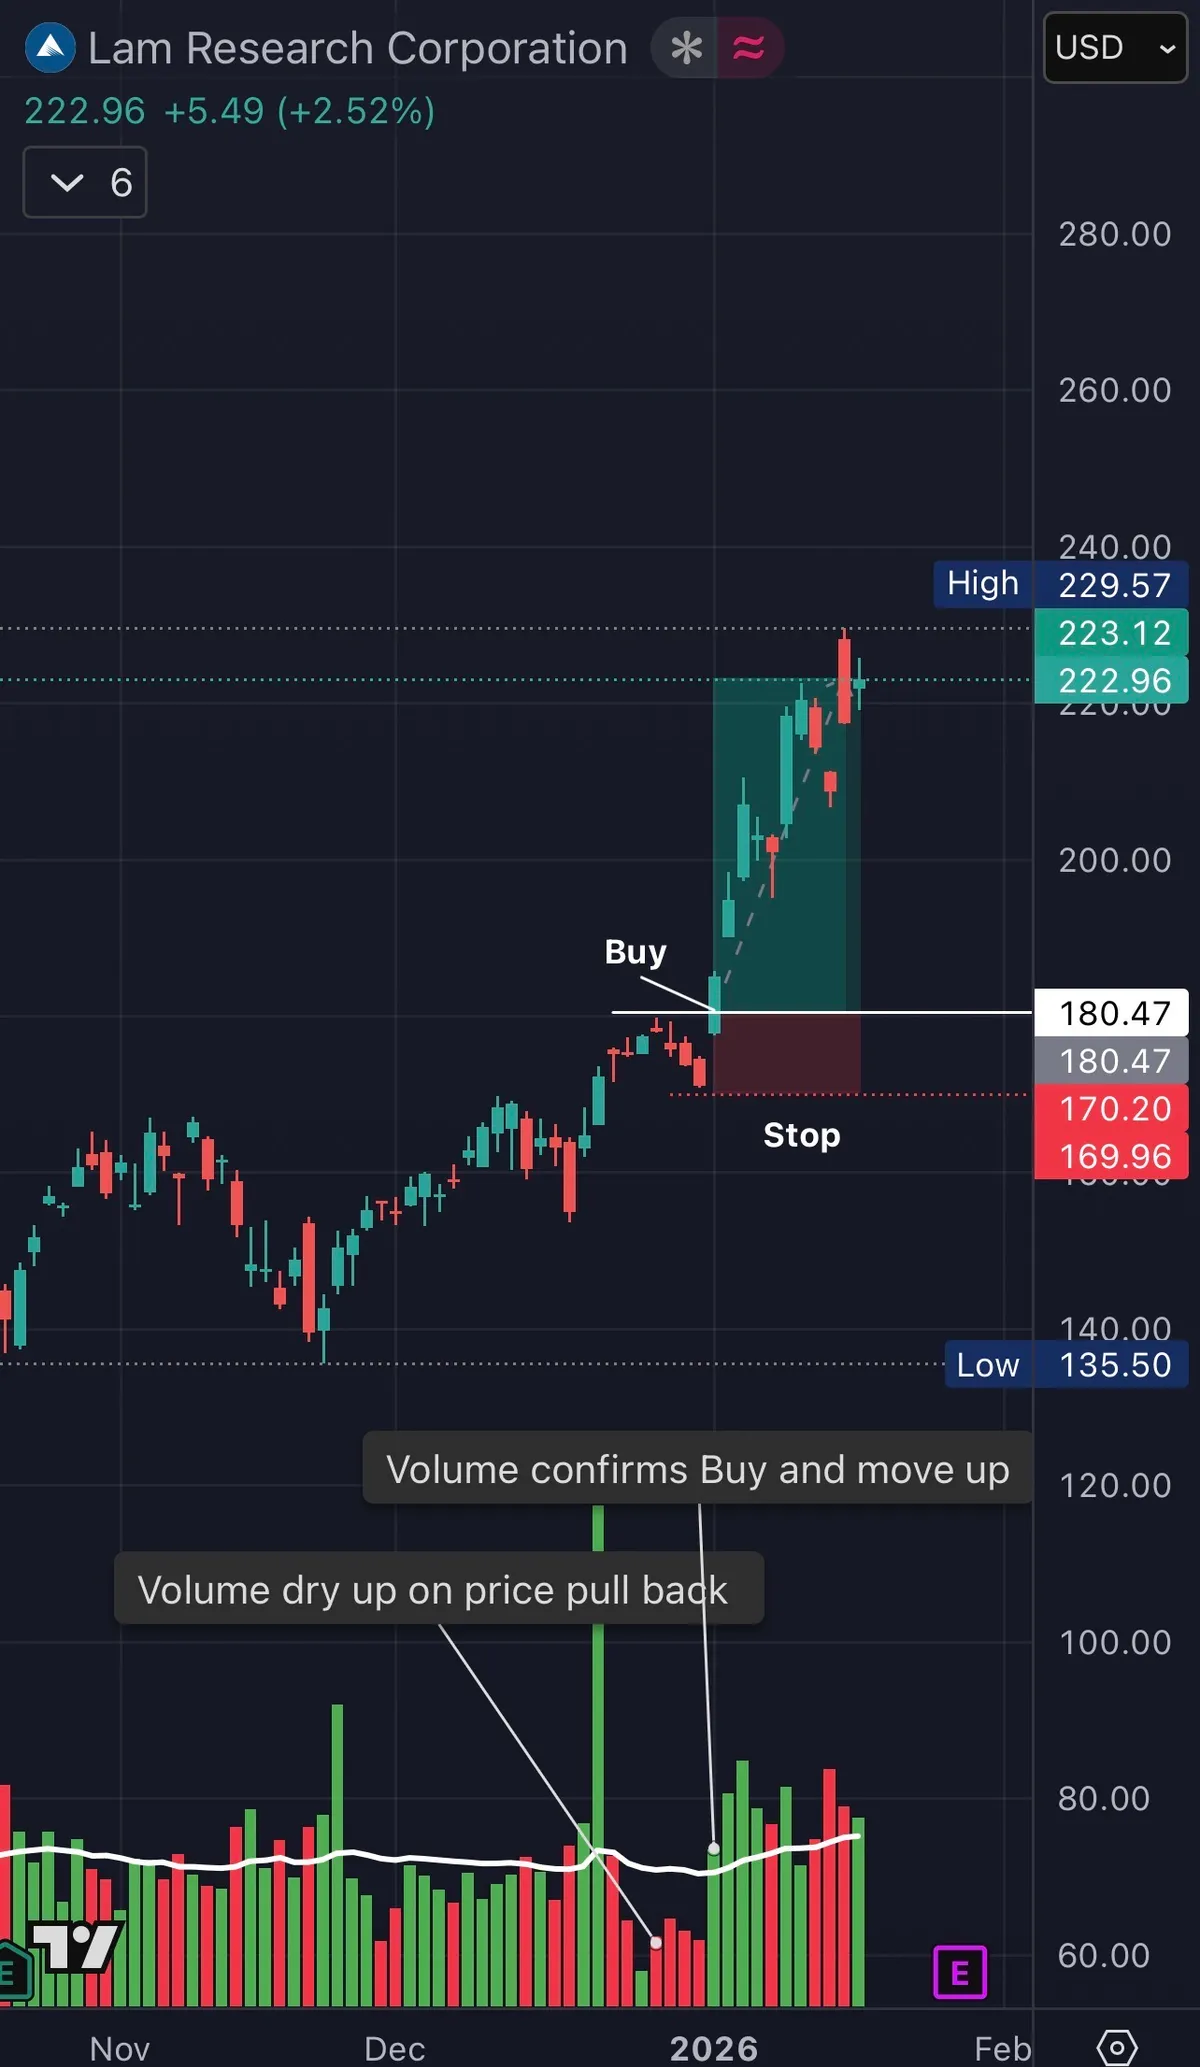
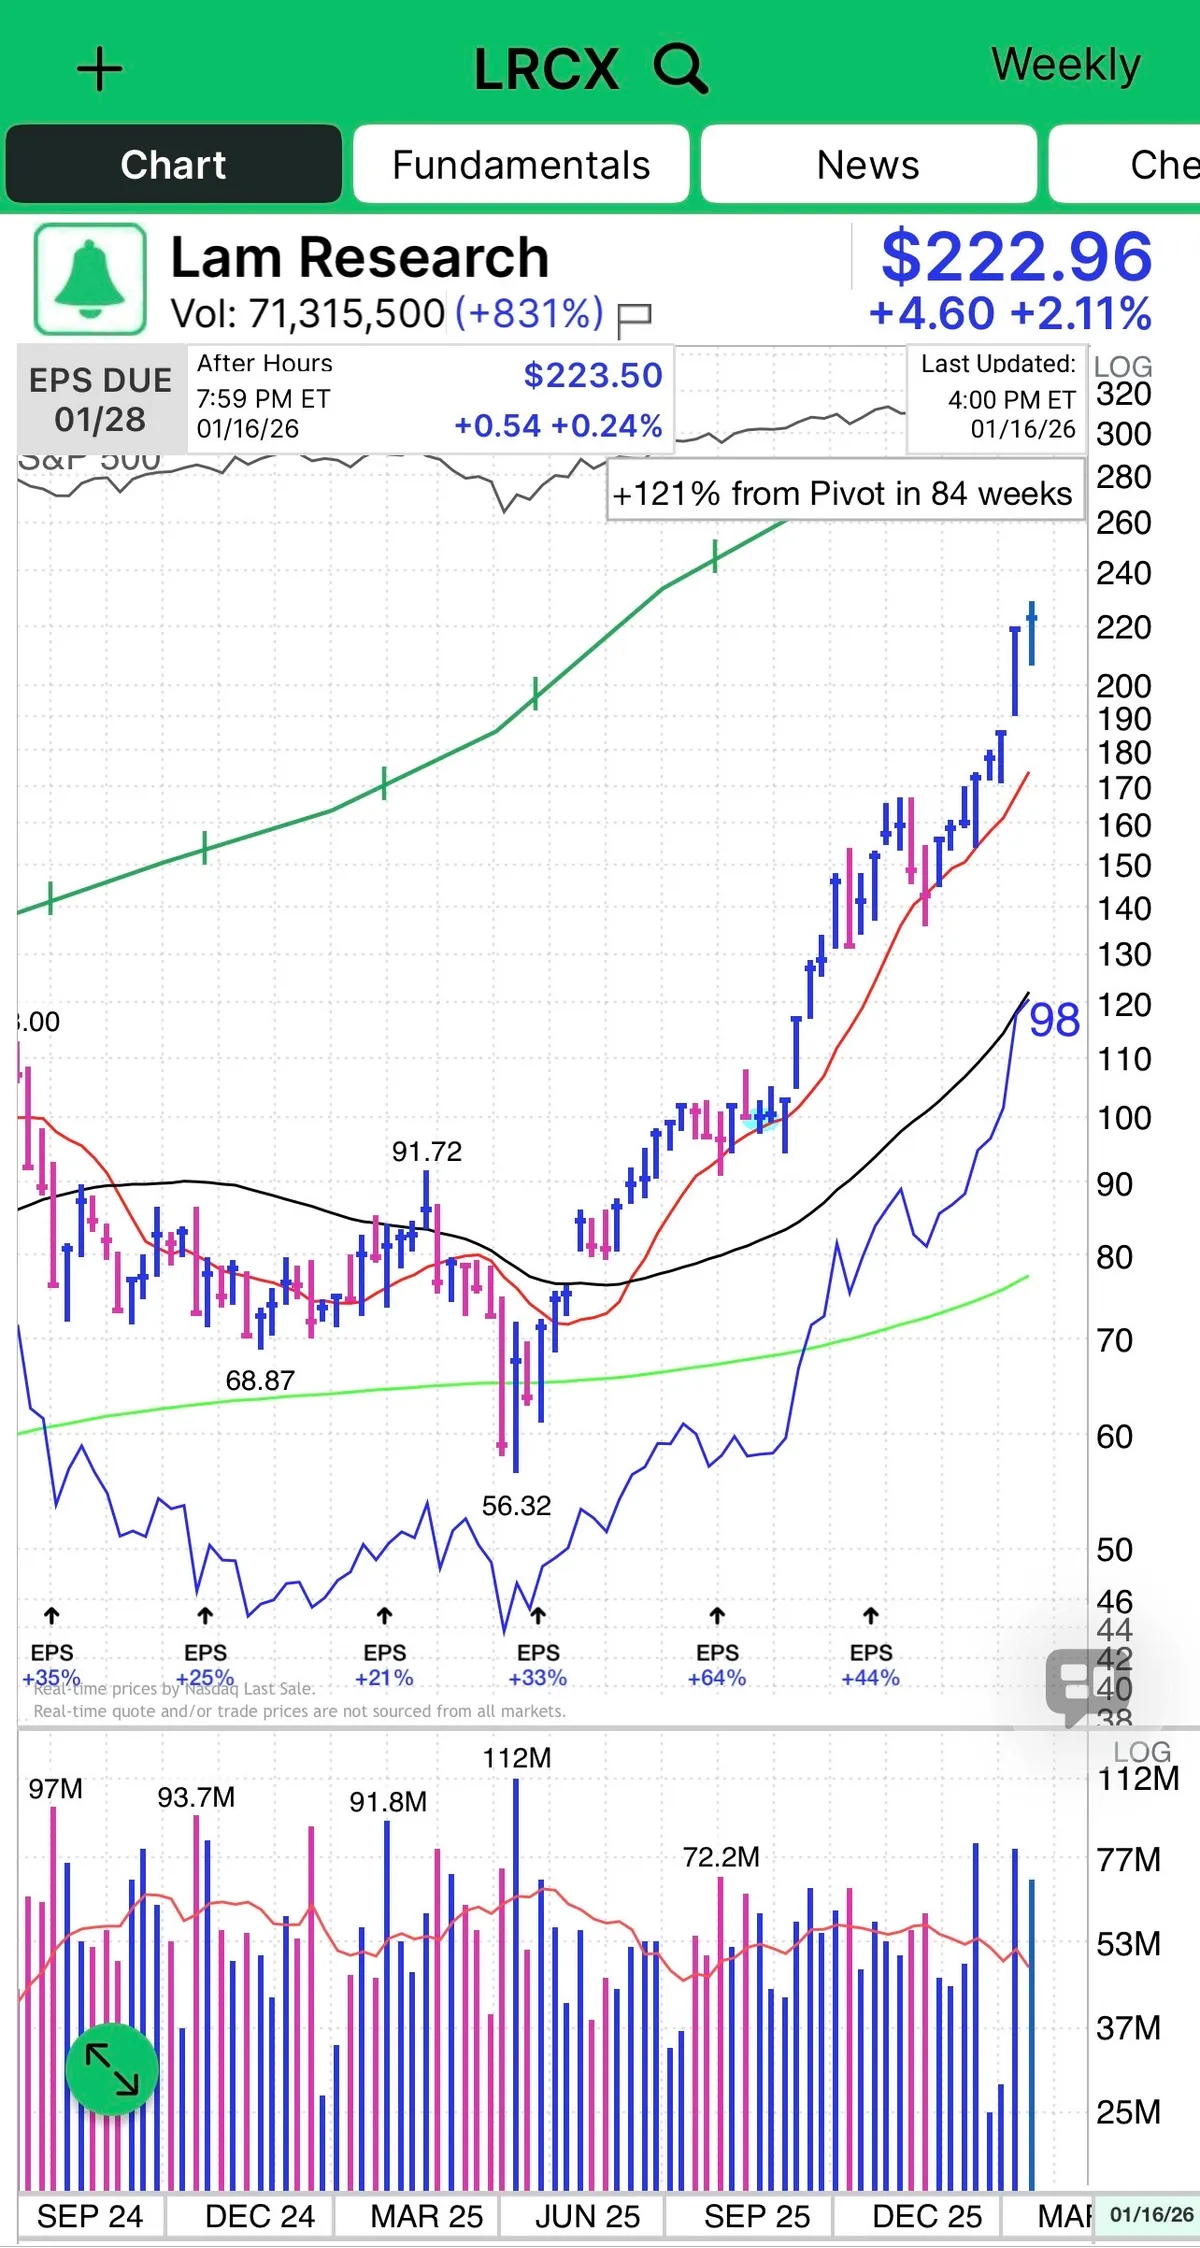
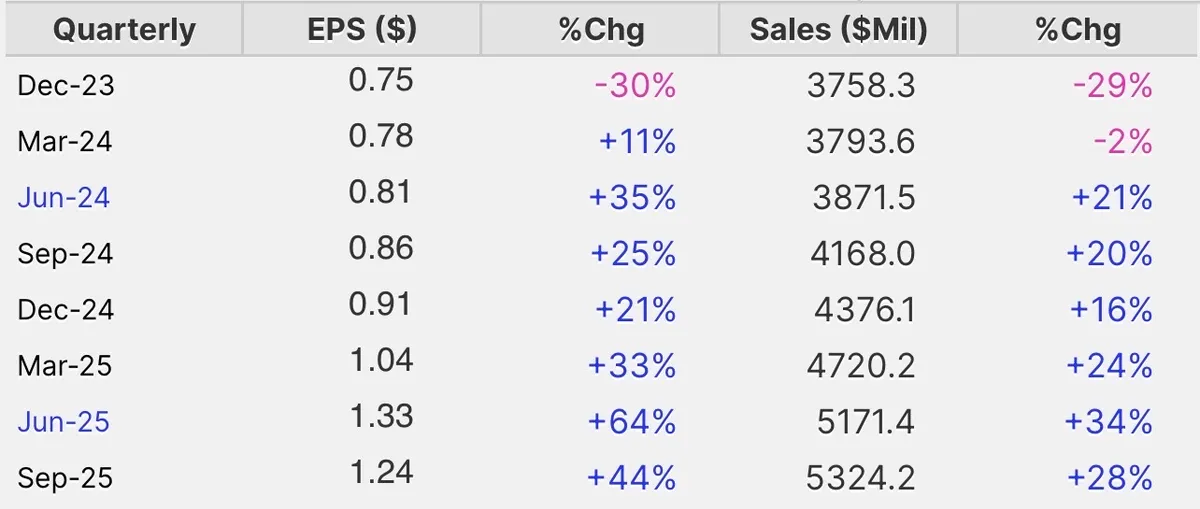
Lam Research is a textbook CANSLIM name and a clean example of how price and volume tell the story before headlines do.

This is what leadership looks like.

  • Strong earnings and sales growth.

  • High ROE.

  • RS in the upper 90s.

  • Institutional sponsorship building.

  • Industry group strength tied directly to the AI Theme.

But the real tell is the volume price relationship.

You get volume drying up on pullback.

You get volume confirmation on the breakout.

Strong chart on the weekly and daily timeframe.

That combination is not random. That is professional accumulation.

This is how winners behave:

  • Demand shows up when price moves up

  • Supply disappears when price pulls back

  • Relative strength expands before most traders notice

Semiconductor equipment is one of the engines behind this bull cycle, and LRCX sits right in the middle of the AI buildout. When a stock checks every CANSLIM box and then confirms it with clean volume behavior, you pay attention.

This is not prediction.

This is recognition.

Price action is bullish with higher highs and higher lows. Volume is an indicator and confirms the move. Fundamentals support.

That is how real leaders are identified.

View on Substack ↗

If Your Watchlist Is Too Big, You Are Not Being Strict Enough

I received a great question recently about how to slim down a watchlist that has grown too large.

First, having too many names is not a bad problem. In fact, it often signals a healthy market. Especially now, when leadership is broader and no longer limited to just a handful of mega-cap stocks like earlier in the bull cycle.

The challenge is not finding ideas. The challenge is filtering them.

For me, the answer is simple. Get stricter with CANSLIM.

Tightening your criteria will usually shrink your watchlist down to just a few names, and that is a good thing. Nothing works 100 percent of the time, but I have found that the probabilities improve as your standards move closer to the characteristics of the biggest market winners in history.

Fifty percent earnings growth is better than twenty five percent. Surging volume is better than average volume. Accelerating institutional demand is better than slow or stagnant ownership.

In How to Make Money in Stocks, William O’Neil goes deep into each letter of CAN SLIM and clearly separates what the greatest winners actually had from what was merely acceptable.

A large watchlist means the market is healthy. A refined watchlist means you are focused.

The goal is not to find stocks that qualify. The goal is to find stocks that stand out.

Do you have a scanner that helps you do that? I use MarketSurge, and I also build my own custom scanners in TradingView to aggressively filter for the highest-quality setups.

This is a reminder to revisit the chapters that go in depth on each letter of CAN SLIM. You may realize you have been overlooking powerful filters O’Neil discussed, such as the relationship between sales and earnings, along with the importance of healthy margins and strong return on equity.

View on Substack ↗

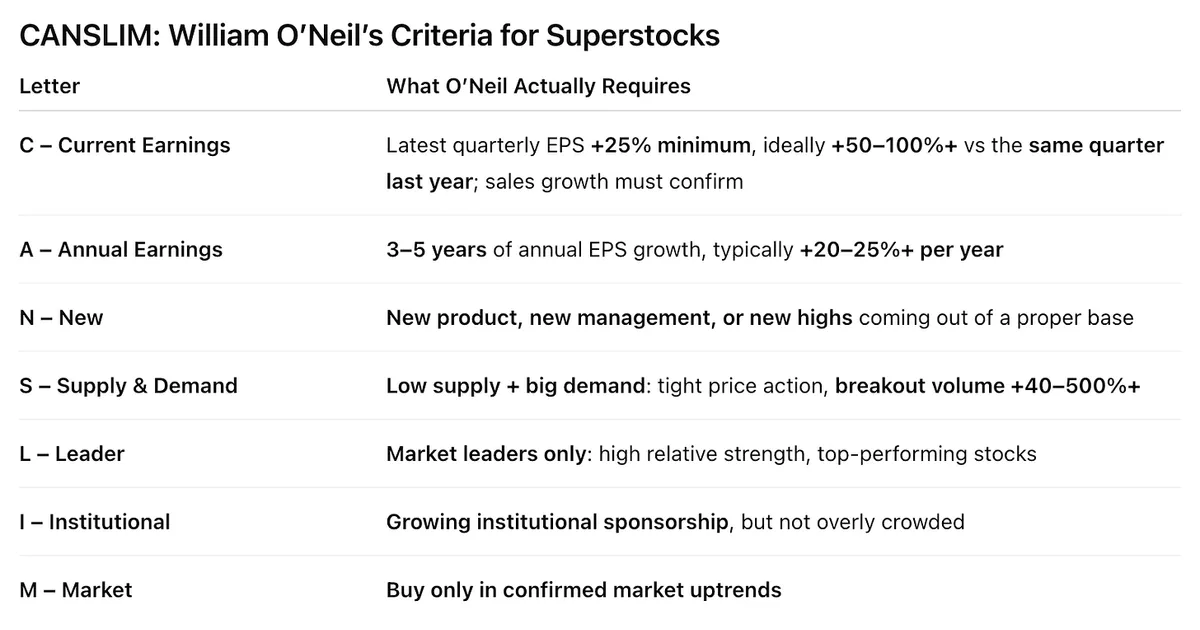
CANSLIM: William O’Neil’s Criteria for Superstocks

If you have been struggling trading stocks, maybe it is time to get back to the basics. Here is a time-tested framework that has worked for over a hundred years.

This is the original system from How to Make Money in Stocks and the exact set of rules behind many of the greatest stock market winners in history.

Below is the screen and checklist O’Neil used to identify superstocks before they made their biggest moves.

This chart summarizes O’Neil’s true CANSLIM criteria: earnings growth, leadership, institutional demand, and market conditions that repeatedly showed up in history’s biggest winners. Many of us drift over time and develop our own tweaks, but sometimes the best move is to return to what actually works. And honestly, it never hurts to reread How to Make Money in Stocks.

View on Substack ↗

Why Multi-Timeframe Relative Strength Matters

Great question came in today about how I weight relative strength versus price structure across timeframes.

Yes, a stock can show strong relative strength on a daily or weekly basis while violating support on higher timeframes. That happens often.

But here is what I consistently find.

Stocks and sectors with high relative strength across multiple timeframes perform better and with higher probability than names showing strength only in the short or long term.

For example, Metals and Mining was one of the strongest themes last year. On my RS dashboard, it showed high relative strength on the 1-year, 6-month, 3-month, 1-month, and 1-week timeframes. That kind of alignment is what sustained leadership looks like.

Throughout the year, I also saw many groups spike in short-term relative strength. Some would lead for a week or a month, then quickly fade. Those moves can be useful for very short-term traders, but they rarely define durable trends.

My bias, for both short and longer-term trades, is toward names that show high relative strength across multiple timeframes. That is where probabilities improve. If a stock is weak in the short term but strong on the intermediate and long term, I often view that as a pullback rather than a breakdown, and I wait for price to turn back up for entry.

In other words, short-term relative strength can highlight opportunity. Multi-timeframe relative strength identifies real leadership.

Example 1

Sustained Leadership

This is what I saw in Metals and Mining. High relative strength across all timeframes for most of the year. That consistency is what made it a higher-probability theme than sectors showing only brief strength.

Example 2

Short-Term Strength, Weak Structure

Here you can see XHE performing well on the weekly and 3-month windows, but weak across the 1-month, 6-month, and 1-year timeframes. These can offer tactical trades, but they rarely become lasting leaders.

Example 3

Dead Money

UNG was low across all relative strength timeframes. Bottom fishers fought this all year while leadership stayed elsewhere.

Example 4

Emerging Leadership

This is where it gets interesting. Relative strength begins improving first on the shortest timeframes (see AMZN), then gradually works its way into the longer windows. That is often how new leadership starts to form before the crowd sees it.

Example 5

Decelerating Strength and Leadership Loss

This is what fading leadership looks like.

Relative strength stays high on longer timeframes, but weakens first on the short-term windows. Weekly rolls over. Then monthly. Eventually the longer periods follow (see CVS).

Price may still look “fine,” but performance is already deteriorating beneath the surface.

That is often the first signal of slowing institutional demand and a coming rotation away from former leaders.

Leadership does not disappear all at once. It fades.

Recognizing that early is how you protect capital and stay aligned with what is emerging next.

View on Substack ↗

Great question. You’re absolutely right that a stock can show strong relative strength on lower timeframes while violating support on higher timeframes. That happens often.

What I consistently find is that stocks with high relative strength across multiple timeframes perform far better and with higher probability than names that only show short-term strength.

For example, Metals and Mining was the leading sector last year. When you look at relative strength across timeframes, it was strong on the 1-year, 6-month, 3-month, 1-month, and 1-week windows. That type of alignment is what sustained leadership looks like.

Throughout the year, I also saw many groups and stocks spike in short-term relative strength. Some would lead for a week or a month, then quickly fade. Those moves can be useful for very short-term traders, but they rarely define durable trends.

My bias, for both short and longer-term trades, is toward names that show high relative strength across multiple timeframes. That is where probabilities improve. If a stock is weak on the short term but strong on the intermediate and long term, I often view that as a pullback rather than a breakdown, and I wait for price to start turning back up for entry.

In other words, short-term relative strength can highlight opportunity, but multi-timeframe relative strength is what identifies real leadership.

View on Substack ↗

“In our research, we found there was a very low correlation between the P/E ratio and the best-performing stocks.” -William O’Neil

Cheap stocks are not automatically winners.

Low P/E does not mean high returns.

And many of the biggest leaders looked “expensive” before their best moves.

What actually matters?

Strength.

Demand.

Institutional accumulation.

Leadership.

The market does not reward what looks cheap. It rewards what is being aggressively bought.

That is why the best stocks often trade at higher multiples. Not because they are overvalued. Because they are being accumulated before the crowd understands why.

If you are still screening only for low P/E, you are filtering out tomorrow’s leaders.

If you are a momentum trader or growth investor searching for high-performing stocks, P/E has little value in your scans.

View on Substack ↗

“Three out of four stocks will move in the same direction as the market.” William O’Neil

You already know this is true.

Most stocks rise and fall with the indexes. Even great companies struggle when the market is weak.

But here is the edge.

The stocks that do not break when the market does are often becoming the next leaders.

They hold up during corrections. They break out while the market is still consolidating. And in bear markets, a few even make new highs while indexes make new lows.

That behavior is not random. It is relative strength and institutional accumulation.

I just published a breakdown with real chart examples showing how to spot leadership early.

Read it here 👇

https://tradingmomentum.substack.com/p/why-most-stocks-follow-the-market

ArticleWhy Most Stocks Follow the Market and How to Spot the Next Leaders Early
View on Substack ↗

Why Relative Strength Comes Before Every Big Winner

The most misunderstood edge in my entire process

Do you want to find leaders early?

Do you want to stop chasing late moves?

Do you want to stack probability in your favor?

Then this matters.

Many traders see a stock with high relative strength and think, “Well, it already ran. I missed it.”

No! That belief is backwards.

Relative strength is not the result of a move. It is often the signal that a move is coming.

The best performing stocks show leadership before the crowd ever notices.

William O’Neil studied this extensively and found:

“The 500 best performing stocks during the 1953 to 1985 period had an average relative strength of 87 before their major price increase actually began.”

Read that again.

Before the big move. Not after.

That means relative strength is not a late indicator. It is a filter for future leaders.

High relative strength tells you where institutions are already positioning. It shows where demand is quietly building. It narrows your focus to stocks that are outperforming the market while most names are not.

This is why relative strength sits at the core of my process.

I am not looking for what already exploded. I am looking for what is quietly leading while the market is still undecided.

Relative strength does not guarantee a winner, but it dramatically improves the odds that when a real move begins, you are already watching the right names.

You do not need more indicators. You need better selection. Start with HIGH Relative Strength.

View on Substack ↗

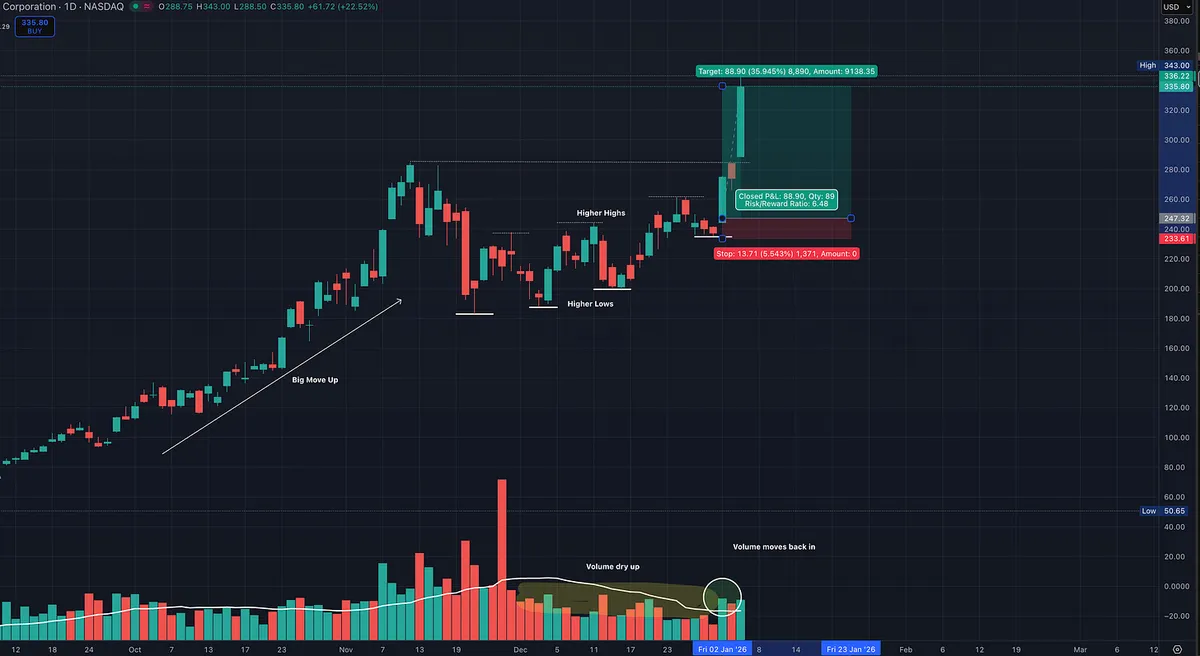
This Is What Institutional Accumulation Looks Like

Here is a great example of a true leader digesting a major advance. Volume dries up as price tightens, forming higher lows and higher highs. Selling pressure fades while the structure strengthens.

As volume begins to move back in, demand returns ahead of the next powerful move higher.

SNDK also shows increasing fund ownership, confirming institutional accumulation. With a 99 Relative Strength rating, this is exactly the type of behavior you want to see in big winners before the next leg.

View on Substack ↗

The One Line That Changed How I See the Market

There is a line in Market Wizards that completely reshaped how I think about stocks.

William O’Neil studied the investors who were consistently making real money. Not one or two lucky trades, but sustained, repeatable success. He went back and examined the actual stocks these investors were buying and laid them all out in front of him.

Then he noticed something that surprised him.

Not some.

Not most.

Every single stock had been bought when it was making a new high.

That realization changed everything.

These were not cheap stocks.

They were not beaten down.

They were not “value plays” waiting to be discovered.

They were already moving higher.

The biggest winners were showing strength before the crowd believed in them. They were being accumulated while most people were still waiting for a pullback that never came.

This completely flipped the traditional way of thinking.

Instead of asking, “How low can this go?”

The better question became, “Is this stock proving itself right now?”

That insight became the foundation of what later evolved into CAN SLIM and the idea that price itself contains information. Not opinion. Not forecasts. Not stories. Actual demand.

The market speaks through price.

And when a stock pushes into new highs, it is not a warning sign.

It is evidence.

Evidence that institutions are stepping in.

Evidence that supply is being absorbed.

Evidence that something important is happening beneath the surface.

The hardest part is psychological. Buying strength feels uncomfortable. It feels late. It feels wrong. But history shows that the biggest winners rarely look cheap at the moment that matters most.

That lesson hasn’t changed.

The market still rewards strength.