Momentum Trading Strategy

Notes

Finding Leading Stocks

What to buy: how to find, screen and rank the strongest stocks and industry groups.

Showing 241–260 of 299 notes

View on Substack ↗

Why Earnings Acceleration Shows Up Before the Biggest Stock Winners

“More than 90 percent of the biggest stock market winners showed some form of earnings acceleration before or during their huge price moves.” - Mark Minervini

This is not a coincidence.

When a stock makes a truly meaningful advance, something fundamental is usually changing beneath the surface. Earnings acceleration is one of the clearest signs of that change.

Not just earnings growth. Acceleration.

It tells you the business is improving at a faster rate than before. Demand is strengthening. Margins are stabilizing or expanding. Prior expectations no longer fit the reality.

And the market cares far more about that shift than about a single quarter beating estimates.

This is why focusing only on headline earnings beats often misses the bigger picture. A stock can beat and still go nowhere if growth is slowing or expectations are already high.

What matters is when the numbers start turning higher in a meaningful way and the market begins to discount a different future.

That is often when institutions start building positions.

In the chart shown here, you can see earnings acceleration, followed by a period of deceleration, and then a powerful reacceleration. That reacceleration is what fueled this stock just as much as the impressive earnings and sales growth.

That is why earnings acceleration plays such a critical role in growth investing. It is not about predicting the future. It is about recognizing when the future is starting to change.

And more often than not, the biggest winners give you that signal before the largest price moves ever begin.
View on Substack ↗

Why Analyst Estimate Increases Are an Important Earnings Signal

Earnings beats matter.

Strong earnings growth, acceleration, and surprises are still the foundation of most major stock leaders. But there is another signal around earnings that traders often overlook.

Analyst estimate increases.

Earnings estimates are typically conservative by design. Analysts are not rewarded for bold projections. They are rewarded for staying close to consensus and avoiding being wrong.

If most analysts are estimating between $10.00 and $14.00 per share and the consensus sits around $12.00, who wants to be the one projecting $17.50?

Even if the company reports strong results, that aggressive estimate could make earnings look like a disappointment. The stock gets hit. The analyst looks careless. There is no upside to taking that risk.

So analysts cluster together.

They stay conservative. They stay within a narrow range. That allows companies to beat estimates without anyone sticking their neck out.

This is why many earnings beats fail to produce sustained upside. A modest beat is often expected and already priced in.

Where estimate increases become important is when something changes.

Analysts resist raising numbers. They do not do it casually. When estimates start moving higher across the board, it often signals improving demand, expanding margins, or accelerating growth that can no longer be ignored.

The old numbers stop working.

That does not replace the importance of earnings beats. It adds context.

The most powerful situations often involve both. Strong earnings results followed by upward estimate revisions.

Those are the moments when expectations are forced higher.

And that is often where leadership begins to emerge.

View on Substack ↗

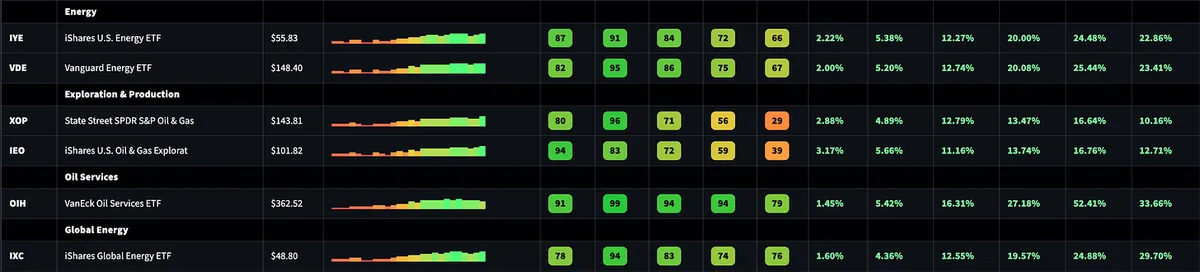
Energy. This Is the Place to Be.

While the broader market chops and pulls back, leadership is rotating, and energy continues to stand out.

Relative strength is strong across multiple energy ETFs and sub-groups, and this isn’t just a one-week move. We’re seeing consistent 1, 3, and 6 month relative strength.

View on Substack ↗

Rotation Example

When the market is down, stalling, or consolidating like this, leadership often shifts instead of disappearing.

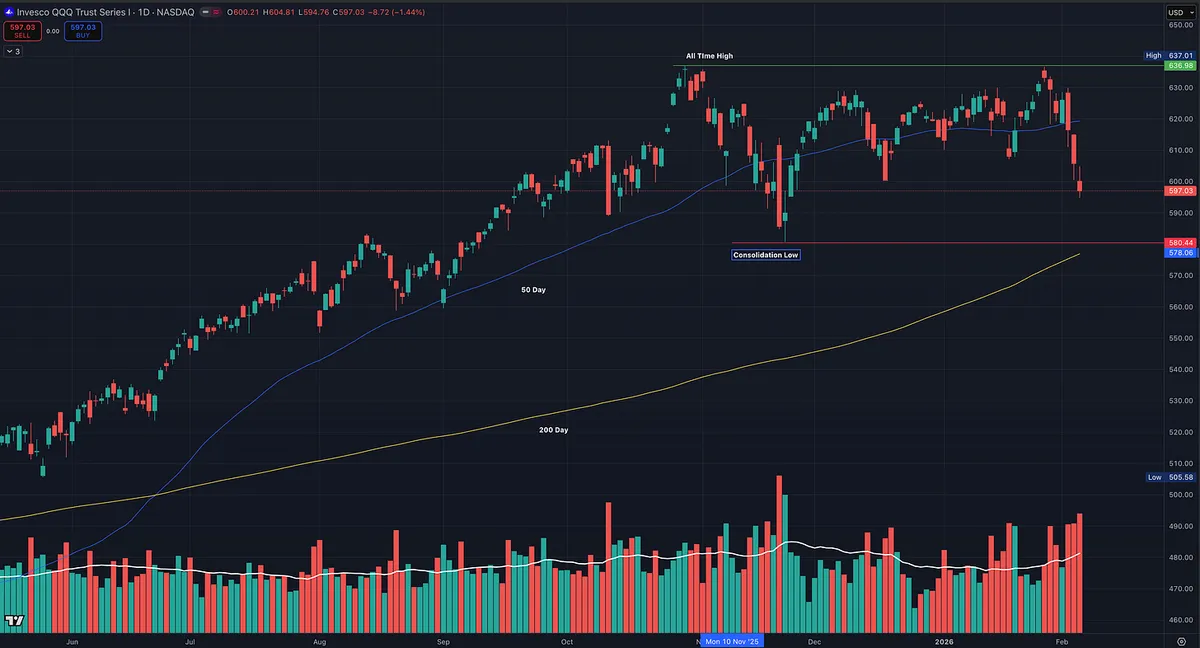
QQQ looks heavy here and is pulling back within a broader consolidation. In environments like this, money tends to rotate out of higher-beta growth and into more defensive areas.

That’s why consumer staples often show relative strength during periods like this. As risk appetite narrows, capital looks for stability, not necessarily cash.

This is typical rotation, and the relative strength dashboard reflects it, with 3-month RS improving for consumer staples right around the start of the consolidation.

View on Substack ↗

Hello Banks. Big Week.

Banks are quietly having a very strong week, and more importantly, they’re showing real relative strength last 3 months.

When I look at my industry group dashboard, this isn’t just one ETF popping. It’s broad confirmation:

  • KBE, KRE, IAT all showing strong 1W and 3M relative strength

  • Momentum is improving, not deteriorating

  • This is what early rotation and leadership expansion looks like

A Stock Example: PLBC

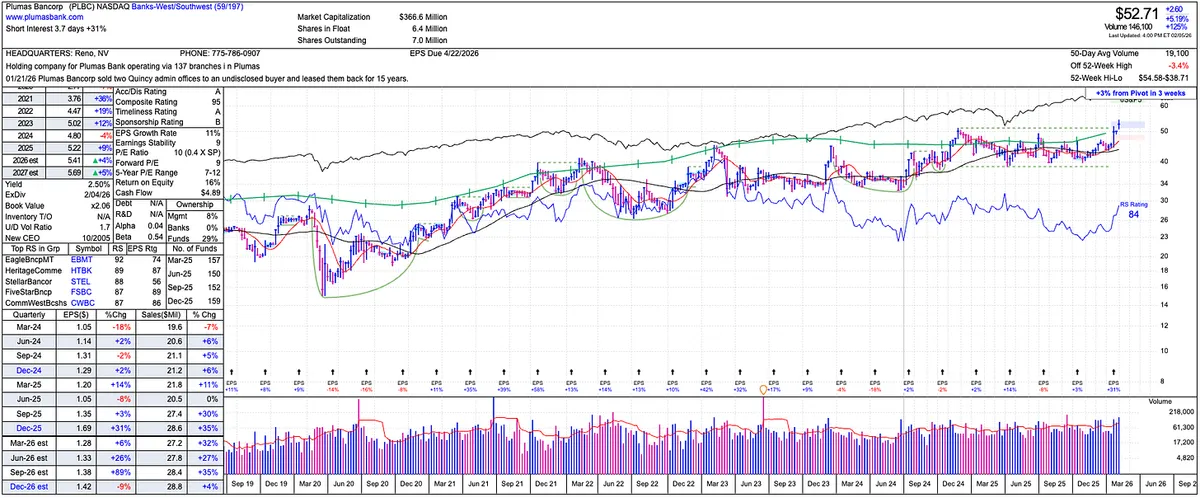
Plumas Bancorp (PLBC) is a good example of how this plays out at the stock level.

  • Small-cap regional bank

  • Strong composite and RS ratings

  • Breakout from consolidation on good earnings

  • Recently pushed to new highs while the group strengthens

  • RS line confirming the move

View on Substack ↗

The One Stock Filter Behind Almost Every Big Winner

“From the early 1950s through 2008, the average RS Rating of the best performing stocks before their major run ups was 87. In other words, the best stocks were already doing better than nearly nine out of ten others when they were starting out on their most explosive advance yet.” — William O’Neil

👉 Read the full post here: https://tradingmomentum.substack.com/p/why-relative-strength-is-the-fastest

ArticleWhy Relative Strength Is the Fastest Way to Find Big Winning Stocks
View on Substack ↗

Most traders don’t struggle because they can’t find setups.

They struggle because they spend their time studying stocks that were never leaders to begin with.

In the new post, I break down what relative strength actually means, why it has nothing to do with RSI overbought or oversold indicators, and why nearly every big winning stock in history was already outperforming the market before the move started.

I also walk through my top down, bottom up process, how I use relative strength dashboards and stock scans to narrow thousands of stocks into a short watchlist, and how I track acceleration and deceleration to spot emerging leaders and avoid late stage names.

It’s the exact framework and screener I use each week to stay aligned with market leadership.

If you want to improve the quality of stocks you focus on and stop wasting time on laggards, this post will help.

👉 Read the full post here (paid subscribers):https://tradingmomentum.substack.com/p/why-relative-strength-is-the-fastest

ArticleWhy Relative Strength Is the Fastest Way to Find Big Winning Stocks
View on Substack ↗

The One Stock Filter Behind Almost Every Big Winner

One of the most important insights William O’Neil ever shared is this:

“From the early 1950s through 2008, the average RS Rating of the best performing stocks before their major run ups was 87. In other words, the best stocks were already doing better than nearly nine out of ten others when they were starting out on their most explosive advance yet.”

That single statistic explains why relative strength matters so much.

In the new post, I break down what true relative strength actually is, why it has nothing to do with RSI, and how I use it to identify leaders early, track acceleration and deceleration, and build high quality watchlists.

👉 Read the full breakdown here: https://tradingmomentum.substack.com/p/why-relative-strength-is-the-fastest

ArticleWhy Relative Strength Is the Fastest Way to Find Big Winning Stocks
View on Substack ↗

Just Like Stocks Follow the Market, They Follow Their Industry Group

When an industry group breaks down, it tends to drag everything with it, just like when the market breaks down.

When the market takes a hit, most stocks go with it, the same thing happens at the industry group level.

When an industry group gets hit hard, it usually brings down even the best names.

This is something a lot of traders underestimate.

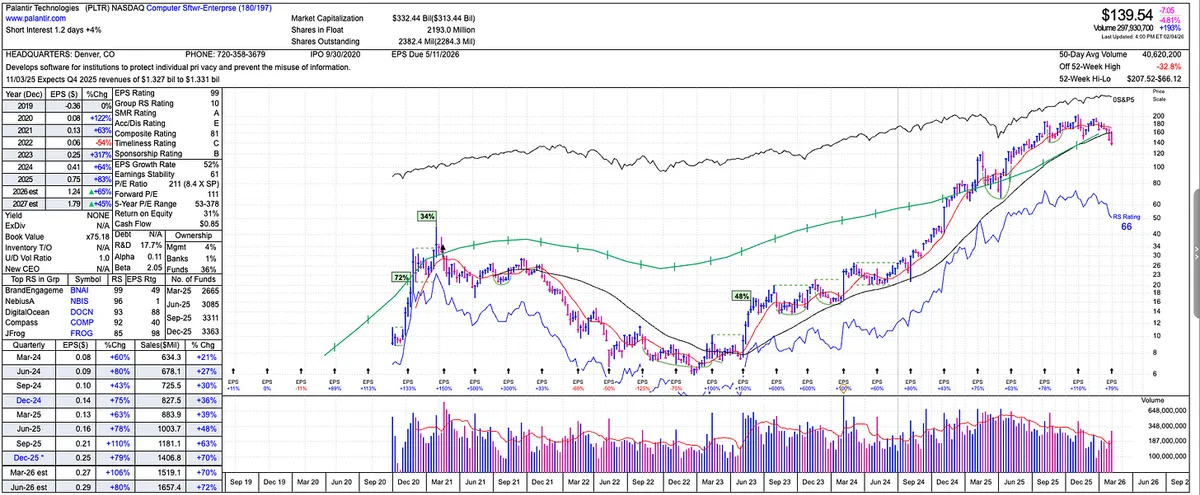
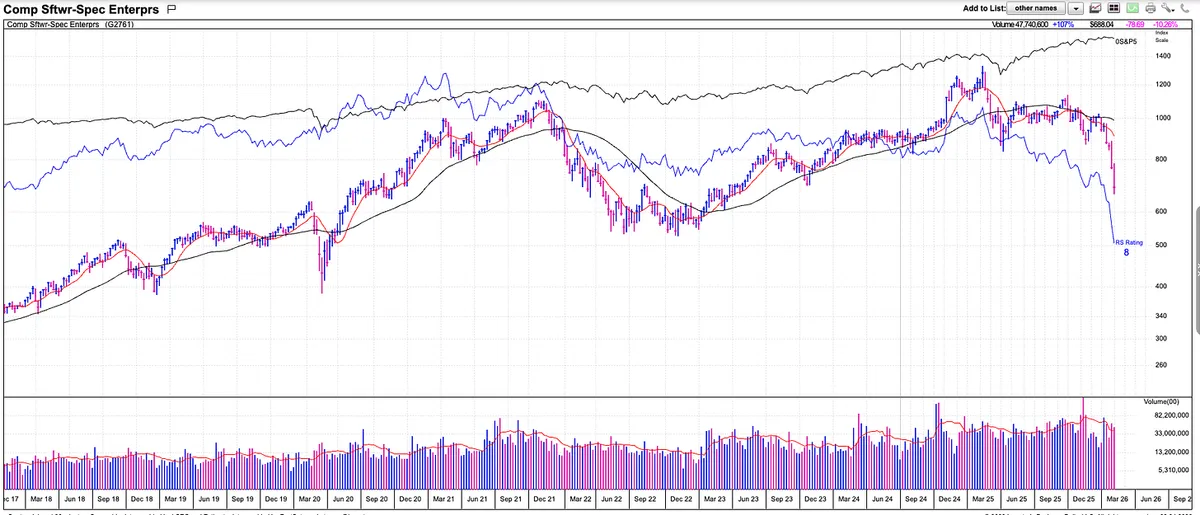
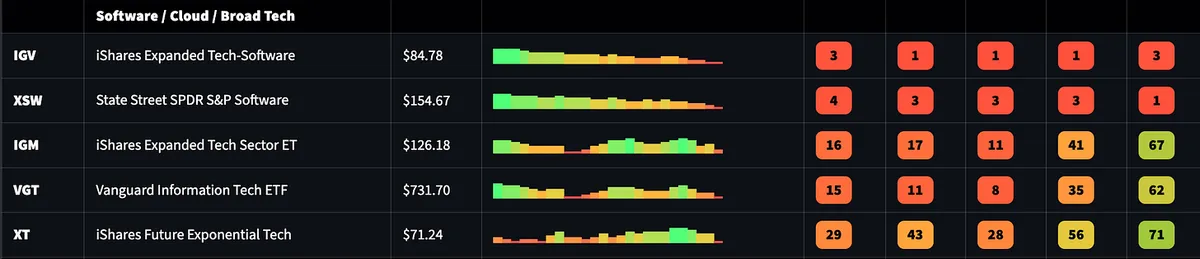
A perfect example right now is PLTR and the broader computer software group.

PLTR is a high quality company with strong fundamentals and long term potential. It was an amazing stock to be in during the uptrend, but once the software group started to lose relative strength and roll over, PLTR followed. Sometimes its the big name stock that brings down the industry group and sometimes its the group bringing down the stock. Regardless, you should know this relationship.

View on Substack ↗

Bottom-Up, Top-Down Analysis to Spot New Leading Industry Groups

Stocks Speak First. Industry Groups Confirm.

One of the most overlooked things in the market is understanding bottom up, top down industry group analysis.

Just like individual stocks tend to lead the indexes, industry groups tend to reveal themselves through individual stock action before it is obvious on any dashboard or scan.

In a bull market, you will often see stocks starting to act right before the indexes fully turn higher. Strong price action shows up first at the stock level.

The same thing happens on the downside.

During market breakdowns, stocks start to roll over before the indexes do. You see failed breakouts, loss of trend, and relative weakness in individual names well before the damage becomes obvious in the averages.

Industry group leadership works the same way.

When I am scanning, I often notice multiple stocks from the same industry group setting up at the same time. Strong trends. High relative strength. Tight consolidations. Clean pullbacks.

At that point, I am not even thinking about the industry group ranking yet.

The stock action comes first.

Later, when you look at a relative strength dashboard or run an industry level scan, that same group suddenly shows up as a leader.

This is why I spend so much time scanning individual stocks.

If you pay attention to what stocks are doing underneath the surface, you see leadership forming in real time.

View on Substack ↗

PLTR Is a Great Company. Right Now It Is Not a Great Stock.

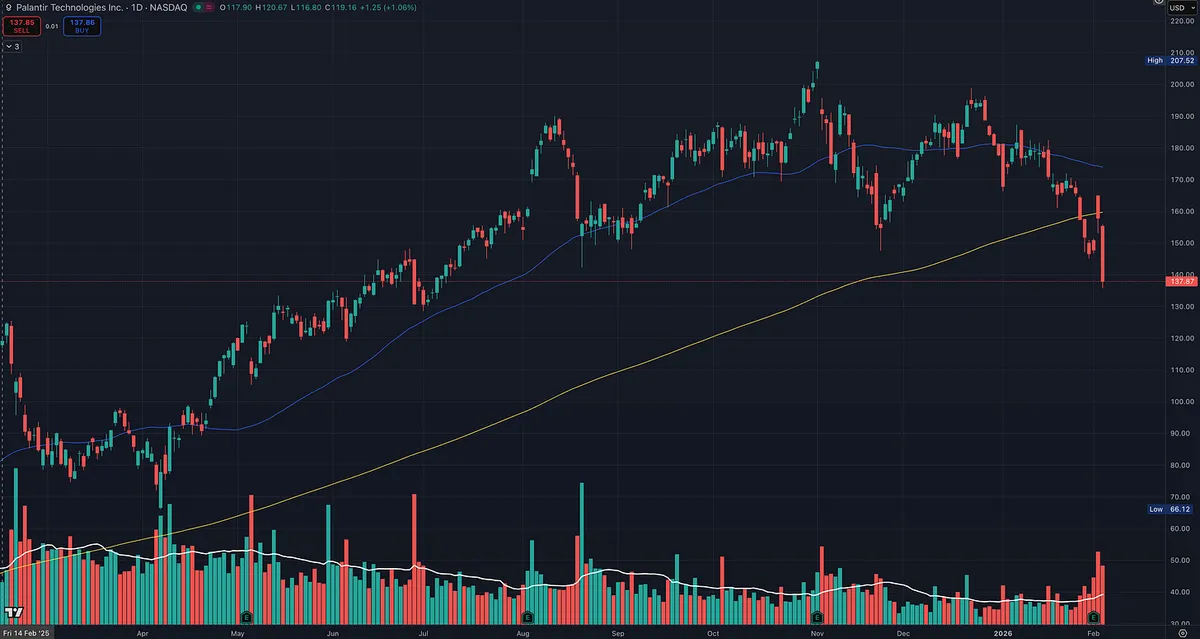
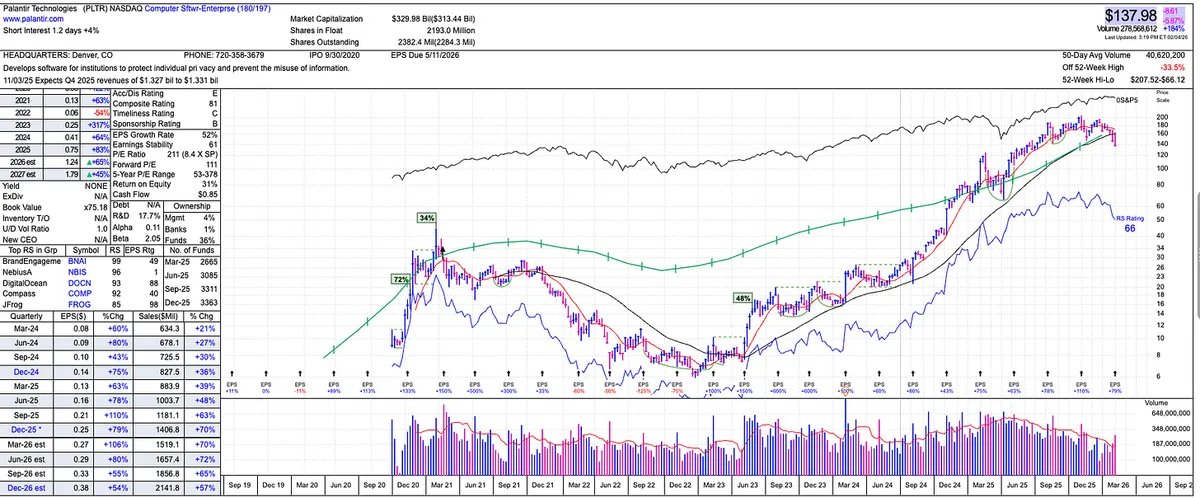
Palantir Technologies was an amazing stock to be in. The trend was strong, relative strength was working, and price rewarded staying with it.

But for now, price has confirmed it is not a stock to be in.

This is a great real-time example of why fundamentals alone do not matter if price and trend are not aligned.

Despite strong long-term fundamentals, the stock is:

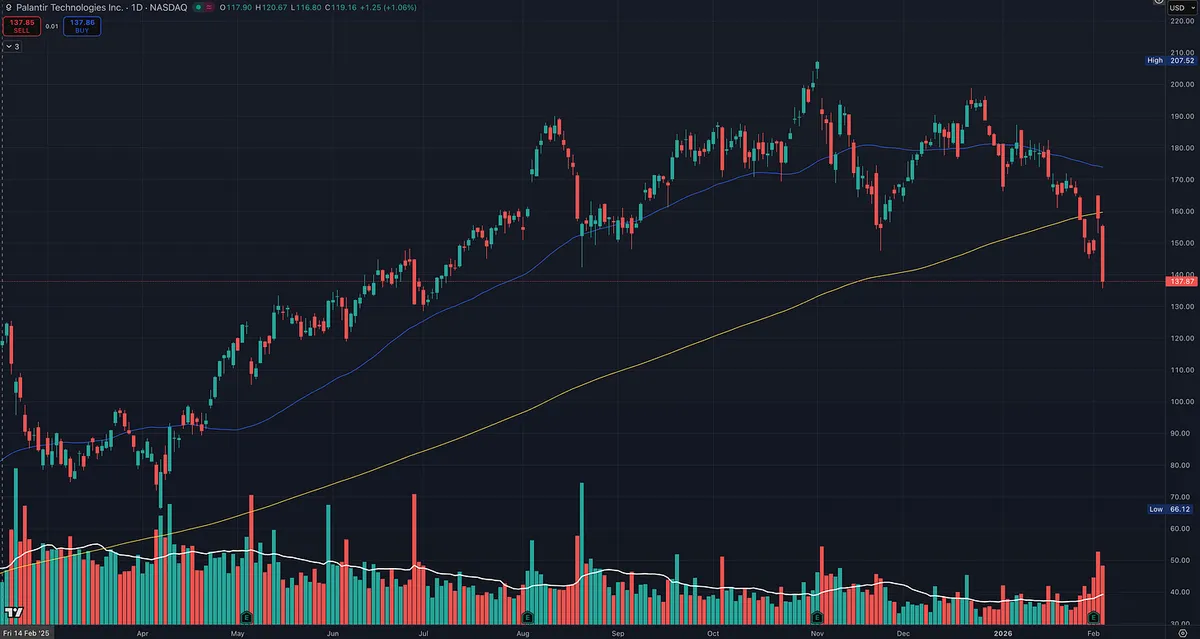
  • Below the 200 day moving average

  • Printing lower highs and lower lows

That is no longer a stage 2 uptrend. That is a downtrend.

When price breaks below the 200 day and cannot reclaim it, that is the market voting. It is telling you that demand has dried up, regardless of how good the story looks on paper.

This is exactly why I will never buy a stock just because the fundamentals look great while price looks bad.

Great fundamentals do not stop drawdowns. Great fundamentals do not override trends. Price always leads.

PLTR may absolutely be a great stock again in the future. In fact, when a name with strong fundamentals starts to repair and regain trend, it often becomes even more powerful on the next run.

But until price confirms that change, there is no point in being involved.

View on Substack ↗

Price Is the Final Judge

Just to be clear.

Fundamentals absolutely play a role in my scanning, and the CANSLIM criteria is a great foundation. The biggest winners in history had big sales, big earnings, and accelerating growth before they really broke out, and most of their biggest moves happened after that breakout.

That matters.

But in practice, many of my winners come from technical scans for stocks already in strong trends with high relative strength.

I will never buy a stock against the trend. I will never buy a stock just because the fundamentals look good while price looks bad.

Price action always comes first.

A stock with great earnings and sales that cannot go up is telling you something. The market is forward looking, and price reflects that reality faster than any spreadsheet ever will.

That said, I will buy a strong stock with the right price action and a clear trend, even if the fundamentals are not perfect yet. I do not write about this as much because there are a lot of beginners, and I want them to be more selective. The CANSLIM criteria was a great foundation for me starting over 20 years ago.

Ideally, I want both aligned.

Strong price action. Strong relative strength. Fundamentals that support the move.

When everything lines up, the odds improve.

Bottom line, sometimes the fundamentals do not matter. What really matters is whether the stock is going up and acting right.

View on Substack ↗

The Market Does Not Care About Your Fundamentals

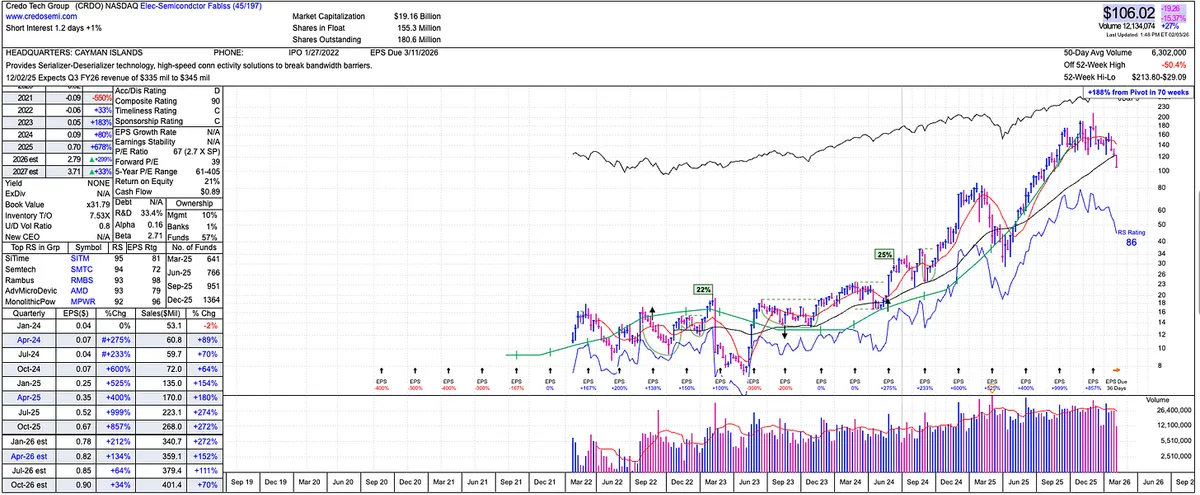
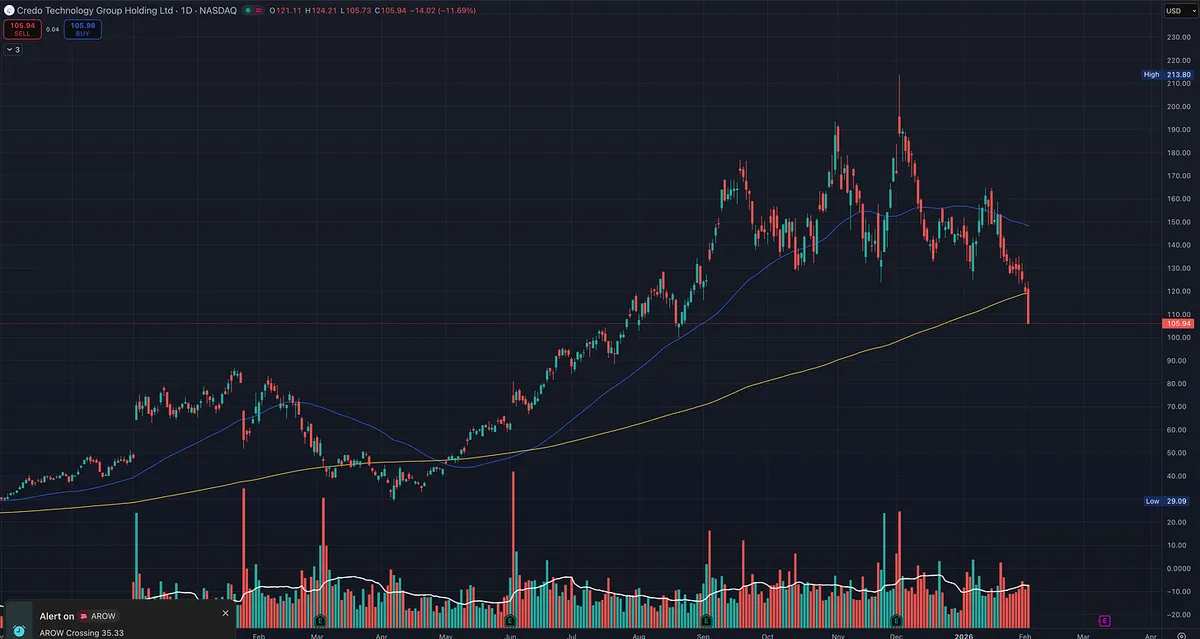
If you want a reminder that price is the final judge, look at CRDO.

On paper, this thing checks a lot of boxes.

  • Sales growth has been huge

  • Earnings growth has been huge

  • Forward estimates are still good

And yet, price is getting smoked, and now CRDO is below the 200 day moving average.

That is the lesson.

Why this happens

The market is not grading the company on what it just did.

The market is forward looking.

So when the rate of change starts to slow, even if the numbers are still “good,” institutions start to reprice the stock.

In CRDO’s case, you can see it in the story:

  • Estimates are still positive

  • But sales and earnings estimates are decelerating starting around the last earnings cycle

  • And price is acting like the market is already discounting a slower growth phase

What I’m doing with it

For now, it’s simple:

  • Solid decline

  • Below the 200 day

  • Not a place to be a hero

I think CRDO can be back at some point, because real growth names often do come back when the story re-accelerates and price regains key levels.

But until price proves it again, we stay away.

View on Substack ↗

Study This Chart: One of the Best Low Risk Breakout Setups

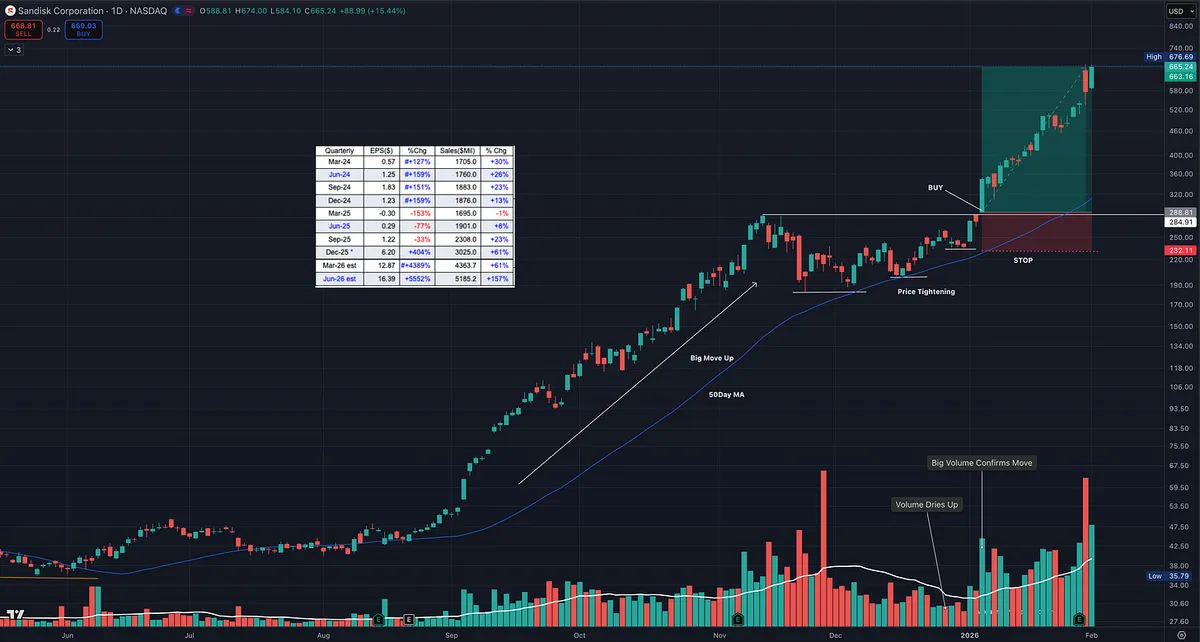
This chart is a perfect example of the type of setup we look for.

The stock is sitting inside a subsector that supports the main market theme right now, AI. When a subsector is strong, it tends to lift the entire group. That is why you see other names in the space acting well too, like Micron Technology, Western Digital, and Seagate Technology.

Now zoom in on the important part.

What makes this a premium setup is that it checks the fundamental boxes that show up in many of the biggest winners of all time, the type of characteristics William J. O'Neil wrote about after studying market history going back over a century.

But fundamentals alone are not what makes this special.

The real edge is the price action.

1) High relative strength

When a stock has RS in the 90s, it is telling you institutions are already voting with their money. This is what you want in a true leader.

2) Big earnings and big sales

Strong numbers are the fuel. Price action is the trigger. When both line up, it is hard for the market to ignore.

3) Big move up, then price tightens

This is the cheat code. A strong advance followed by tight price action. That is where the market gives you a gift.

Tightening action does two things.

  • It shows supply is drying up.

  • It gives you a clean place to define risk.

Why this is low risk and high reward

When price tightens near highs and then breaks out, you can build a trade that is asymmetric.

You are not guessing. You are defining a level that proves you wrong.

If it fails, you are out quickly.

If it works, you can ride a trend and manage it.

That is how you end up with trades that can pay 3R, 5R, even 10R plus while keeping the downside controlled. Study what what it looks like before and after.

View on Substack ↗

How to Use Relative Strength to See Where Institutions Are Moving

One mistake I see often is focusing only on what already has high relative strength.

That’s useful, but it’s not enough.

What matters just as much is acceleration and deceleration.

When an area shows improving relative strength across multiple timeframes, that often signals new capital flowing in, not just a crowded trade. By contrast, groups that still rank high but begin to lose momentum across shorter timeframes are often early signs that leadership is tiring.

Relative strength is most powerful when used as a trend-of-a-trend tool, not a scoreboard.

Instead of asking, “What’s at the top right now?” A better question is, “Where is money starting to flow?”

That shift in perspective can help you:

  • Find emerging leadership earlier

  • Avoid overstaying extended themes

  • Align with institutional rotation rather than chasing headlines

This is exactly how I use the Relative Strength Dashboard when building and refining the watchlist.

View on Substack ↗

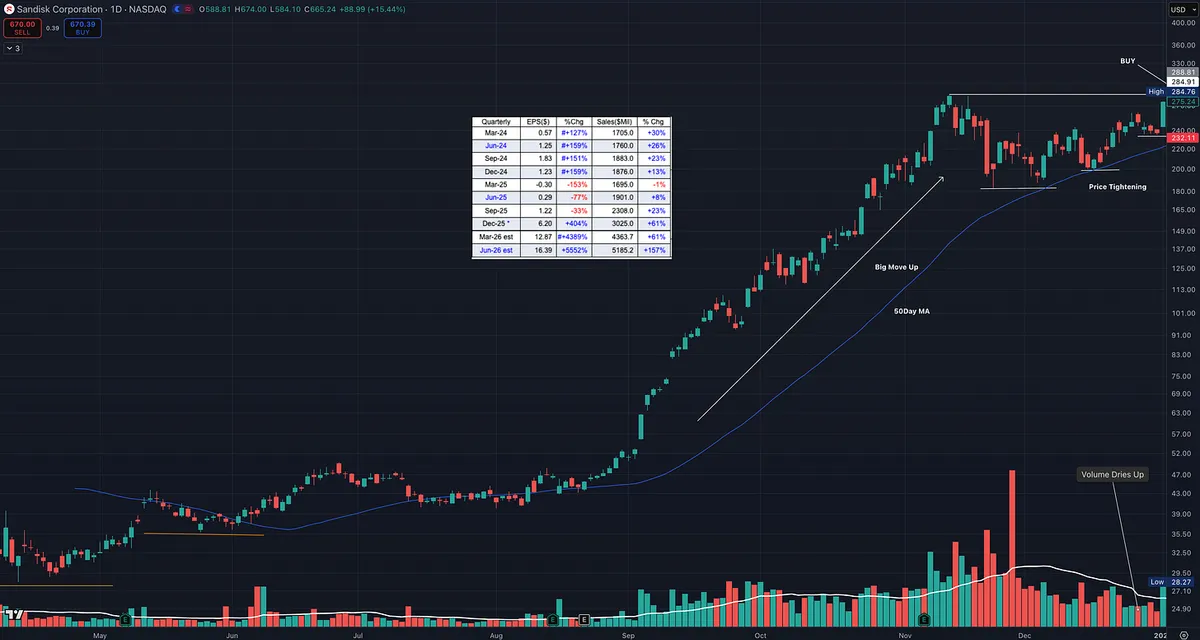
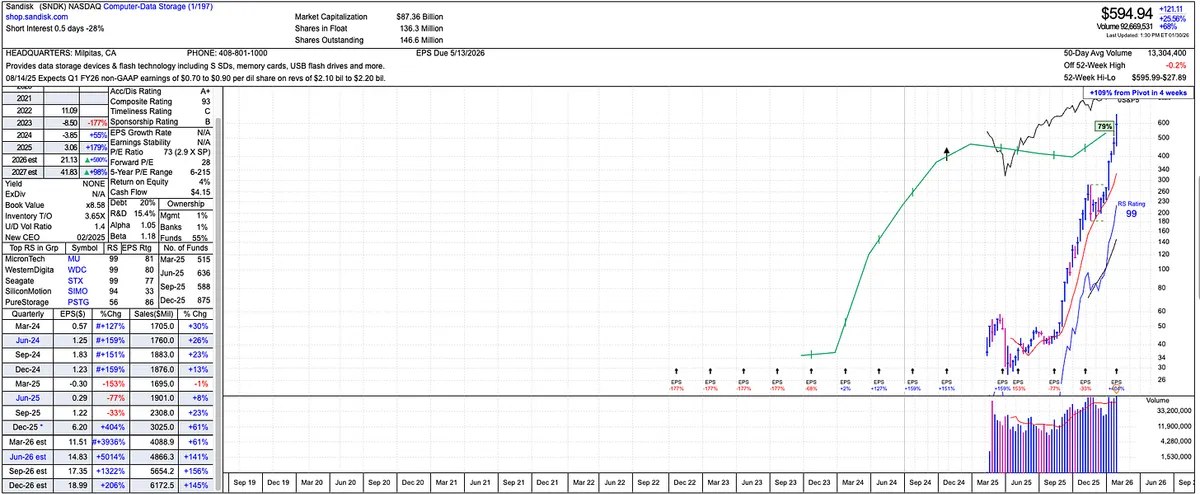
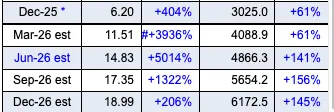
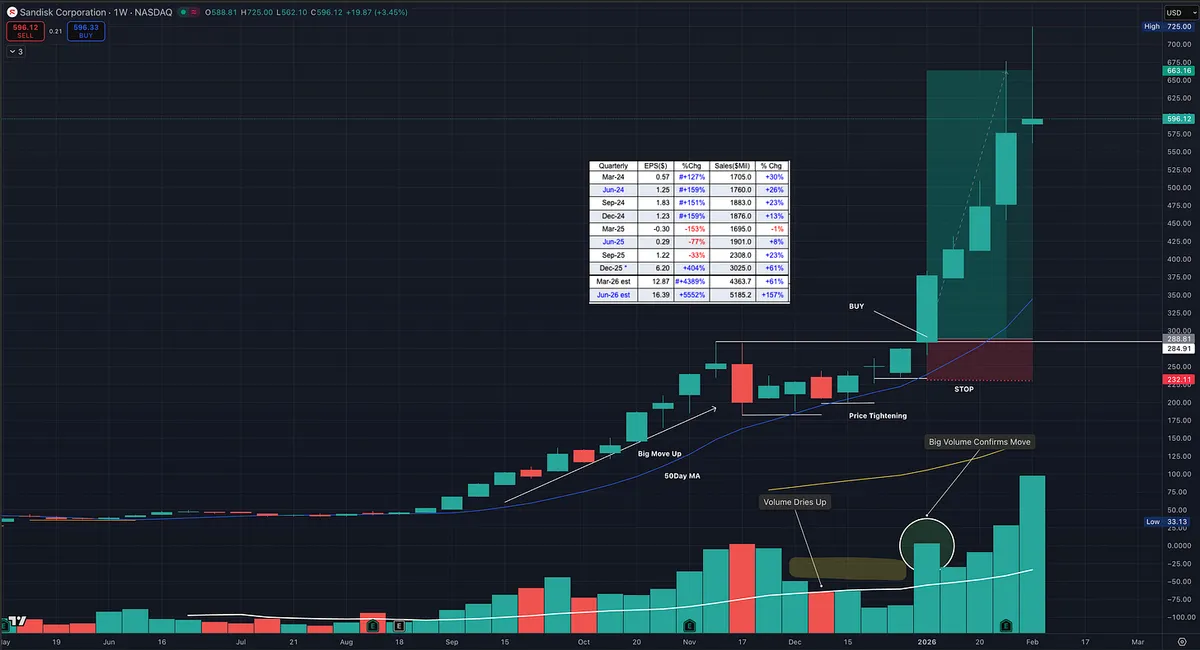
Look at Sandisk’s earnings and sales estimates heading into 2026.

This is a great reminder that markets are always looking forward, not backward.

The heavy buying in this stock didn’t start when the numbers looked good. It started much earlier, when earnings were weak and sales were just beginning to turn. Price and relative strength moved first. Fundamentals followed later.

That’s often how leadership develops.

By the time the estimates look obvious to everyone, a large part of the move may already be behind us… or it may still be early in a much bigger trend.

Only time will tell.

This is why price action, relative strength, and industry leadership matter so much. They often hint at what’s coming well before it shows up cleanly in the fundamentals.

View on Substack ↗

Study This Chart. This Is Leadership.

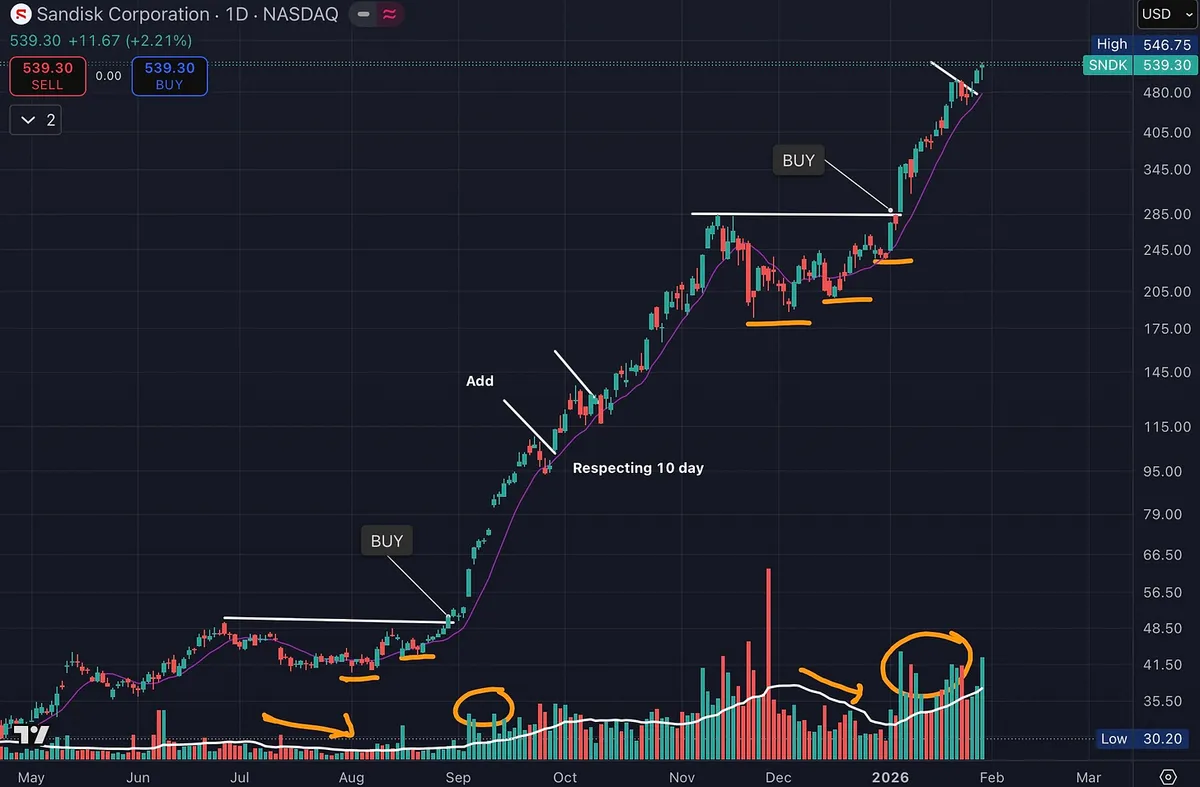
One area that has quietly dominated since the April correction is data storage, a key part of the broader AI theme.

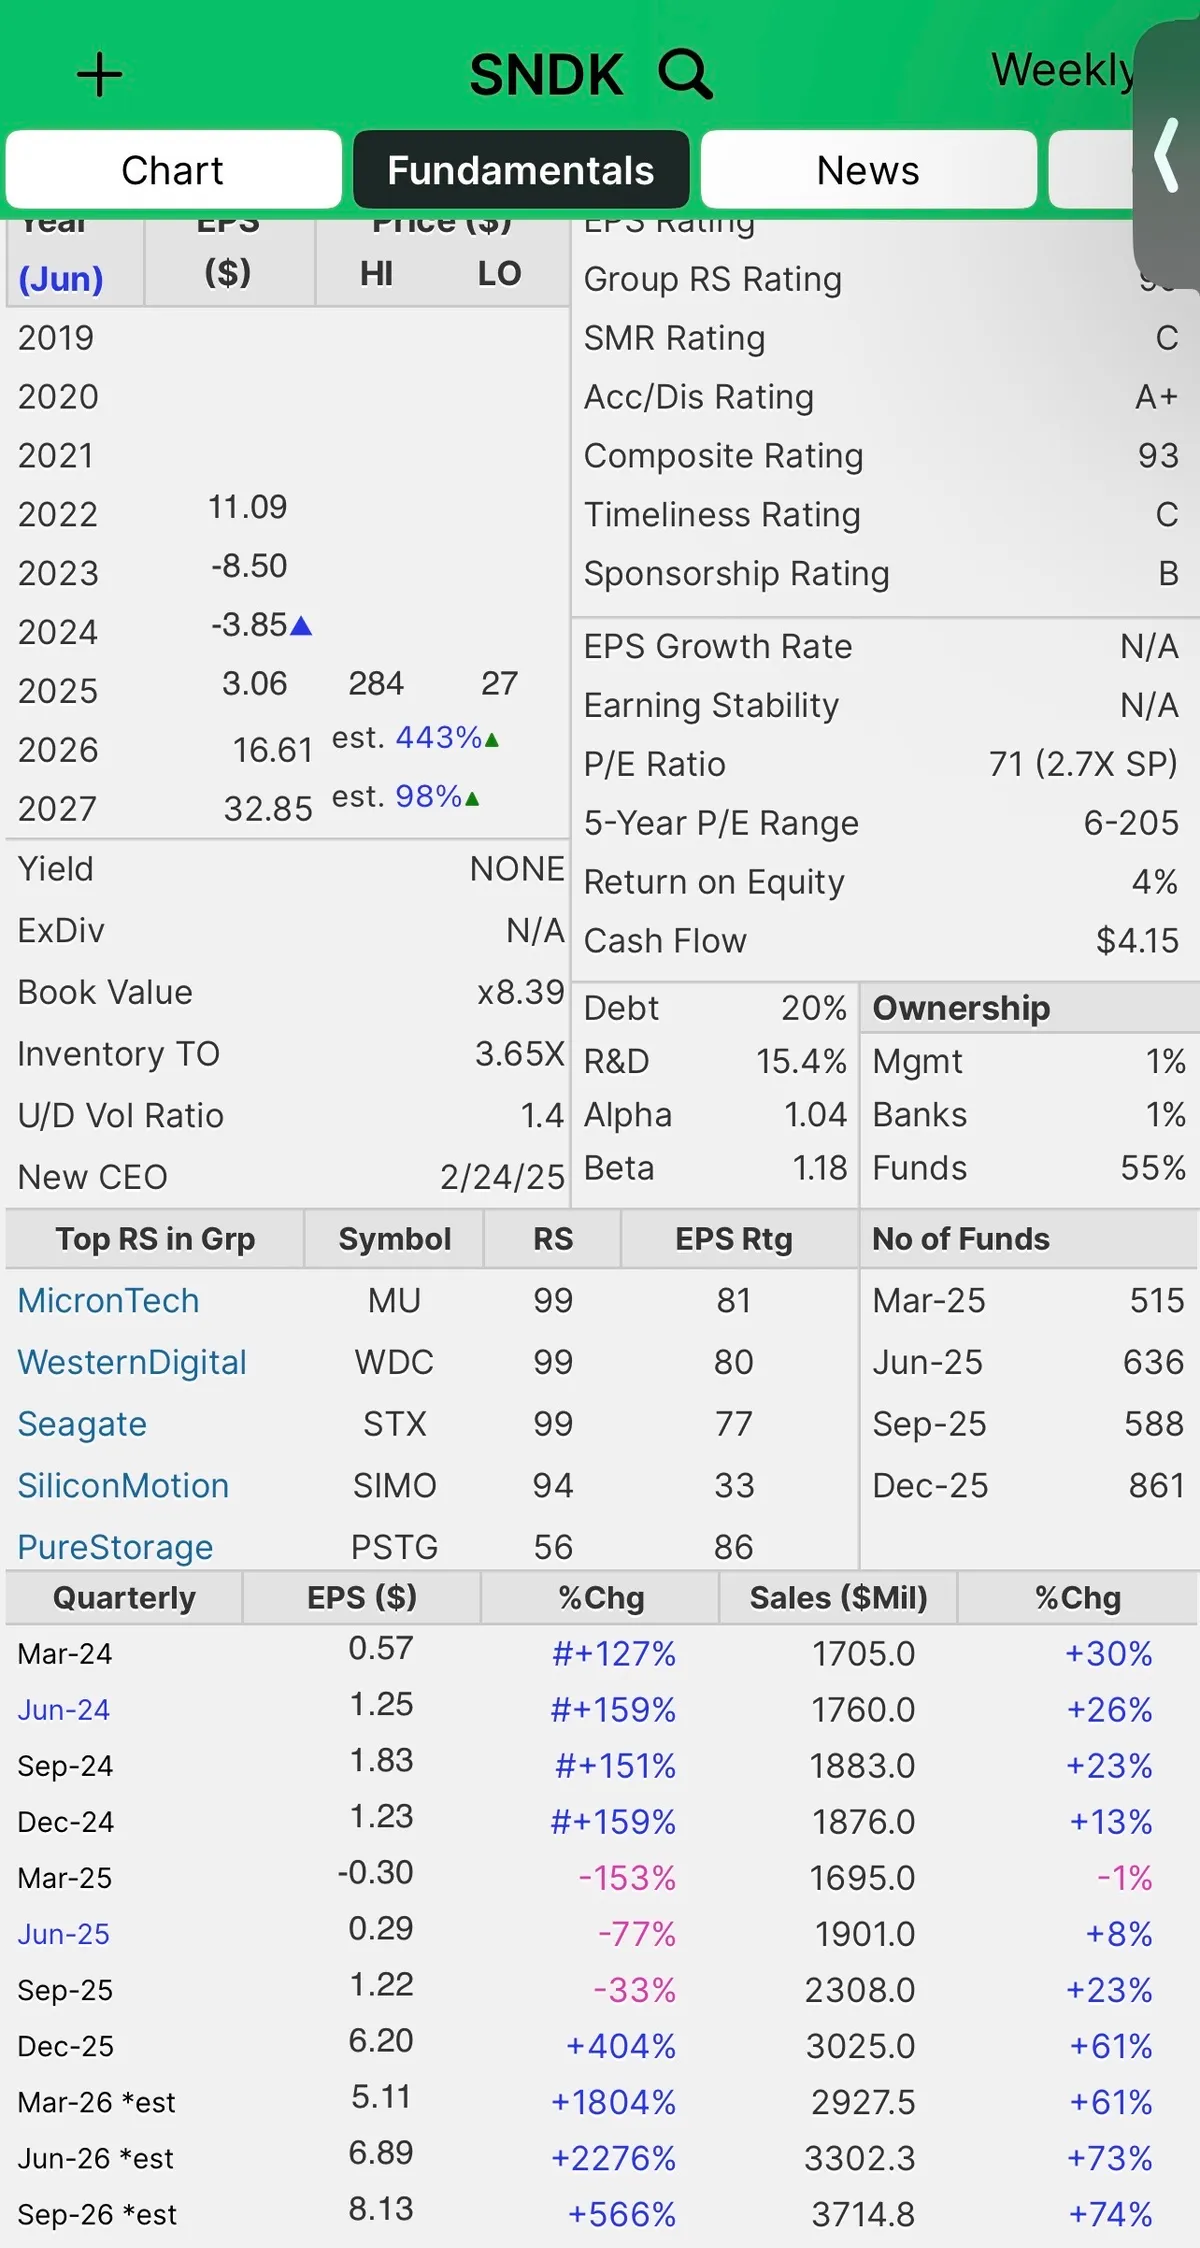
SNDK is a great example.

The fundamentals are there.

High relative strength.

Earnings and sales acceleration.

Rapid increase in fund ownership.

But the real lesson is in the chart.

Price exploded higher on heavy volume. That’s institutional demand showing its hand.

Then price paused.

Volume dried up during consolidation. Pullbacks stayed shallow. The right side tightened up. Sellers stepped aside.

Price respected the 10-day moving average with a smooth, orderly advance. No volatility. No panic. Just controlled strength.

Then it did it again.

Another tight consolidation.

Another dry-up in volume.

Another expansion higher on strong volume.

This is textbook supply and demand in action.

Strong stocks don’t give back much. They move up, rest, absorb supply, and continue higher. That’s exactly what’s happening here.

And this wasn’t a one-off.

The category gave it away. Other data storage names were acting the same way. When multiple leaders in a group show identical behavior, pay attention.

This is the kind of chart that should be studied over and over.

Not because it’s perfect.

But because it clearly shows where risk is defined and why big trends are built the way they are.

Charts like this are how you learn to recognize real leadership.

Study this.

View on Substack ↗

95% of My Profits Came From One Simple Rule

Dan Zanger once said:

“All the biggest-moving stocks I’ve owned during the past 20 years, where I’ve made 95% of my money, were ones hitting new highs from very solid bases.”

That statement sounds almost too simple. But it cuts straight through a lot of noise.

Most investors spend their time looking for value, bottoms, turnarounds, or what feels cheap. Dan Zanger did the opposite. He focused on strength, not bargains.

And William O'Neil said something very similar. He wanted to buy the best stocks, not the cheapest ones.

View on Substack ↗

The Most Ignored Letter in CANSLIM Is Why This Stock Took Off

Most investors know CANSLIM. Very few actually use all of it.

William O’Neil repeatedly emphasized that the biggest winners are not powered by charts alone, or even great numbers alone. They are driven by something new that creates demand big enough to force institutions to act.

That letter is N.

New product. New service. New technology. New way of doing something the world suddenly needs.

Ironically, this is the letter I see people focus on the least. Even me at times.

Why “New” Matters More Than People Think

Strong earnings and sales can tell you what is happening. The N tells you why it can keep happening.

True super-performers are not just benefiting from a good cycle. They are tied to a structural shift that creates persistent demand. That demand is what supports large sales growth, expanding margins, and long runs in price.

Without that, many stocks end up being decent movers, not generational leaders.

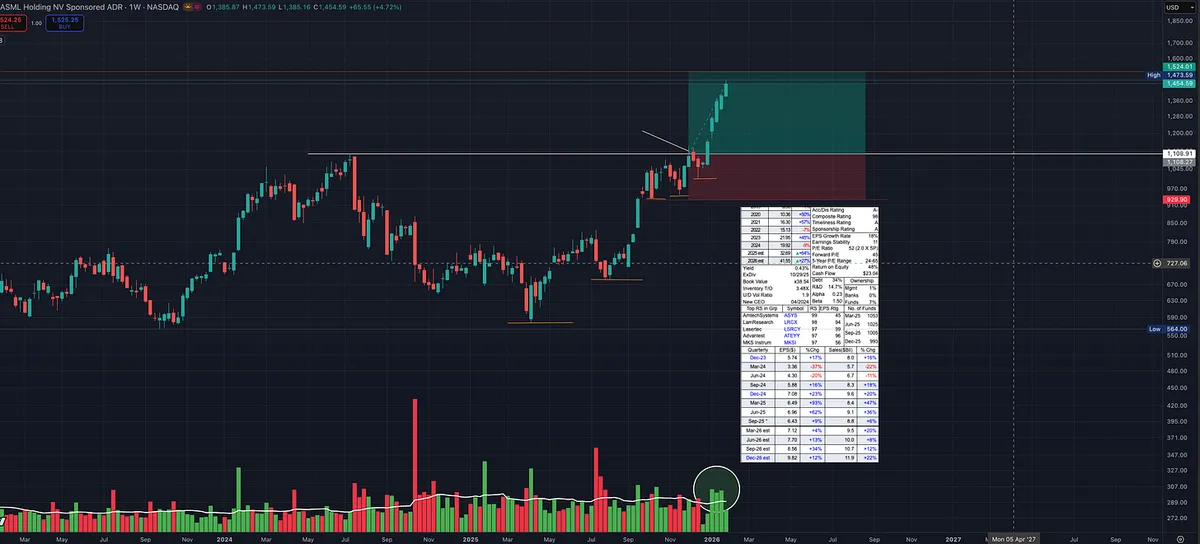
ASML Is a Perfect Real-World Example

ASML is not just another high-quality semiconductor company.

It sits at the center of a new way to manufacture advanced computer chips that the entire industry now depends on. Its extreme ultraviolet lithography technology has become essential for producing leading-edge chips. Without it, progress would have slowed dramatically.

That is the N.

Understanding why ASML matters gives you conviction. It explains why demand is so strong, why customers have little choice, and why the fundamentals continue to confirm the price action.

Now Look at the Stock

Once the story is clear, the chart speaks louder.

  • Clean cup with handle structure

  • Tight action near highs

  • Volume supporting the breakout

  • Relative strength near the top of the market

The fundamentals confirm it:

  • Strong earnings and sales growth

  • Return on equity around 48%

  • Operating margins above 30%

This is price, fundamentals, and N aligning.

The Takeaway

You do not need to predict the future. You do need to understand what is new and why it matters.

That extra work changes how long you hold winners, how you handle pullbacks, and whether you sell too early just because something feels extended.

That is what O’Neil meant by N.

The market eventually makes the decision for you. Your job is to understand why it might keep saying yes.

View on Substack ↗

The Best Stocks Feel Uncomfortable to Buy

A lot of people think a stock is “too extended” because it already looks great.

Strong earnings.

Strong sales.

High relative strength.

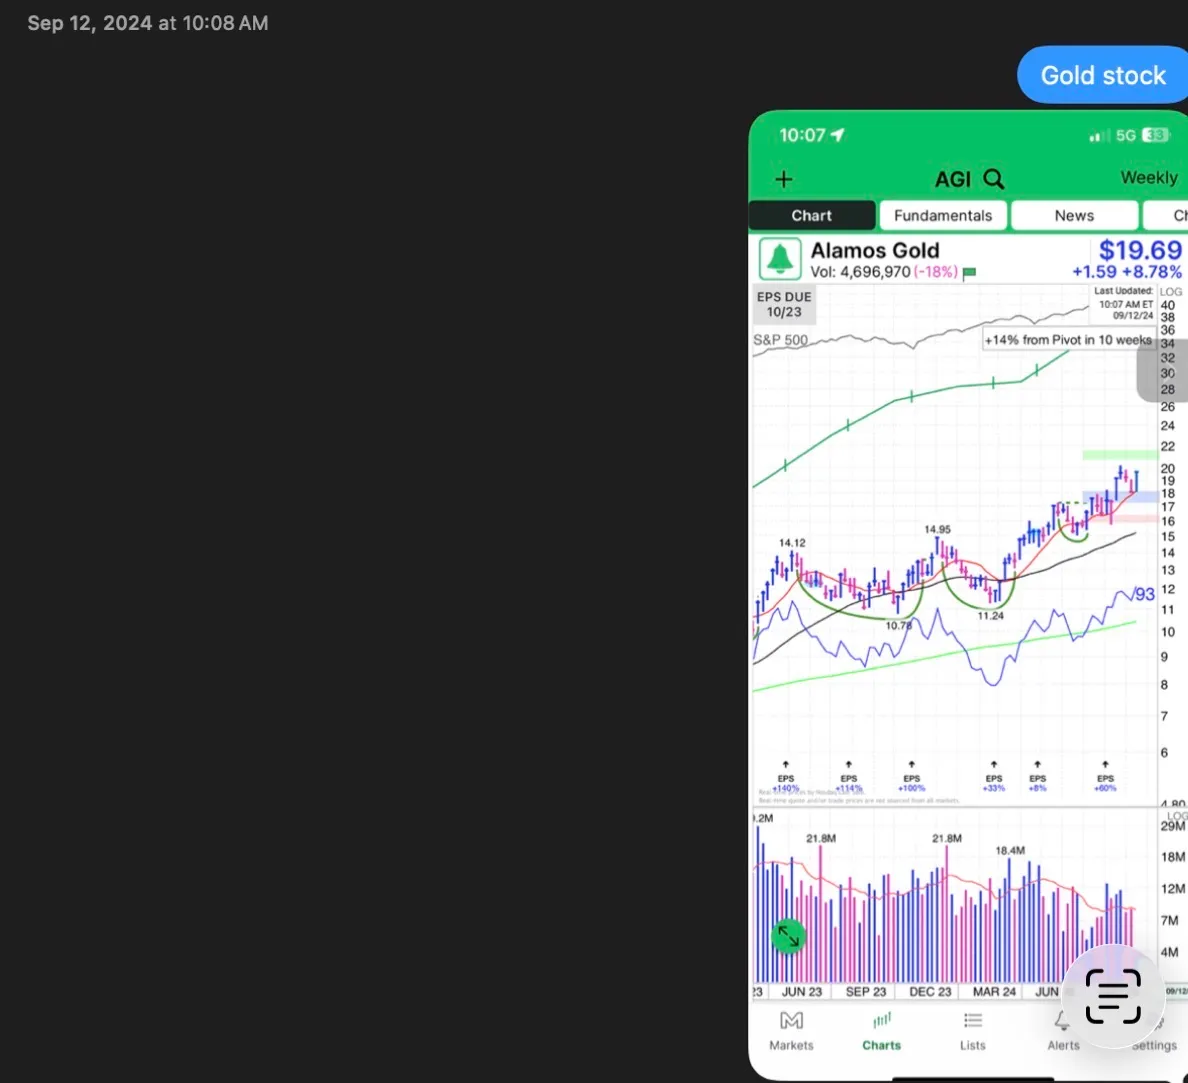
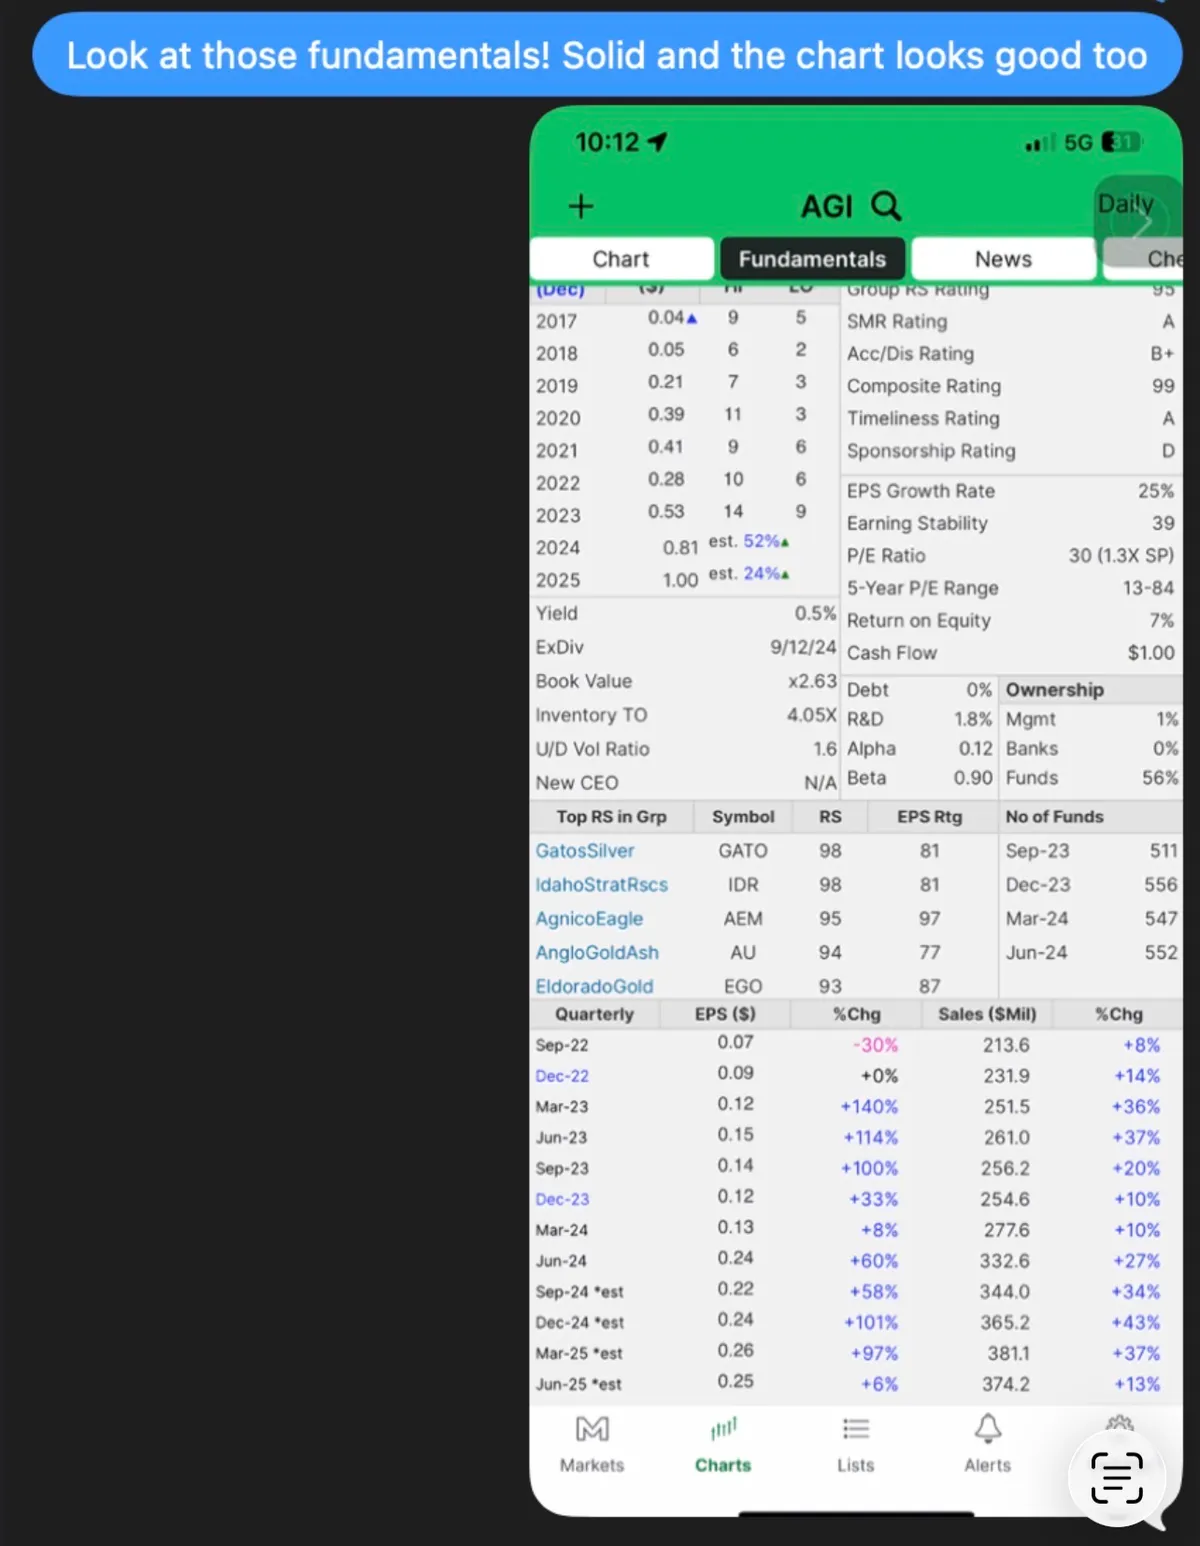
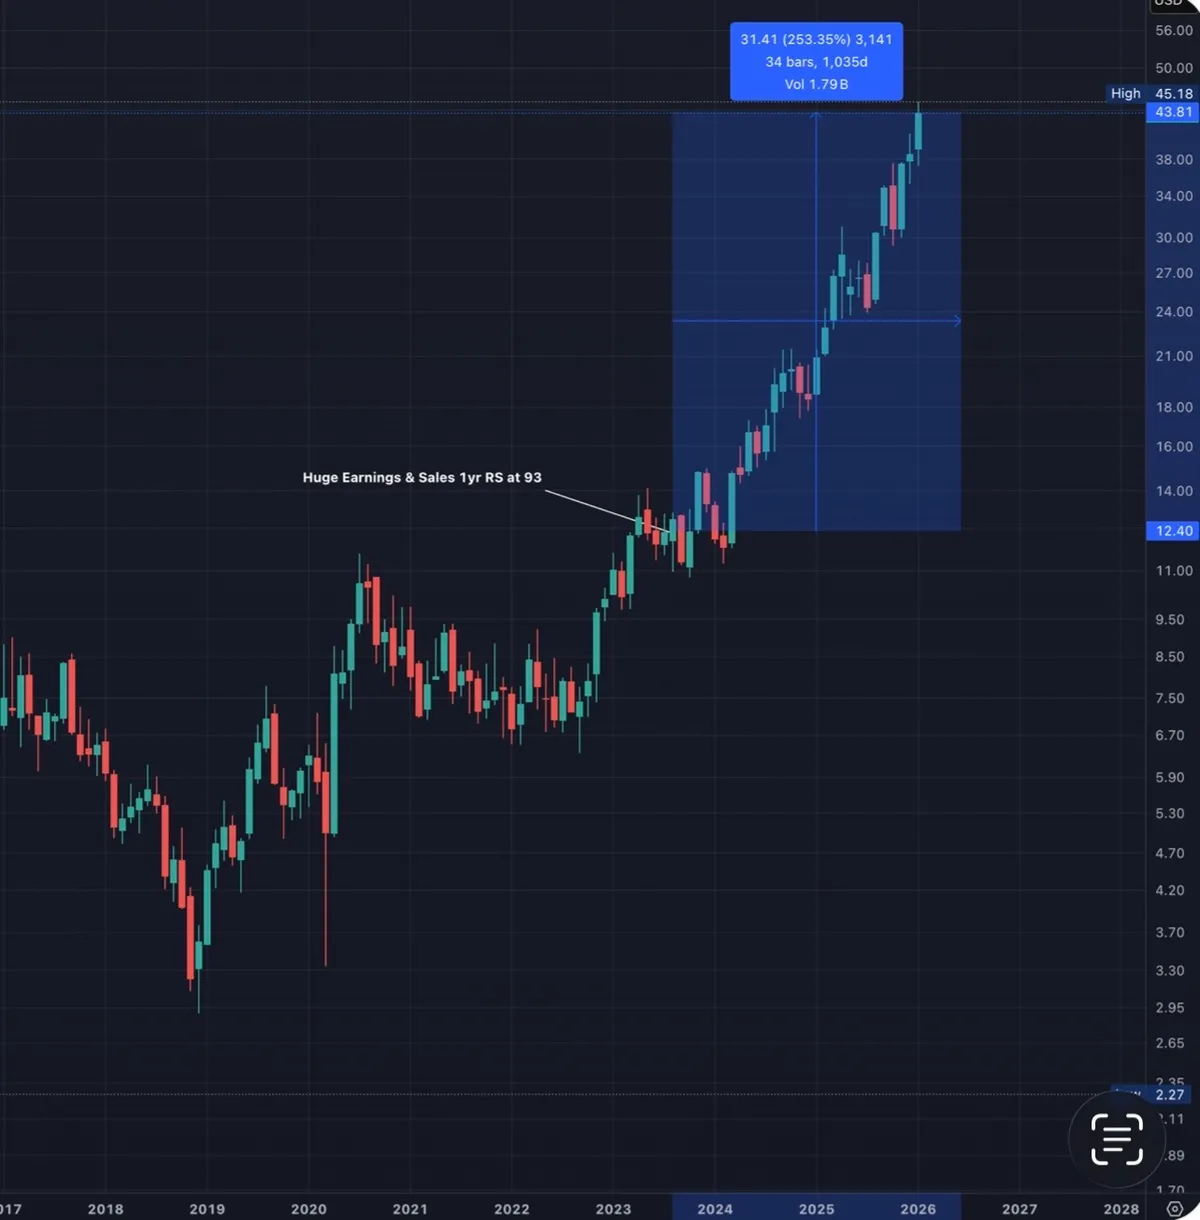
A friend reached out to me today and said he wished he had bought AGI when I texted him about it back in September 2024. That message is what gave me the idea to share this.

Below is AGI in September 2024, and then where it is today.

Back then, his reaction was reasonable:

“Look at those fundamentals. Solid. And the chart looks good too. But the run must be close to over.”

At the time, it already looked like a leader.

High RS.

Big gains off the prior year.

Multiple quarters of strong earnings and sales.

It felt uncomfortable to chase.

It turned out that discomfort was not a warning sign. It was the price of admission.

This is one of the hardest lessons in stock trading. True leaders often look “too good” far longer than most expect.

That tension between what feels extended and what actually keeps working is where many investors get shaken out early.

The charts below tell most of the story on their own.