Momentum Trading Strategy

Notes

Finding Leading Stocks

What to buy: how to find, screen and rank the strongest stocks and industry groups.

Showing 221–240 of 299 notes

View on Substack ↗

Stanley Druckenmiller on Crowded Trades

Most traders are afraid of crowded trades.

Druckenmiller is not.

He said:

“I don't care if a trade is crowded, if I think the thesis is right and the trend is with me. I mean, for entry points I care, but I don't really care in terms of the investment. It doesn't bother me.”

Read that again.

If the trend is right and the story is right, being crowded does not matter.

View on Substack ↗

Why I Don’t Care About the P/E Ratio

P/E is simply how much investors are paying for each dollar of earnings.

That’s it.

In the late 1990s, Yahoo traded at 938x earnings. By 2000, it traded at 1700x earnings.

The stock went up roughly 8000%.

High P/E did not stop it.

Now look at Tesla.

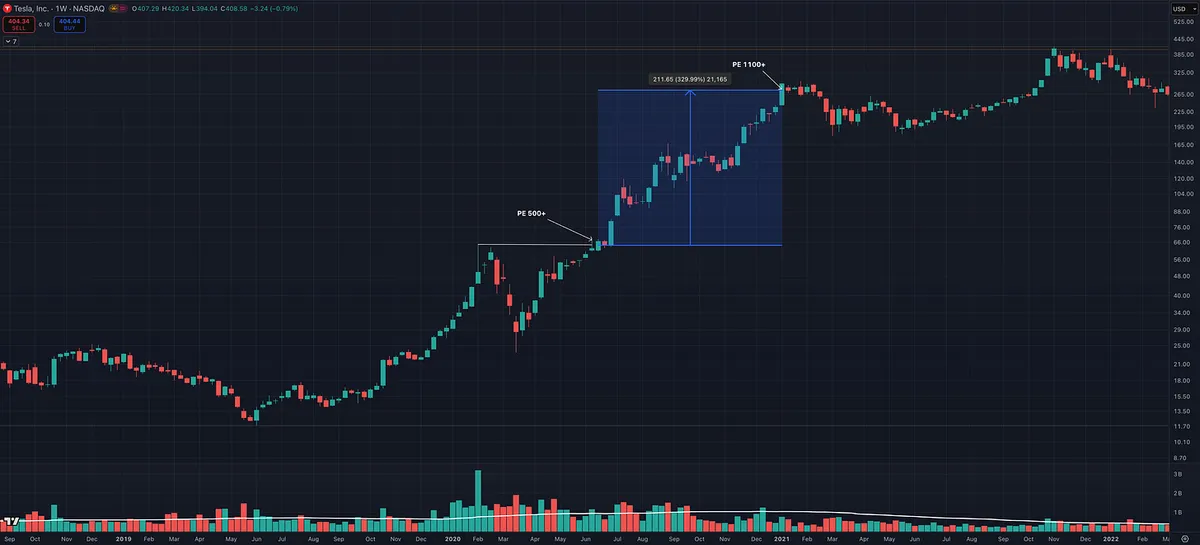
In 2020, Tesla traded above 500x earnings. It later pushed above 1100x earnings.

The stock kept going higher.

If you waited for it to look cheap, you missed the move.

Here’s what most investors miss:

In growth stocks, multiple compression is a symptom of slowing expectations.

Growth decelerates. Institutions distribute. The P/E contracts.

And that’s when retail investors buy it because it looks “cheap.”

That is how you get stuck in Stage 4 decline or dead money.

Low P/E does not create demand.

High P/E does not prevent it.

Price moves when growth accelerates and buyers compete.

Valuation comfort is not a catalyst.

Demand is.

View on Substack ↗

Every Bull Market Starts With Something New

If you study over 100 years of market history, one pattern becomes impossible to ignore.

Every major bull market has been driven by something new.

Not cheap stocks. Not low PEs. Not high dividends.

Something new.

Let’s walk through it by decade.

1900s

Steel, railroads, oil, electrification. Industrial expansion reshaped the American economy. Capital flowed into companies building the physical backbone of the country.

1920s

Automobiles and mass production. Ford changed transportation. Consumer expansion exploded. Entire new industries were born.

1950s and 1960s

Television, aerospace, post war consumer growth. America industrialized further and globalized.

1980s

Personal computers. IBM, Microsoft, and others brought computing to businesses and households. Productivity shifted permanently.

1990s

The internet. Search, networking, ecommerce. Cisco. Google. Amazon. A completely new digital infrastructure.

2000s

Broadband, smartphones, and software at scale. Entire industries were digitized.

2010s

Cloud computing and mobile ecosystems. Apple. Salesforce. The rise of SaaS and platform dominance.

2020s

Artificial Intelligence. AI infrastructure. AI software. Automation. The early innings of another structural shift.

Industries change. Technology evolves, but the pattern does not.

A new innovation creates a new category. Capital concentrates into the strongest companies in that category. Market leaders emerge. Momentum follows.

This is the N in CANSLIM.

New products. New services. New industry conditions. New leadership. New Price Highs.

Every generation says, “This time is different.”

It never is.

The innovation changes.

The behavior of money does not.

If you want to understand where the next big winners come from, start by asking one question:

What is truly NEW right now?

That question has worked for over a century.

View on Substack ↗

If You Want Big Winners, Start With Relative Strength

Before a stock makes a massive move, it almost always shows one thing first.

Relative strength.

I spot nearly every big winner the same way. It shows up on a relative strength scan before it shows up on social media, before it becomes obvious, before the breakout gets attention.

Running a daily relative strength screen takes minutes.

When you start seeing the same names appear day after day, week after week, that is your signal.

That is not noise. That is accumulation.

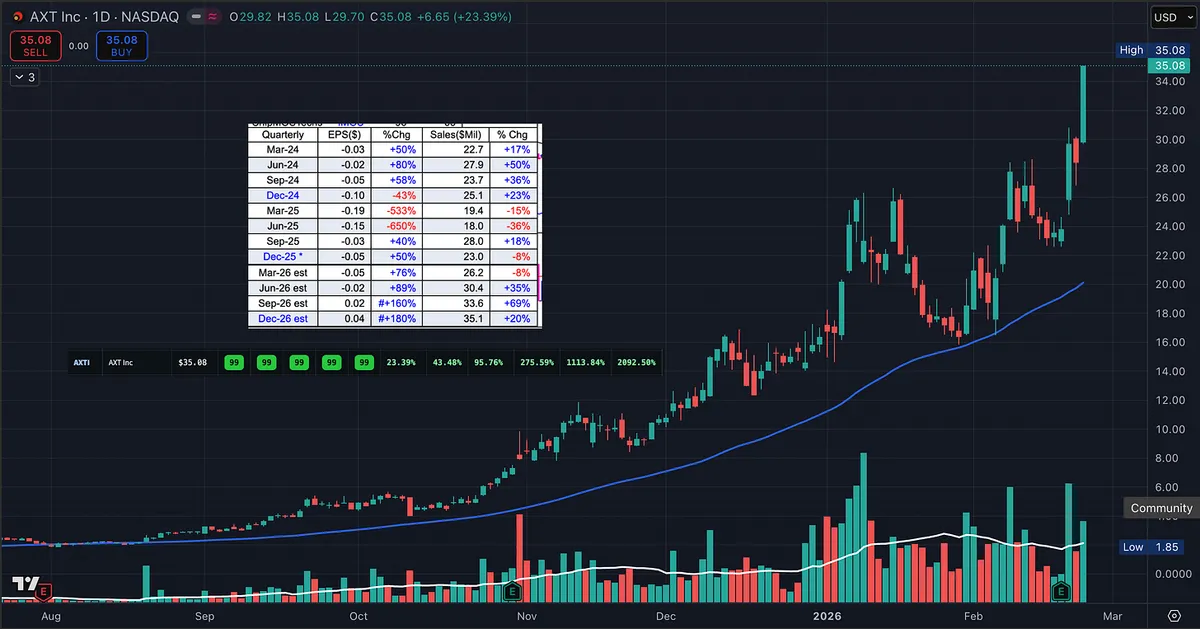
Look at AXTI.

RS 1W: 99 RS 1M: 99 RS 3M: 99 RS 6M: 99 RS 1Y: 99

That is sustained outperformance across every meaningful timeframe.

Now look at the returns:

1 month: +95% 3 months: +275% 6 months: +1113% 1 year: +2092%

Big winners do not come out of nowhere.

They begin by outperforming the market quietly.

Institutions accumulate strength, not weakness. Capital flows toward leaders.

Relative strength tells you:

• Where money is going

• Which stocks are being accumulated

• Who is leading right now

If you want to catch outsized moves, stop looking for cheap.

Start looking for strong.

View on Substack ↗

CANSLIM Stock Screener Results: High EPS+Sales Growth, High RS Ratings, and Breakout Setups

When leadership shifts, most traders get cut up because they keep trading what used to work.

So instead of guessing, I scanned for strict CANSLIM criteria.

Not opinions. Not narratives. Numbers.

Here is the minimum framework I used:

  • Quarterly EPS growth: 18 to 20 percent minimum

  • Preferred quarterly EPS: 40 percent or higher

  • Quarterly sales growth: 25 percent or higher

  • Annual EPS growth: 25 percent for three consecutive years

  • ROE minimum: 17 percent

  • Preferred ROE: 25 to 50 percent

  • RS Rating minimum: 80

  • Preferred RS: 80 to 90 plus

In other words, I looked for companies showing real fundamental acceleration and institutional grade relative strength.

Strong earnings. Strong sales. High profitability. And price action confirming demand.

Then I narrowed it further to names that are either near pivots, pulling back constructively, or tightening before potential breakouts.

This is how we stack probability.

Strong fundamentals and technical confirmation. Defined risk always.

Latest updates have been added directly to the post, with additional names and real-time notes shared inside the paid subscriber chat.

https://tradingmomentum.substack.com/p/canslim-watchlist-update

On SubstackCANSLIM Watchlist Update
View on Substack ↗

Rotation Is Not the End. It Is the Reset.

Technology, software, and semiconductors led this bull market.

Now they are under pressure.

Distribution has shown up. Relative strength has cooled. Former leaders are correcting hard.

That is not abnormal.

It is exactly how bull markets mature.

O’Neil showed that industry leadership rotates, but powerful themes often resurface with new companies driving the advance. Innovation does not disappear. It shifts hands.

Minervini teaches that leaders top first, correct deeply, and later the strongest stocks rebuild proper Stage 2 bases before emerging again.

The key distinction:

Old leaders rarely reclaim leadership. Strong industry themes often do.

After extended advances, superperformance stocks frequently decline 50 percent or more. That decline is not the death of the group. It is the reset that clears weak hands and allows new accumulation.

The next tech advance will not be led by stocks trying to recover broken charts.

It will be led by:

New bases New earnings acceleration New relative strength leaders New institutional accumulation

This is normal cycle behavior.

Capital rotates out of extended leaders. Groups consolidate. New names rise from the same ecosystem.

Semiconductors led before. Software led before. They can lead again.

But leadership must be proven again through price, volume, and earnings.

That is the process.

And that process is what creates the next superperformance opportunity.

View on Substack ↗

Leadership Leaves Clues — Relative Strength Is One of Them

Relative Strength isn’t the whole story.

But it’s often the first clue that institutional money is moving in.

William O’Neil’s research into the greatest stock market winners showed that leading stocks typically displayed superior relative price strength before their biggest advances .

Not after.

Before.

Mark Minervini builds on that same principle, focusing on stocks already outperforming the market and making new highs before they emerge from proper bases .

Relative Strength doesn’t replace:

• Earnings growth

• Proper structure

• Risk management

But it narrows the field to potential leaders.

And in a market with thousands of stocks, narrowing the field correctly is an edge.

I just released a full breakdown of how I use Relative Strength, along with the Relative Strength Stock Screener available to paid subscribers.

Read the full post and watch the walkthrough below.

https://tradingmomentum.substack.com/p/the-relative-strength-screener-just

On SubstackThe Relative Strength Screener Just Leveled Up
View on Substack ↗

When All The Forces Line Up

Mark Minervini says it simply:

“You want all the forces behind you, fundamental, technical, and market tone.”

That is the edge.

A stock can be fundamentally strong and still go nowhere.

Earnings can be growing. Revenue can be accelerating. The story can be compelling.

But if supply and demand have not aligned, the stock is not ready.

A good company is not always a good stock.

Price must confirm.

Institutions must be accumulating.

The overall market must support risk.

Minervini makes this distinction clear throughout his work. Fundamentals create potential. Technicals confirm timing. Market tone determines probability.

You can be right about the company and still lose money if you are early.

Because what moves stocks is not your opinion.

It is institutional demand.

Big funds control the majority of volume. When they perceive value, price moves. When they are not interested, even the best story stalls.

That is why you want:

Strong earnings and sales growth. Constructive base structure. Tight price action. Volume drying up before breakout. A healthy general market.

When all three align, fundamental strength, technical setup, and favorable market conditions, probability shifts in your favor.

When one is missing, risk increases.

You are not just buying a stock.

You are aligning yourself with institutional perception and market momentum.

When all the forces are behind you, the path of least resistance is up.

View on Substack ↗

The Only Way a Stock Goes Up 8000 Percent

Most investors are afraid of new highs.

They think the move is over.

They think they are late.

Mark Minervini explains why that thinking is backwards.

He writes:

“Keep in mind that the only way a stock can become a superperformer—moving from, say, $20 to $80 and then to $180—is for that stock to make a series of new highs all the way up.”

That is not opinion. That is how markets work.

A true monster stock must make repeated new highs.

It cannot go from cheap to extraordinary without breaking out again and again.

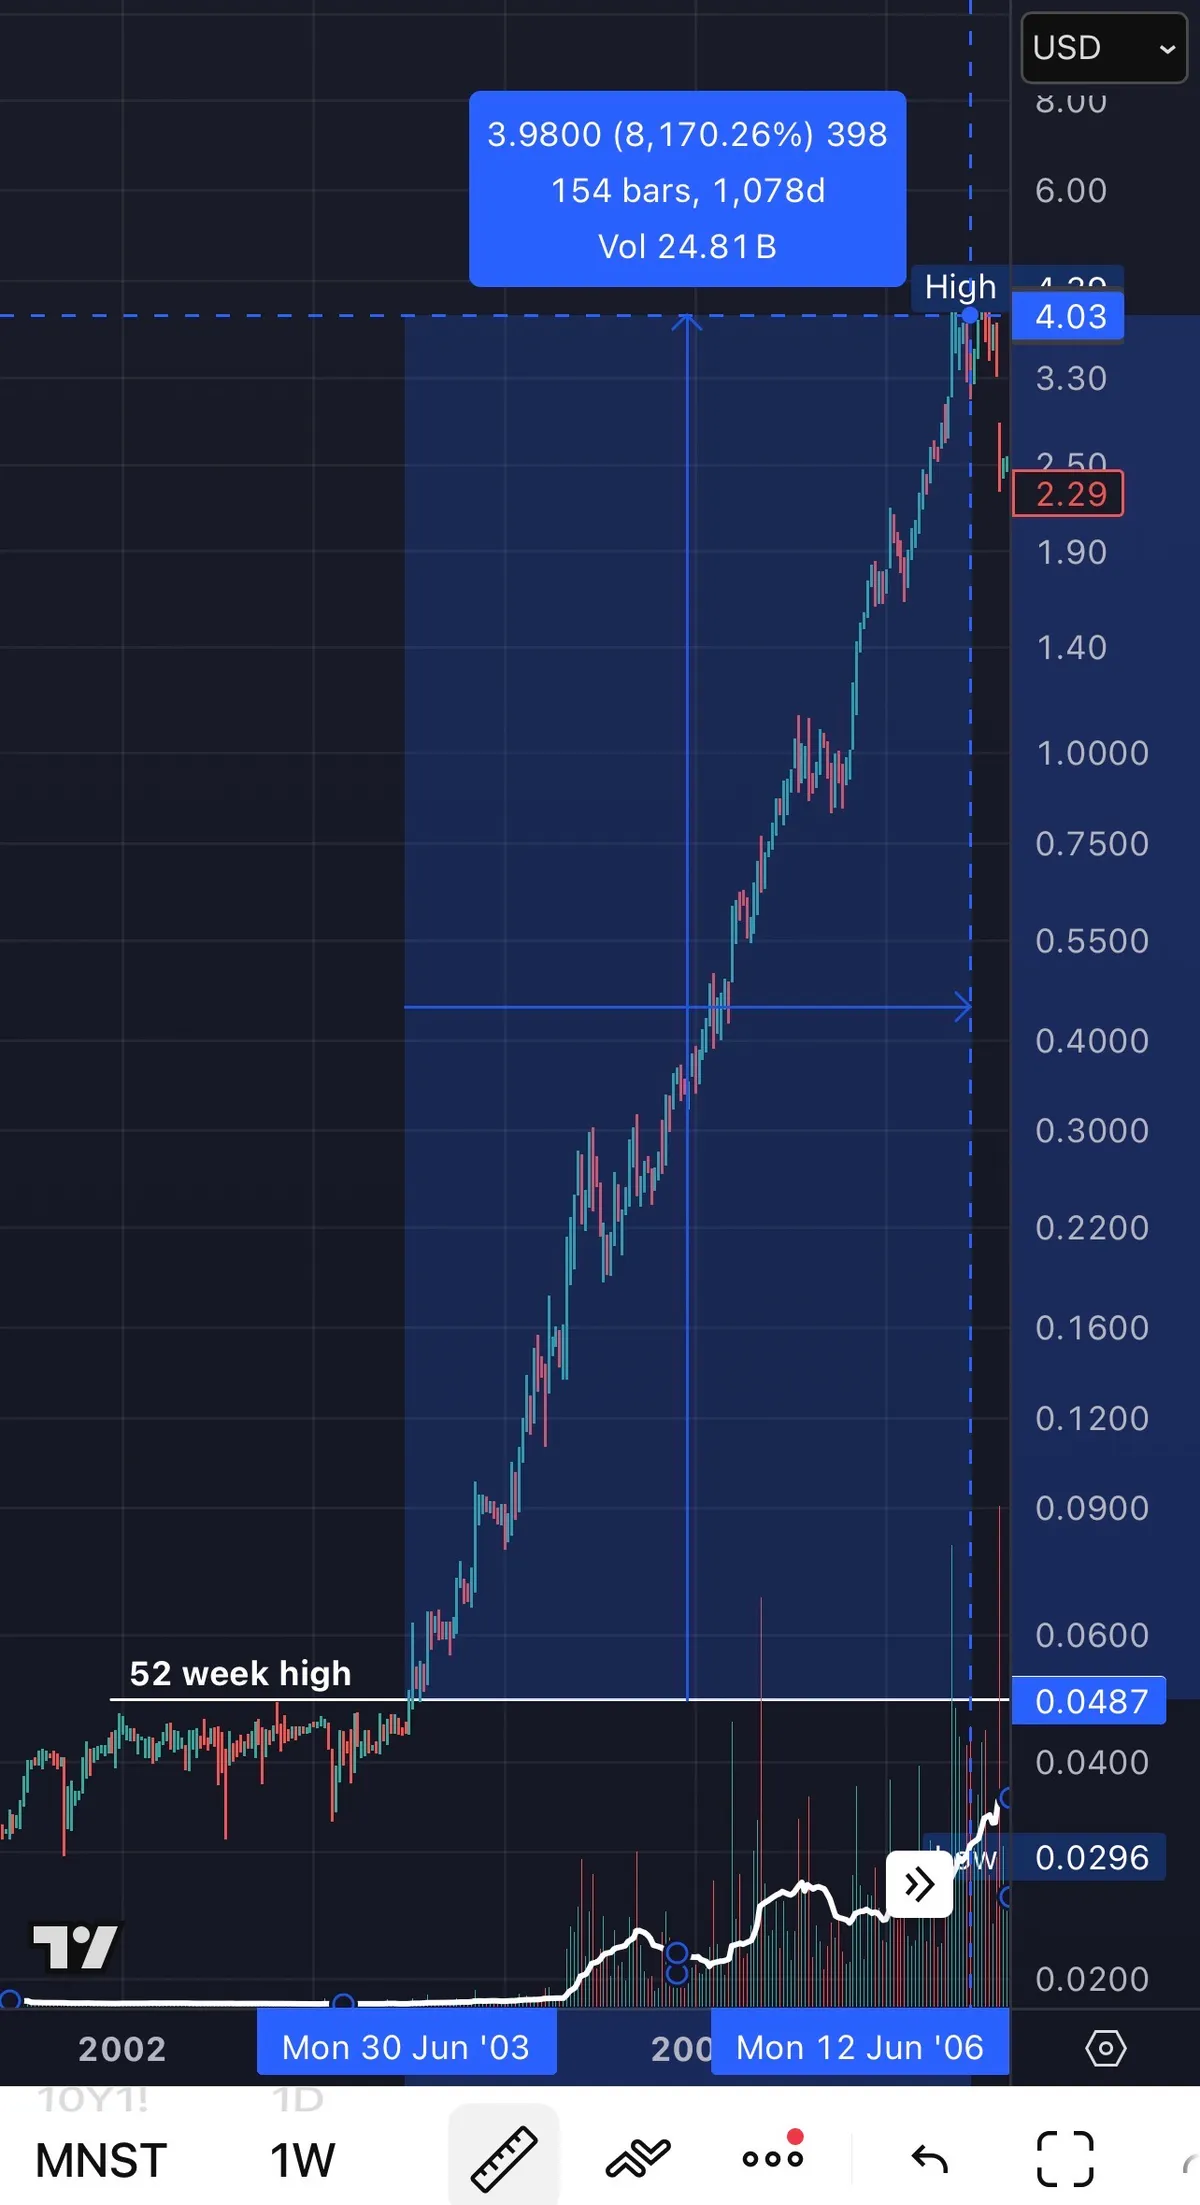
Minervini gives the example of Monster Beverage:

“Monster Beverage (MNST) registered an all-time high in late 2003. If you were afraid to buy the stock because it appeared too expensive or too ‘high,’ you would have missed a huge opportunity: The stock price advanced 8,000 percent by early 2006.”

Eight thousand percent.

And it started with a new high.

Here is the uncomfortable truth.

If you refuse to buy strength, you automatically eliminate the biggest winners from your portfolio.

Superperformance requires:

Breaking out

Consolidating

Breaking out again

Repeating the process

The stock that feels extended early in a cycle is often just beginning.

The crowd waits for pullbacks that never come.

Professionals understand something different.

Great stocks look expensive before they look obvious.

If you want superperformance, you must get comfortable buying strength.

Because the only way a stock becomes extraordinary is by making new highs all the way up.

View on Substack ↗

Last Year’s Leaders Are Slowing Down

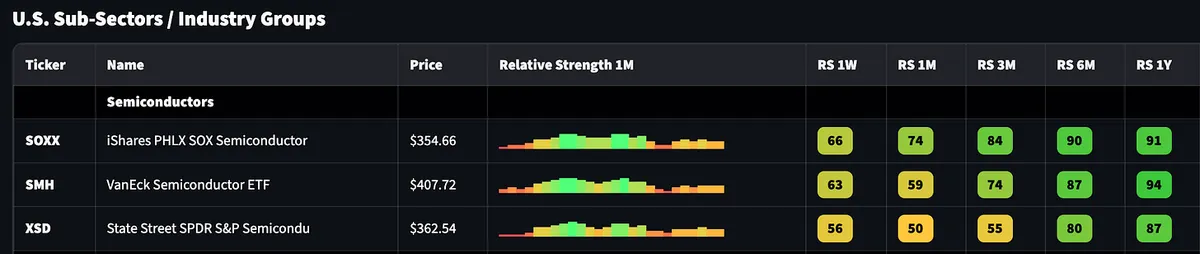
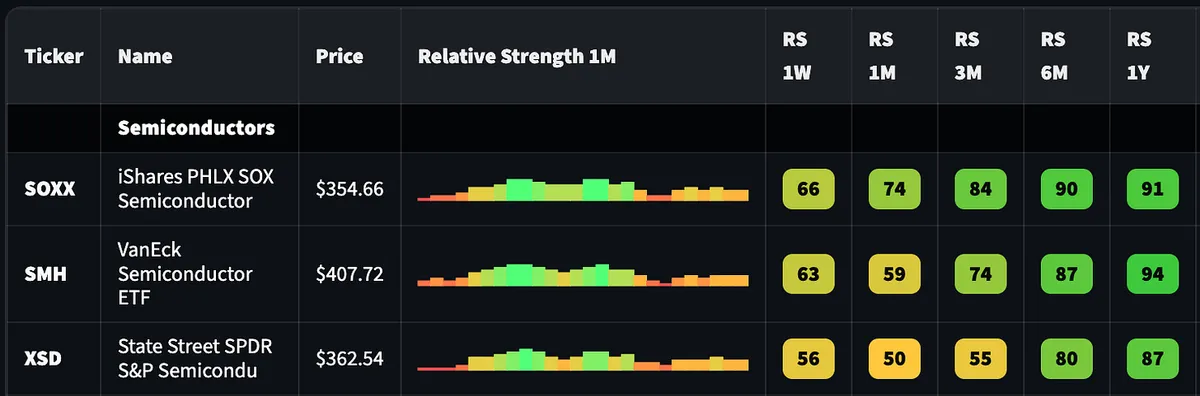
Semiconductors are no longer the clear leaders.

One year relative strength was in the 90s. Three months dropped into the 70s and 80s. Last week printed in the 50s and 60s.

That is deceleration.

Yes, there are still individual winners, but the group is no longer dominant.

Leadership is not about a few stocks making noise. It is about sustained institutional sponsorship across the group.

When the strongest group in the market begins to cool, you do not panic.

You observe.

You rotate with capital.

The question is simple:

Are you still trading last year’s leaders, or are you following where money is flowing now?

Rotation does not announce itself loudly. It shows up in relative strength before most traders feel it in their P&L.

Pay attention to the groups.

View on Substack ↗

Yesterday’s Leaders Become Tomorrow’s Laggards

You’re late to the party.

Look out below.

The same stocks that went up the most can go down the most.

Technology led the 1998 to 2000 bull market.

From 2000 to 2002, those same leaders became the biggest losers.

During the next bull market, they recovered only a fraction of what they lost.

Financials and housing led from 2003 to 2007.

In 2008, they suffered the steepest declines.

History is clear.

The leaders of one bull market are rarely the leaders of the next.

If history is any guide, former leaders should generally be abandoned as buy candidates during bear market recovery rallies and for the next bull market.

There is one exception.

If leadership stocks or sectors began emerging near the end of the prior bull cycle, they can sometimes continue into the next advance.

But that is not common.

Very often, the next bull market leaders emerge from the most unlikely areas.

They quickly reveal themselves through price.

Strong relative strength. Constructive bases. Powerful breakouts. Institutional demand.

Follow the leaders.

Buy strength.

Avoid laggards.

Because markets reward alignment with emerging leadership, not loyalty to the past.

View on Substack ↗

Leadership Is Measured, Not Assumed

The relative strength dashboard shows short-term deceleration in semiconductors.

That is information.

It is not a conclusion.

William O’Neil teaches that the biggest winners come from leading industry groups, and that you must stay aligned with true market leaders, not laggards .

Mark Minervini teaches that market leaders do one of two things during an advance:

“The price advance of the market leader will do one of two things: it will continue its advance while the group propels it even higher, or it will consolidate in a sideways fashion and digest its previous gains while the group and other stocks in the group play catch-up.”

Consolidation is normal.

Loss of leadership is confirmed.

O’Neil makes clear that leading stocks show deterioration before major tops and that you must recognize those signals through price and relative strength behavior .

Minervini is equally direct: a leader that begins to act abnormally, with loose price action or repeated failure, is no longer a leader.

Short-term relative strength cooling does not by itself prove leadership is over.

What proves leadership is over is:

• Sustained deterioration in relative strength

• Repeated distribution

• Failed breakouts

• Violation of key support levels

• Abnormal price and volume behavior

Until those conditions appear, the proper posture is observation, not prediction.

O’Neil and Minervini do not forecast tops.

They monitor leadership and react when evidence changes.

If semiconductors remain structurally sound, tighten up, and re-accelerate, that confirms ongoing leadership.

If relative strength continues to deteriorate and price action becomes abnormal, that confirms a change.

The rule is simple and unchanged:

Stay with leaders while they act like leaders.

Exit when they stop.

View on Substack ↗

Every Bull Market Is Dominated By One Sector And A Few Sub-Sectors

This is not opinion.

It is how markets work.

As Mark Minervini points out, a bull market is always dominated by at least one sector and several subsectors.

Always.

Capital does not flow evenly.

It concentrates.

Money crowds into themes. Themes create leaders. Leaders create momentum.

That is why we track sector and subsector relative strength.

Not because it sounds sophisticated.

Because it tells us where institutional money is flowing.

If a stock is strong but its sector is weak, odds drop.

If the sector is strong but the subsector is weak, odds drop.

But when:

• The overall market is in an uptrend

• The sector is leading

• The subsector is accelerating

• And the stock is breaking out

Now you have alignment.

That alignment is where outperformance lives.

We are not just buying stocks.

We are buying stocks inside the dominant theme of the bull market.

That is why our relative strength dashboard matters.

That is why we prioritizes leaders inside leading groups.

Bull markets do not reward random stock picking.

They reward concentration inside strength.

The question is simple:

Are you trading the strongest part of the strongest sector…

Or are you guessing?

View on Substack ↗

Earnings Quality Is What Separates Leaders From Pretenders

Strong earnings growth is important.

But earnings quality is what really matters.

In Trade Like a Stock Market Wizard, Minervini emphasizes that the biggest winners are backed by real, sustainable growth.

Not one-time accounting gains.

Not aggressive cost cutting.

Not a one-off product cycle.

Not one large customer order that temporarily inflates revenue.

True earnings quality means:

• Strong and expanding revenue growth backing the EPS

• Expanding profit margins

• Consistency across multiple quarters

• Broad customer demand, not concentration risk

• Institutional sponsorship increasing

If earnings are rising but sales are flat, be cautious.

If growth depends on one big contract, be cautious.

If margins are expanding while revenue grows consistently, that is powerful.

Institutions pay up for durability.

They want growth they can project forward.

The market rewards companies building something sustainable, not something temporary.

Quality creates conviction.

Conviction creates big moves.

View on Substack ↗

Acceleration Matters More Than Big Numbers

In Trade Like a Stock Market Wizard, Mark Minervini emphasizes something most investors overlook.

It is not just strong earnings and sales that drive big stock moves.

It is acceleration.

He writes:

“More than 90 percent of the biggest stock market winners showed some form of earnings acceleration before or during their huge price moves.”

Acceleration means growth is increasing quarter over quarter.

For example:

10% → 28% → 56%

That is powerful.

But 80% → 65% → 28%

Even though those are still strong numbers, that is deceleration.

And deceleration often marks the beginning of a stock topping process.

Minervini also makes clear that earnings should be supported by sales:

“In addition to strong, accelerating earnings per share growth, you want to see sales exhibit the same characteristics.”

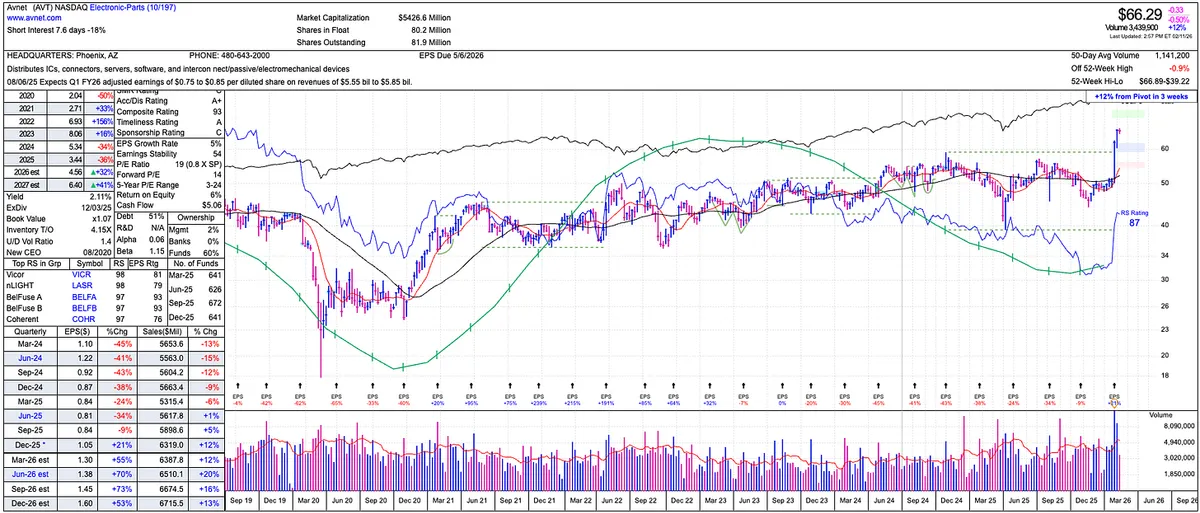
AVT is an example of this.

Estimates are improving.

Earnings growth is projected to accelerate.

Sales growth is turning higher.

That shift in trajectory is often more important than the absolute number.

Acceleration signals expansion.

Deceleration signals caution.

That is why I focus not just on good fundamentals, but on improving fundamentals.

It’s not just about finding growth.

It is finding growth that is speeding up.

View on Substack ↗

From RS Screener to Weekly Paid Newsletter to 55% Gain

We have been talking about buying pullbacks and upside reversals.

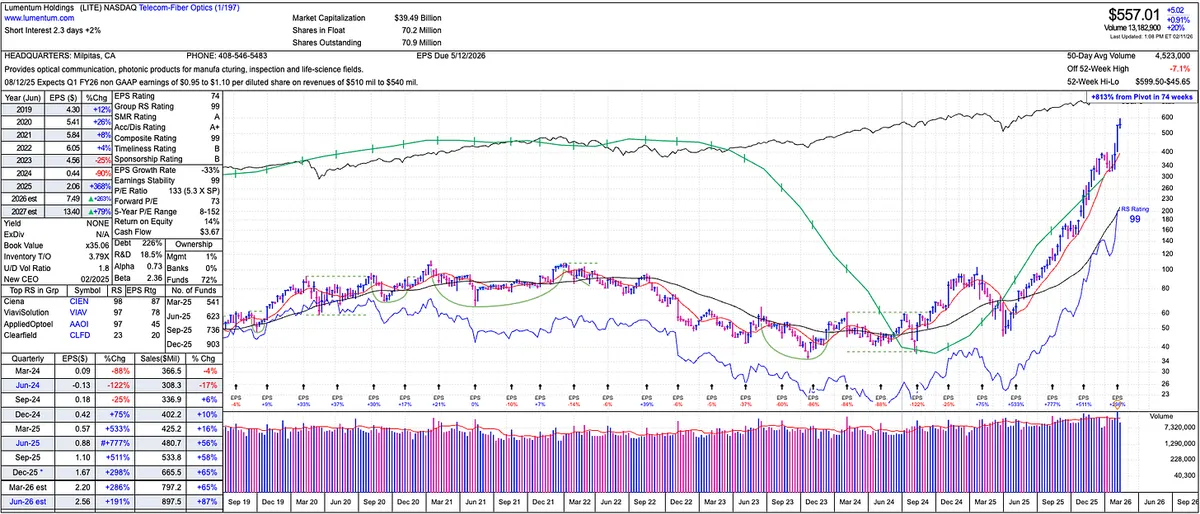
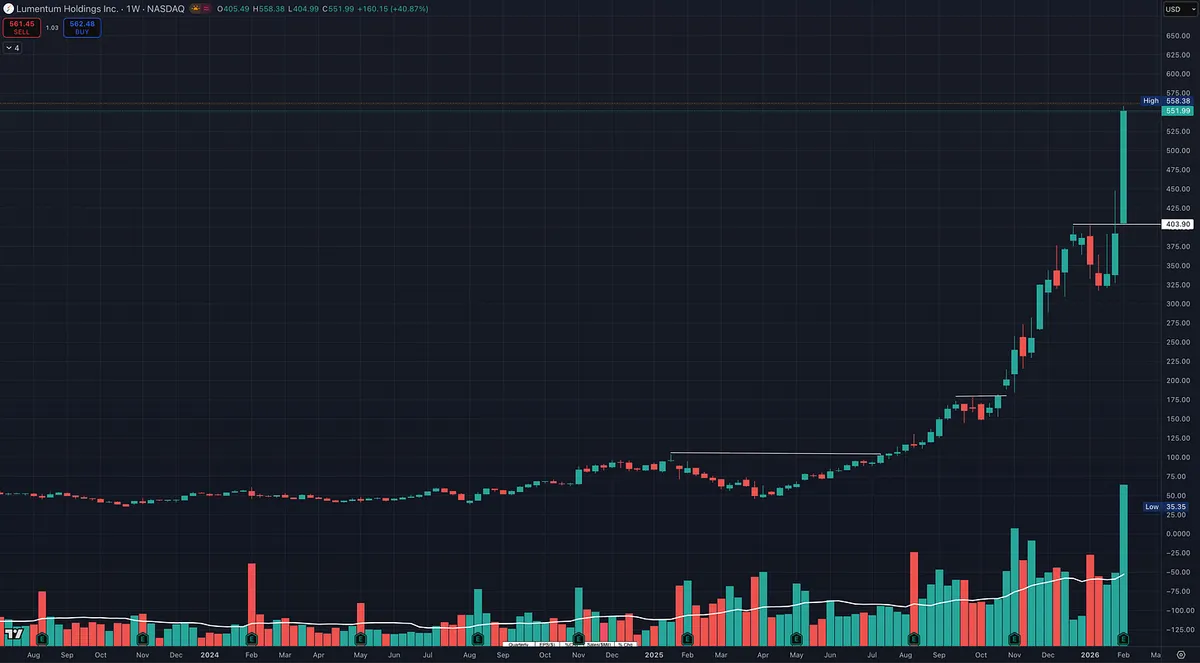
LITE just gave a textbook one.

What is interesting is how it first came onto our radar.

It showed up on our relative strength screener weeks before the breakout, while it was still setting up.

  • Top tier relative strength.

  • Strong on multiple timeframes.

  • Fund ownership accelerating.

  • Big earnings. Big sales.

You would have missed it on the MarketSurge O’Neil scan, which highlights the importance of casting a wider net. That is what I do when using the relative strength screener. First I scan for strength, then I dive into the chart and the fundamentals.

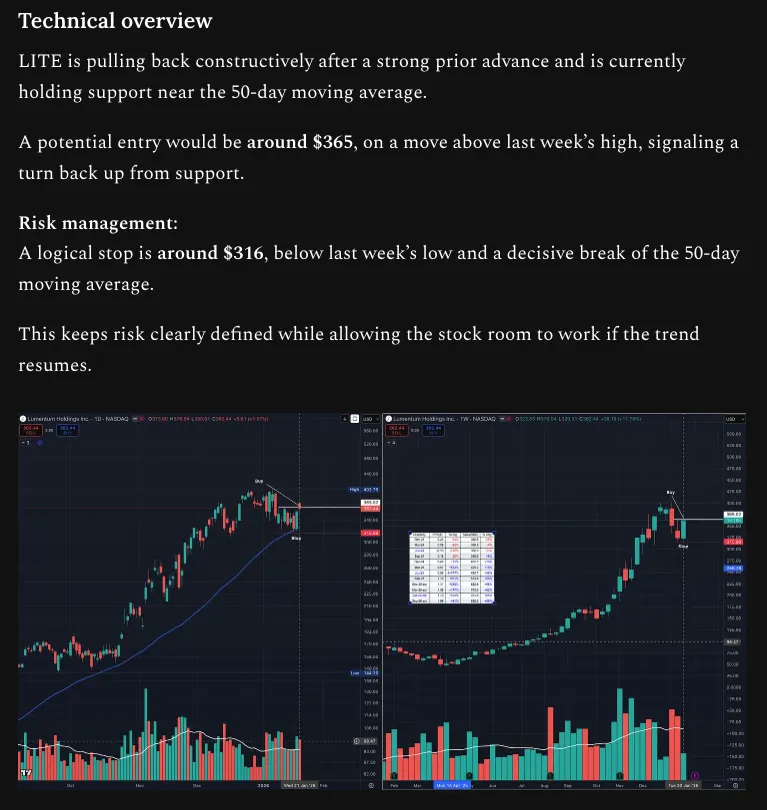
When we walked through this setup with paid subscribers, it was pulling back constructively after a strong advance and sitting near the 50 day moving average.

The plan was simple.

Entry around $365 on a move above the prior week’s high. Stop below the weekly low. We were also looking for follow through at the breakout level around $400.

We defined our risk, like we do with every trade.

No guessing.

Now it is up 55 percent from that area.

Here is the important part.

I am not some guru. I did not know LITE would be a winner. It simply met the criteria of big winners. Plenty of stocks meet the criteria and fail. When they do, I take a small loss.

But when a stock with elite relative strength sets up technically, offering a low risk, high reward opportunity, combined with strong CANSLIM type fundamentals, those are the kinds of names that can become major winners. You take them.

One stock like this can cover multiple failed attempts.

That is why we scan for strength.

Look for low risk, high reward technical setups.

Align with big sales, big earnings, accelerating fund ownership, and a bull market theme.

This is why we focus on process.

And that process produces the results.

View on Substack ↗

Transportation Shows Up

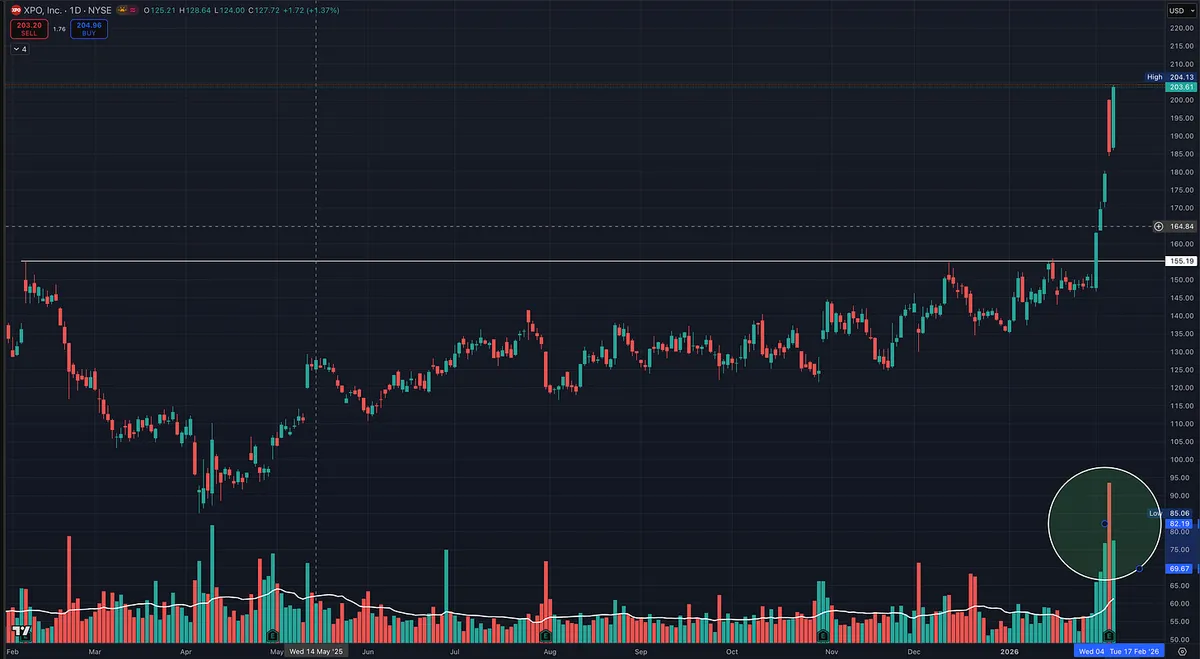
Transportation had a big week. Now the question is whether relative strength continues.

Leadership is starting to separate from the rest of the market.

One name to watch is XPO Logistics.

XPO broke out of a flat base with clear volume expansion.

That matters.

Big moves often start when:

  • a group shows strength

  • leaders emerge within that group

  • price breaks out on volume

View on Substack ↗

Follow the Leaders

“Follow the leaders.” Jesse Livermore

Livermore did not waste time on laggards.

He focused on stocks already proving themselves.

Leaders show strength first.

They attract demand first.

They move because demand is already there.

Weak stocks stay weak.

Cheap stocks stay cheap.

Hope does not change that.

Leadership is not a prediction. It is evidence.

Your job is to recognize it and align with it.

View on Substack ↗

Strength Looks Wrong to Most People

“What seems too high and risky to the majority generally goes higher, and what seems low and cheap generally goes lower.”

William J. O’Neil

This is where most traders get trapped.

They want bargains.

They want comfort.

They want to feel safe.

Strong stocks feel uncomfortable.

They look extended.

They feel late.

Weak stocks feel reasonable.

They look cheap.

They promise value.

O’Neil understood that price action tells the truth first.

Strength attracts more strength.

Weakness attracts more weakness.

That is why selection matters more than price.

“You want to buy the best merchandise in town.”

William J. O’Neil

Leadership is rarely cheap.

And cheap stocks are rarely leaders.

View on Substack ↗

“Buy the best merchandise available, not the poorest.” -William O’Neil

This single line explains why I am willing to buy stocks that look “overpriced.”

Most people are trained to look for cheap stocks. Low P/E. Big discounts. What feels safe.

The problem is that the market does not reward what feels safe.

The biggest winners are rarely cheap. They look expensive because they are growing fast, attracting capital, and already being accumulated by institutions.

Price is information.

Strong stocks trade at premium valuations because demand is overwhelming supply. That is not a warning sign. That is often the point.

Cheap stocks are usually cheap for a reason. Slowing growth. Weak demand. Broken trends. Hope instead of momentum.

I would rather pay up for strength than gamble on weakness.

Over time, the market pays you for owning the best merchandise, not the bargain bin.

That is how real leaders are built.