Momentum Trading Strategy

Notes

Finding Leading Stocks

What to buy: how to find, screen and rank the strongest stocks and industry groups.

Showing 201–220 of 299 notes

View on Substack ↗

Relative Strength Points You to the Leaders

Sometimes the easiest way to find a stock is to start with relative strength.

What is already outperforming everything else?

Focus on the top 1 to 2 percent of the market.

These are the names institutions are already accumulating.

I have found more leading stocks using this simple approach than any complex scan or strategy.

But here is where most traders go wrong.

Not every strong stock is immediately actionable.

Many times you will find great names that are extended or not properly set up.

That is fine.

Add them to your watchlist and be patient.

Once you identify the leaders, wait for them to set up again.

Strong stocks will often give you another opportunity after a pullback.

Look for higher lows.

Look for price tightening.

Look for price to find support at key moving averages.

Look for volume drying up as selling pressure disappears.

Look for price to move higher and volume expands.

This is how true market leaders behave in strong Stage 2 uptrends.

They make powerful, explosive moves, pause, then move higher again.

This cycle can repeat multiple times before the trend is finally exhausted.

We often make this process more complicated than it needs to be.

Find strength. Wait for a proper low risk, high reward setup. Then execute.

View on Substack ↗

Why Earnings, Sales, Margins, and ROE Matter in Growth Stocks

Most traders focus on the story.

The best traders focus on the numbers behind the story.

Not all fundamentals matter equally.

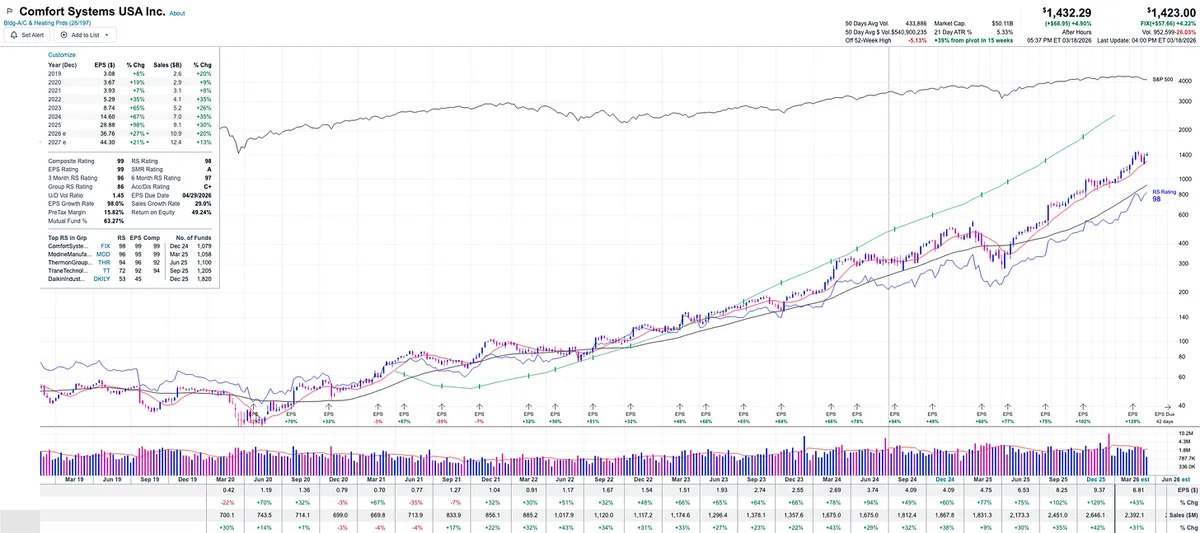
In growth stocks, four metrics consistently show up in the biggest winners:

Earnings growth

Sales growth

Margins

ROE

These are not random.

They tell you whether a company is truly scaling or just appearing strong on the surface.

Start with earnings.

Earnings growth is a clear signal that a company is becoming more profitable over time. It shows the business model is working.

But earnings alone are not enough.

They can be temporarily boosted through cost cutting or short term efficiency gains.

That can improve results for a period of time, but without real underlying demand, it does not last.

That is why sales growth matters.

Sales tells you if the growth is real.

It confirms that demand for the company’s product or service is expanding, not just that the company is managing expenses better.

When both earnings and sales are growing, you are looking at a company that is expanding and becoming more efficient at the same time.

That is a powerful combination.

You have real top line growth driving the business forward, combined with improving productivity that is fueling earnings.

Now look at margins.

Margins are a secondary confirmation of efficiency.

They show how well a company is converting revenue into profit as it scales.

Expanding margins tell you the company is gaining leverage as it grows.

But context matters.

Different industries operate with very different margin profiles.

The key is comparing margins to others within the same industry group.

The same applies to return on equity.

ROE measures how effectively management is using capital to generate returns.

High ROE within a peer group is often a sign of a superior business model.

This is exactly what institutions are looking for in growth companies.

There are many fundamental metrics in the market, but not all of them apply to growth investing.

For institutions focused on growth, these are the metrics that matter most.

Strong demand

Improving profitability

Operational efficiency

Effective capital allocation

When these align, and price confirms, you are often looking at a true leader.

View on Substack ↗

Why Growth Stocks Offer a Bigger Edge

Most people assume the market is fully efficient.

It is not.

And the inefficiency is not evenly distributed.

Large, mature value companies are heavily covered. They have predictable business models. Cash flows are stable. Analysts have years of data to work with.

That makes them easier to model.

Estimates tend to be tighter. Expectations are more accurate. There is less room for surprise.

That means less opportunity.

Growth companies are different.

They are earlier in their lifecycle. They are changing quickly. New products, new markets, shifting demand.

This makes them harder to predict.

Analysts are often behind. Estimates are frequently wrong. Revisions come late.

This is where the edge comes from.

When a company begins to accelerate earnings and sales, the market starts to recognize it before the models fully adjust.

Institutions move early. Price begins to trend. Then analysts catch up.

That gap between reality and expectations is where the biggest moves happen.

This is why the greatest winners are almost always growth stocks.

Not because they are “better” companies.

But because they are less efficiently priced.

And in markets, inefficiency is opportunity.

View on Substack ↗

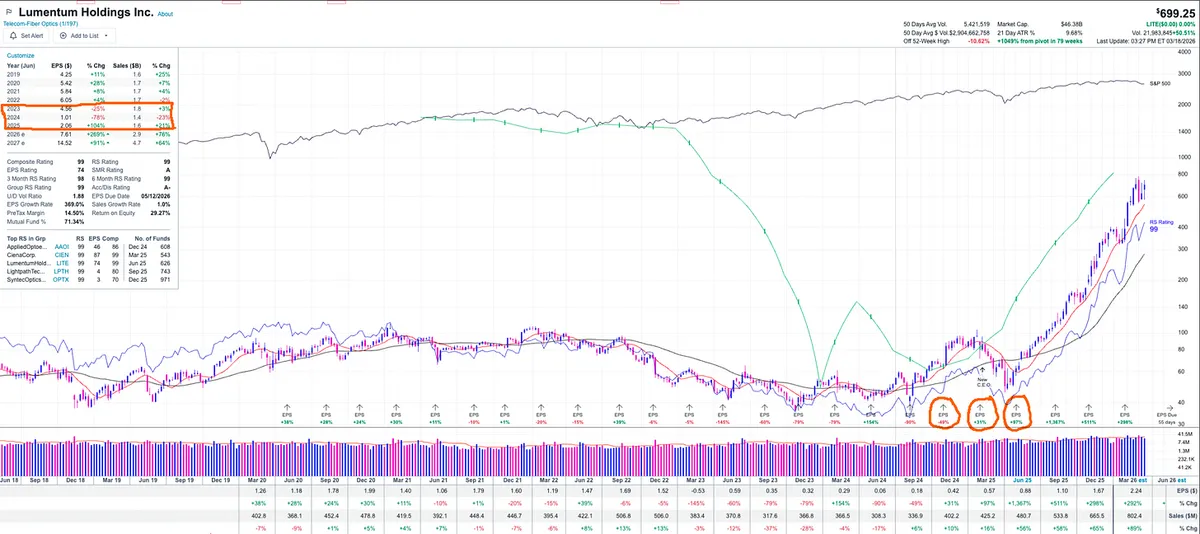
LITE Earnings Turnaround Before the Breakout

Most traders wait for perfect earnings. The market does not.

LITE spent two years with weak and declining earnings. Growth slowed. Some quarters turned negative. Nothing looked attractive.

Most people ignored it.

Then the shift happened.

Before the major move in 2025, earnings flipped. Negative quarters improved and turned positive. Then growth began to accelerate.

Annual earnings surged into triple digit growth.

But there is another layer most traders miss.

Both Mark Minervini and David Ryan have pointed out that during major turnarounds, analysts are often behind the curve. Their estimates tend to be too conservative.

Price begins to move as institutions recognize the change early, while analysts are still catching up or providing conservative estimates.

The stock did not wait for perfect fundamentals. It moved when the trend changed.

This is what matters.

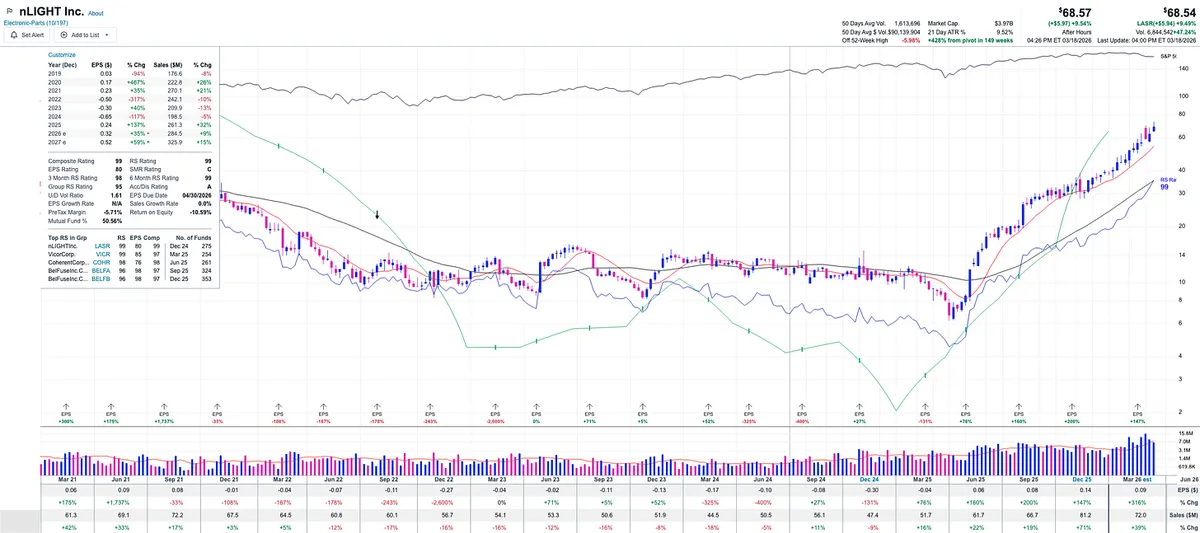
Not just strong earnings, but improving and accelerating earnings.

Watch for earnings turnarounds.

View on Substack ↗

Why MU Keeps Showing Up

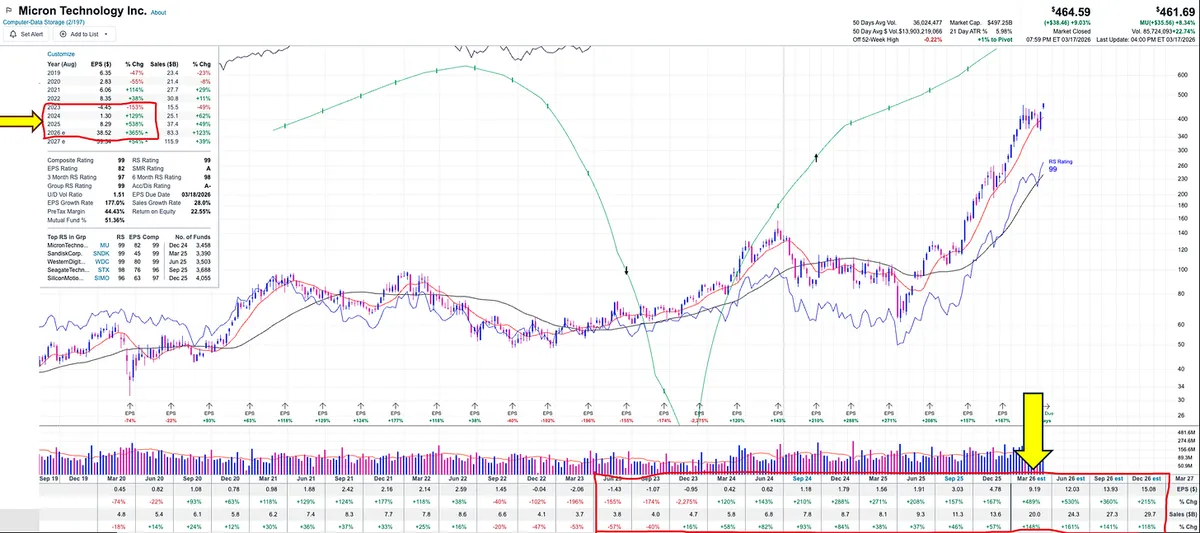
There is a reason I keep bringing up Micron in the Substack chat.

Look at what is happening under the surface.

Earnings and sales are not only strong, they are improving quarter after quarter. That is the key.

Now combine that with:

• A leading industry group, one of the strongest in the market

• Return on equity around 22%

• Expanding margins above 40%

• Relative Strength Rating of 99

• Increasing institutional ownership quarter over quarter

The stock continues to find support at the 50-day and 10-week moving averages and pushes higher.

This is what a true leader looks like.

View on Substack ↗

Earnings Acceleration Matters

Big earnings and sales growth can absolutely drive stocks higher.

You will see stocks with strong numbers move, even without perfect acceleration.

But this is where many traders get confused.

Sometimes a company reports:

• Big earnings

• Big sales

• Strong margins

And the stock drops or goes nowhere.

Why That Happens

Because the market is forward-looking.

It is not just about how big the numbers are.

It is about whether they are improving or slowing.

If growth is:

• Peaking

• Decelerating

• Already expected

Then it may already be priced in.

Institutions may even be selling into those strong reports.

What Acceleration Tells You

Acceleration is not required for every move.

But it is an important piece of the puzzle.

Minervini and David Ryan look for:

3 quarters of accelerating earnings and sales, along with 1–2 quarters of strong forward estimates

Especially early in a move.

Important Detail

Acceleration does not need to start from strong numbers.

It can begin from weakness.

For example:

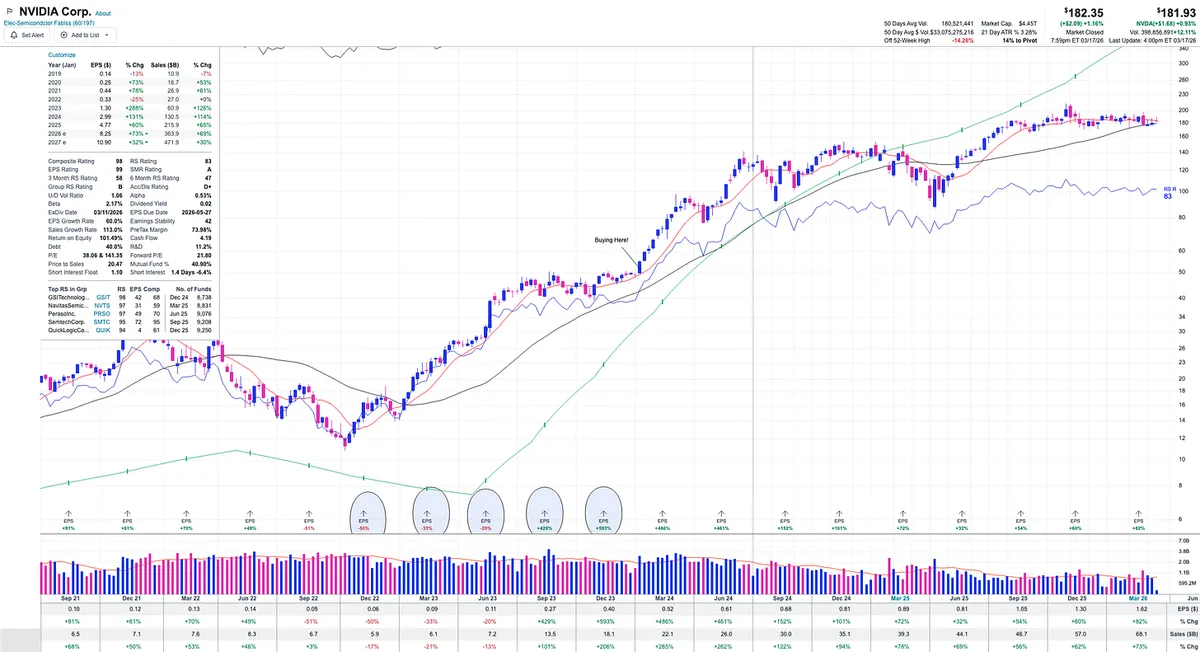
-50% → -33% → -20% → +429% → +593%

That is powerful acceleration.

Each quarter is improving, even before the numbers turn positive.

Then once they do, the growth expands rapidly.

This is often where institutions begin building positions.

The Sweet Spot

Acceleration in the first few quarters of a move can signal:

• The trend is building

• Demand is increasing

• Institutions are accumulating

This typically occurs before the major breakout.

Not too early

Not too late

NVDA Example

NVIDIA showed multiple quarters of improving earnings and sales before its major breakout.

The numbers did not start perfect.

They improved, then turned positive, then accelerated aggressively.

You can see on the chart that the stock began its move higher while earnings were still negative, but improving. The first two major positive earnings reports occurred during a period of tight consolidation. From there, the stock broke out and advanced roughly 50% before the third major earnings report.

Takeaway

Big earnings matter and strong numbers can move stocks.

But acceleration provides additional context.

Improving numbers, especially when growth is building and gaining momentum, often signal the move before it happens.

By the time the numbers look obvious, the move is usually already underway.

View on Substack ↗

Never Trust the Story. Trust the Price.

Years ago, I heard both David Ryan and Mark Minervini make a point that has stuck with me ever since.

Yes, they both place heavy emphasis on CANSLIM-style fundamentals

Big earnings

Big sales growth

Strong margins and ROE

But they also emphasized one rule that overrides everything else:

Never trust the story. Never trust the fundamental numbers unless they are confirmed by price action.

What does that mean in practice?

It means:

If the chart looks weak

If price is not acting right

If the stock is not behaving like a true leader

Then none of the rest matters.

Not the CEO narrative

Not the analyst upgrades

Not the media hype

Not even the strongest earnings report

There is no trade.

This is coming from two U.S. Investing Champions who built their careers on performance, not opinions.

And they are not alone.

You will hear this same principle repeated by many of the most successful traders:

Price is the final judge.

Fundamentals may tell you what should happen

The story may tell you what could happen

But price tells you what is actually happening

And in this game, that is all that matters.

If price and volume do not confirm the fundamentals and story, the market is telling you something is off.

Listen to it.

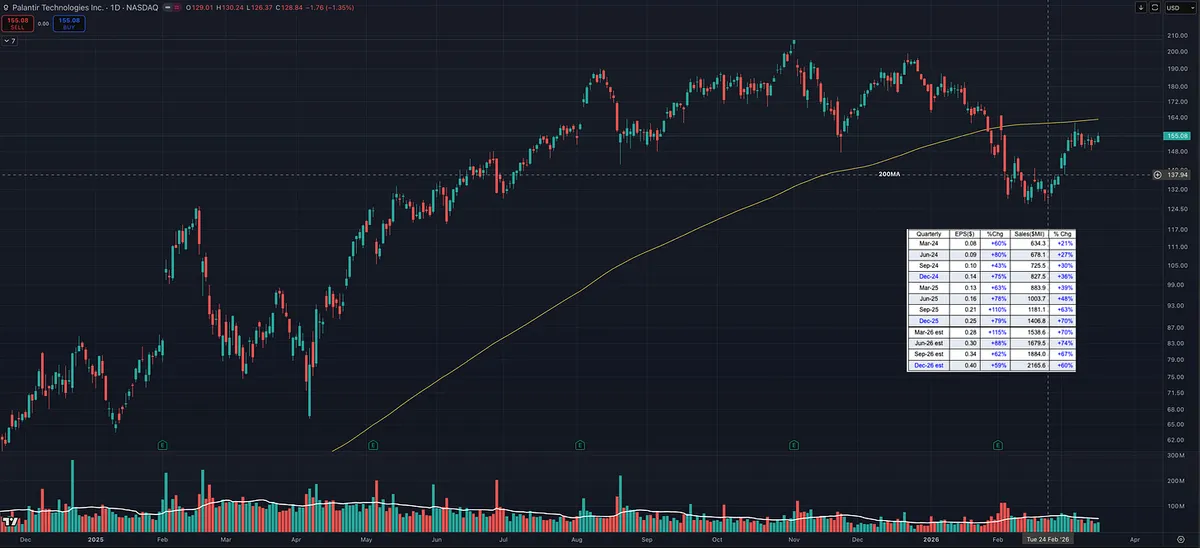
Need an example….. look at PLTR and CRDO.

View on Substack ↗

Stop Scanning Random Stocks. Do This Instead.

Stan Weinstein’s “Forest to the Trees” method that quietly finds the highest-probability breakout stocks.

Most traders open their charts and start here:

Stocks.

They scroll… scan… and hope something “looks good.”

But the traders who consistently catch monster breakouts follow a completely different process.

Stan Weinstein called it:

The “Forest to the Trees” approach.

And once you see it, your brain immediately goes:

Yeah… that actually makes way more sense.

Because it aligns with how probability actually works in markets.

Step 1 — Start With the Forest (The Market)

Before looking at a single stock, ask one question:

Is the market healthy?

The best traders want the market wind at their back.

Most stocks follow the general market direction, which is why market trend analysis is foundational to successful stock selection.

If the environment is hostile, even great stocks struggle.

Step 2 — Find the Strongest Groups

Money does not move randomly.

It moves in themes.

When institutions accumulate stocks, they often accumulate entire sectors.

That is why the biggest winners tend to emerge from leading industry groups, not isolated names.

So the next filter becomes simple:

Where is the money flowing?

Step 3 — Find the Best Stock in That Group

Only now do you zoom into individual stocks.

Inside the strongest groups, you look for:

• Tight consolidations

• Strong relative strength

• Institutional accumulation

• Clean breakout levels

• Asymmetric risk vs reward setups

At this point you are not randomly scanning anymore.

You are selecting from the strongest part of the market.

Step 4 — Remember: This Is a Probability Game

Even with perfect analysis…

You will still be wrong.

Markets are not about certainty.

They are about probabilities.

The edge comes from two simple rules:

Cut losers fast. Let winners run.

One Idea That Changes How You Find Big Winners

Most traders start with a stock.

Professionals start with the market.

Market → Sector → Stock → Breakout.

The forest leads you to the trees.

View on Substack ↗

Most Traders Pick One Side of Market Analysis. The Best Traders Use Both.

I hear a lot of people talk about big-picture macro data, market cycles, interest rates, sentiment, and all the top-down market stuff. But when it comes time to actually pick individual stocks, they struggle.

Then I hear the opposite crowd.

They talk nonstop about stock selection. Breakouts. Chart patterns. Individual companies. But they completely ignore the broader market environment.

Both approaches miss something important.

The edge comes from combining both.

My philosophy is simple.

Top-down analysis plus bottom-up refinement.

Top-down analysis helps us understand the market environment. Every weekend I step back and analyze the market from a big-picture perspective. I want to understand what the overall environment looks like before focusing on individual opportunities.

This idea aligns with William O'Neil's concept of the M in CANSLIM, which emphasizes understanding the market direction before selecting stocks.

It also incorporates ideas from Martin Zweig, author of Winning on Wall Street. Zweig focused heavily on the larger forces that drive bull and bear markets.

Many legendary traders followed Zweig's work. Traders from very different styles including Richard Dennis, Paul Tudor Jones, Michael Marcus, Bruce Kovner, and even short-term momentum trader Marty "The Pit Bull" Schwartz referenced his research.

But top-down analysis alone is not enough.

Traders like Mark Minervini often point out that many times the individual stocks themselves begin to reveal changes in the market before the major indexes do.

Leadership stocks breaking down. Breakouts suddenly failing. Relative strength shifting across sectors.

These signals often show up before the broader indexes reveal what is happening.

That is why bottom-up analysis matters.

By studying individual stocks, sector leadership, and relative strength, we can often detect subtle shifts in the market's character.

Interestingly, this principle exists across every timeframe.

Many professional day trading firms conduct top-down market analysis, even though they trade on intraday charts. Understanding the environment improves their probabilities.

At the same time, swing traders and position traders zoom down into lower timeframes and analyze individual stocks to refine their entries.

In other words:

Day traders zoom out to understand the environment.

Swing traders zoom in to refine execution.

Both directions matter.

The real edge comes from combining both perspectives.

Top-down tells you where the wind is blowing.

Bottom-up helps you pick the fastest sailboat.

Ignore either side and you are trading with incomplete information.

Combine both and you dramatically improve your probabilities.

This is exactly what Module 3 and Module 4 of the Momentum Trading Strategy Course will cover and is free for paid subscribers.

Module 3 covers top-down analysis and the Big Picture Market Pulse.

Module 4 covers bottom-up stock level refinement and identifying the strongest leadership opportunities.

If you haven’t started the course yet, Modules 1 and 2 are already available.

View on Substack ↗

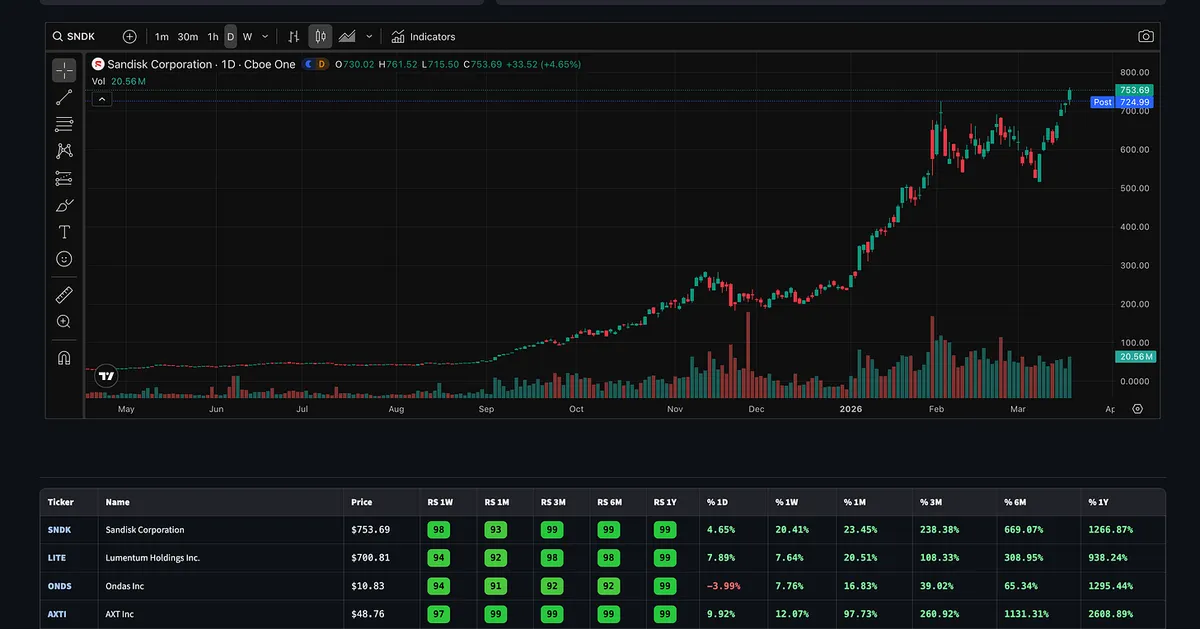
Sometimes the easiest way to find winning stocks is Relative Strength

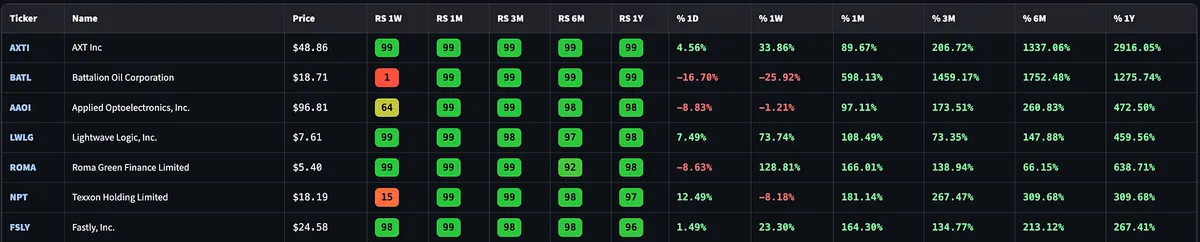
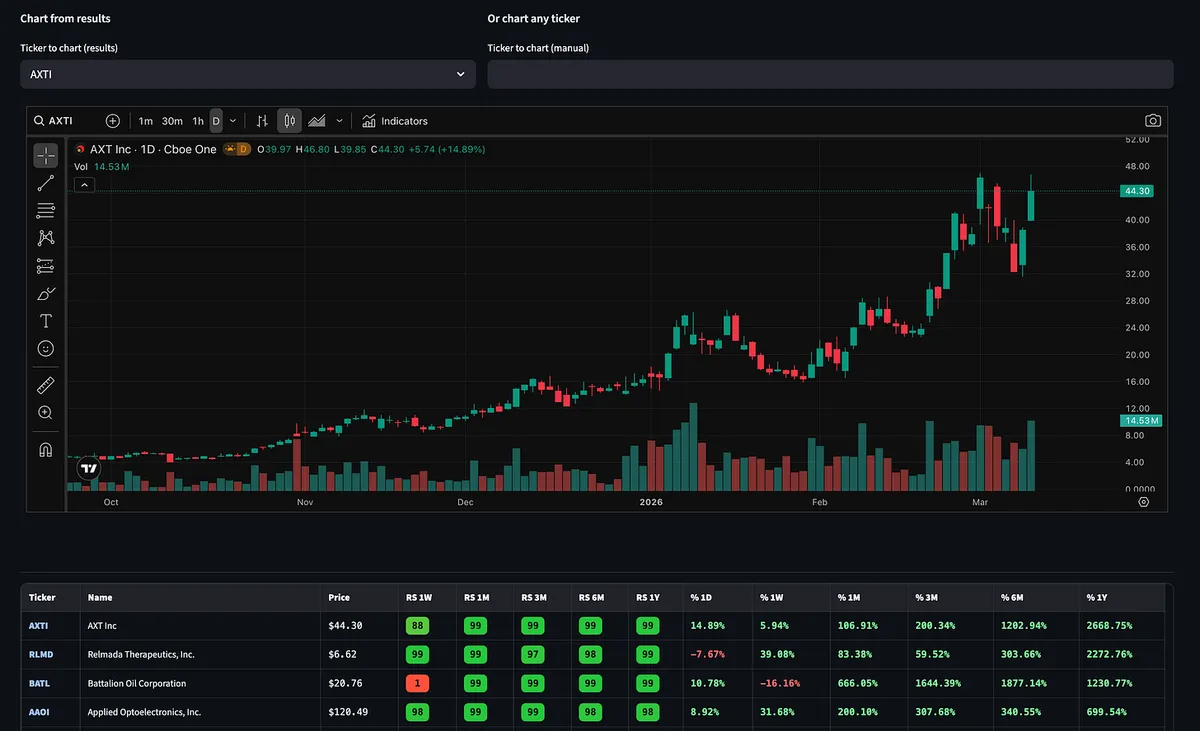
One of the simplest things I do regularly is run a Relative Strength screener.

Not complicated.

Just looking for stocks that are outperforming the market across multiple timeframes.

When a stock shows up with RS near the top across the board, it’s usually telling you something important.

Institutions are accumulating it.

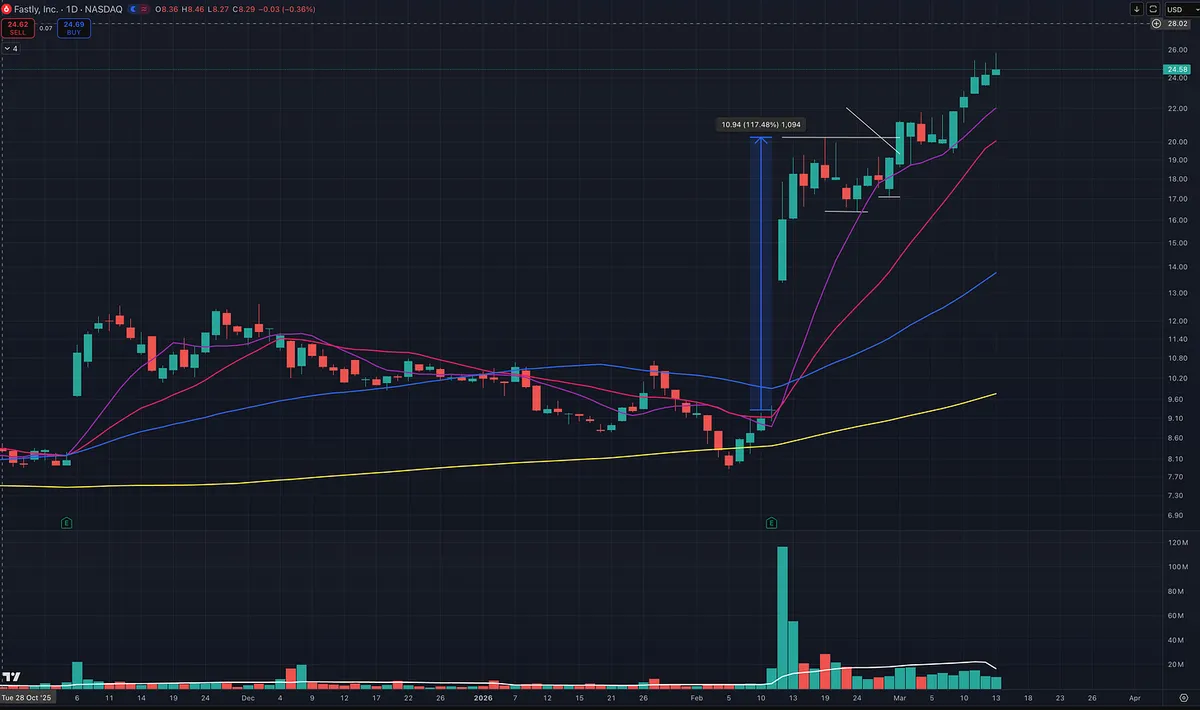
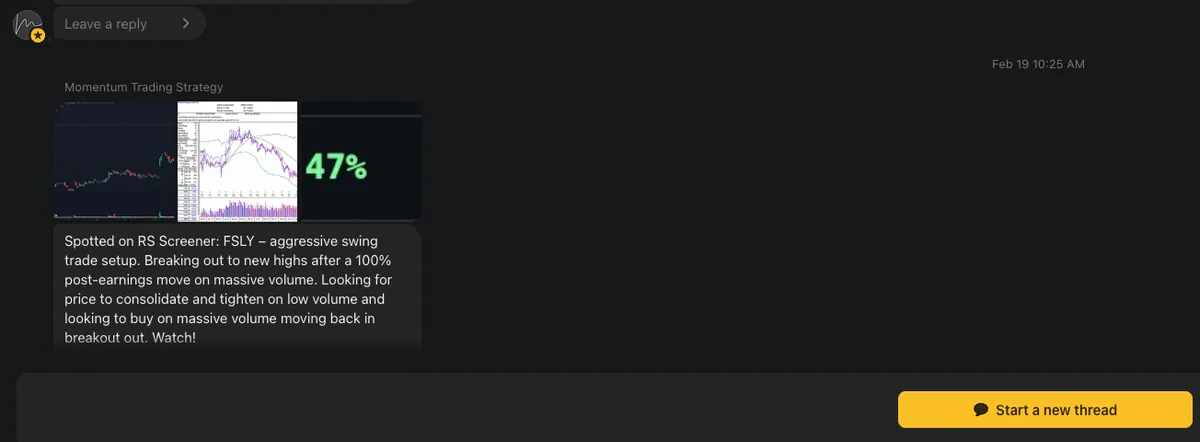
A recent example was FSLY.

After a big earnings gap on heavy volume, it immediately showed up on the RS screener and went on watch.

When you see a move like that, the playbook is pretty simple.

Wait for the stock to tighten up and look for a continuation move.

That’s exactly what happened.

The stock consolidated after the earnings gap and found support at the 10-day moving average, which is often where strong momentum names defend during powerful trends.

From the time it was mentioned in the subscriber chat back in February, the stock has continued to show strength and is now up more than 35%.

This type of move is very similar to what traders like Kristjan Kullamägi call an Episodic Pivot.

A major catalyst hits. The stock gaps up on huge volume. Then strong relative strength keeps it near highs.

Often the next opportunity comes when the stock tightens up and continues higher.

You don’t need complex indicators or screens.

Many times the big winners are simply the stocks already showing the most strength.

That’s exactly what Relative Strength helps you find.

View on Substack ↗

The Easiest Edge Most Traders Ignore 

If you do not know what is making new highs, you do not know where money is flowing. 

It is that simple. 

William O’Neil built his entire career around this idea: 

The biggest winners were near new highs before they made their biggest moves. 

Not near 52 week lows.  Not “cheap.”  Not “oversold.” 

Near new highs. 

Why? 

Because strength is not random. 

Stocks making new highs are under accumulation. 

Institutions are stepping in.  Supply is being absorbed.  Demand is overwhelming resistance. 

The new high list is not a list of stocks that are extended. 

It is a list of leadership. 

When you screen properly and review new highs daily, three things happen: 

  1. You start to see themes before the crowd does. 

  2. You recognize which sectors are actually leading. 

  3. You train your eye to focus on strength instead of weakness. 

Most traders waste hours scanning broken charts. 

Professionals scan for relative strength. 

You do not need to predict the next leader. 

You need to study the current ones. 

In strong markets, the new highs list expands. 

In weak markets, it shrinks. This is why I track it every week on my Big Picture Market Pulse.

That alone tells you more about conditions than most headlines ever will. 

If you want to trade like a professional, make this a daily habit: 

Run your screens.  Study the new highs.  Mark the tight ones.  Build a watchlist. 

Leadership leaves footprints. 

Your job is to follow them.

View on Substack ↗

What Actually Makes a True Market Leader

Many traders assume the biggest winners in the market are the largest companies or the most famous brands.

But that’s rarely how the market actually works.

William O'Neil explained it clearly:

“The number one market leader is not the largest company or the one with the most recognized brand name; it’s the one with the best quarterly and annual earnings growth, return on equity, profit margins, sales growth, and price action.”

In other words, the market rewards performance, not popularity.

The biggest stock winners usually share the same characteristics:

• Explosive earnings growth

• Strong sales growth

• High return on equity

• Expanding profit margins

• Powerful price momentum

When these fundamentals align with strong price action, that’s when institutional money begins flowing into a stock.

And when institutions accumulate shares, price trends can persist far longer than most people expect.

This is why many of the biggest market winners look “expensive” to the average investor.

But in reality, they’re simply companies with the strongest growth and leadership.

Instead of searching for the cheapest stocks in the market, professional traders focus on finding the true leaders.

Because historically, the biggest winners are almost always the companies with the strongest growth and the strongest price action.

View on Substack ↗

The Simple Screener That Finds Momentum Breakout Stocks

One of the biggest questions traders ask is:

“How do you actually find these breakout stocks before they move?”

The answer is simpler than most people think.

You start by narrowing the market down to the strongest stocks already showing leadership.

One of the fastest ways to do that is by using a Relative Strength Stock Screener.

This is the same basic idea used by momentum traders like Kristjan Kullamägi when searching for breakout setups.

The Simple Process

Use a relative strength screener and sort stocks by performance.

Move the rank by timeframe to 1 or 3 months, then set the filter to 98 or higher.

That shows you the top performing ~2% of stocks in the market.

Those are the names you want to study.

Why This Works

Because the biggest winners tend to behave in a very specific way.

As Kristjan explains:

“If you study thousands of the biggest winning stocks over the past 100 years they tend to move in stair steps. Meaning they will make a 20–50%+ move, pull back and go sideways for a while, then make another move.”

That stair-step behavior is where momentum traders find their edge.

A stock makes a strong move. Then it pulls back and consolidates. Then it breaks out again.

Those consolidations are where many of the best breakout setups form.

The key is focusing on stocks that are already proving themselves as leaders.

That’s why scanning for the top 1–2% performers is so powerful.

What to Look For Next

Once you identify leaders, start watching for technical setups such as:

• Tight consolidations

• Volatility contractions

• High tight flags or pennants

• Higher highs and higher lows

• Flat base breakouts

Other patterns that often appear in strong leaders:

• Ascending triangles

• Darvas boxes

• Wedges

• Parabolic curves

And always watch the volume behavior:

• Volume drying up during pullbacks or consolidations

• Heavy volume expansion on breakouts

This is one of the easiest ways to build a watchlist of potential momentum leaders before they make their next move.

In fact, this exact process is how I spotted LITE before it went on to move over 100%.

For Paid Subscribers

For those inside the paid subscription, you already have access to the Relative Strength Screener tool that automatically filters for these types of stocks.

It’s one of the simplest ways to quickly narrow thousands of stocks down to a handful of high-probability breakout candidates, the same type of setups momentum traders like Qullamaggie focus on.

If you're more CANSLIM / position trader focused, you can slightly loosen the relative strength filter and add Sales and Earnings growth to your screen.

Another option is to use the Super Performer preset in the screener, which combines several of those fundamental growth filters.

You’ll find the screener inside the Momentum Trading Strategy section for paid subscribers.

View on Substack ↗

What a True Stock Market Winner Looks Like Before the Breakout (Apple 2004)

Just like William O’Neil, Mark Minervini provides countless examples of what we should be hunting for before a breakout and what a true big winner looks like.

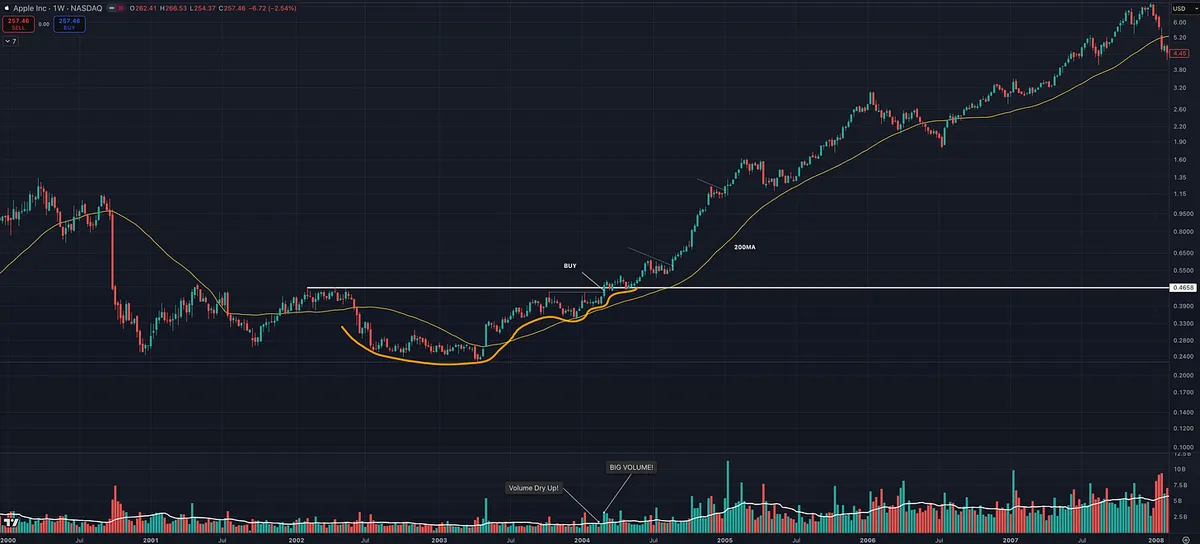
Apple in 2004 is a perfect example.

Coming out of the dot-com bust, Apple was reinventing itself with Steve Jobs driving new innovation, which represents the “N” in CAN SLIM. The company launched the iTunes Music Store in 2003, followed by the explosive success of the iPod, and then the iPod Mini in 2004.

Fundamentally, the story was improving quickly. Apple had returned to positive earnings, rising sales, and increasing future estimates, making it a clear turnaround story.

Now look at the chart.

We see explosive volume off the bottom in 2003, followed by the classic structure of higher highs and higher lows as the stock climbed the right side of the base.

Notice the key characteristics:

• Tight pullbacks on light volume

• Volume drying up near the lows

• Heavy accumulation on the advance

• Big volume expanding as the stock approaches new highs

This type of price and volume action signals institutional accumulation.

When Apple finally breaks out to new highs, it provides exactly what great traders are looking for:

A low-risk, high-reward entry into a potential big winner.

View on Substack ↗

Why I Mentioned AAOI Before Earnings

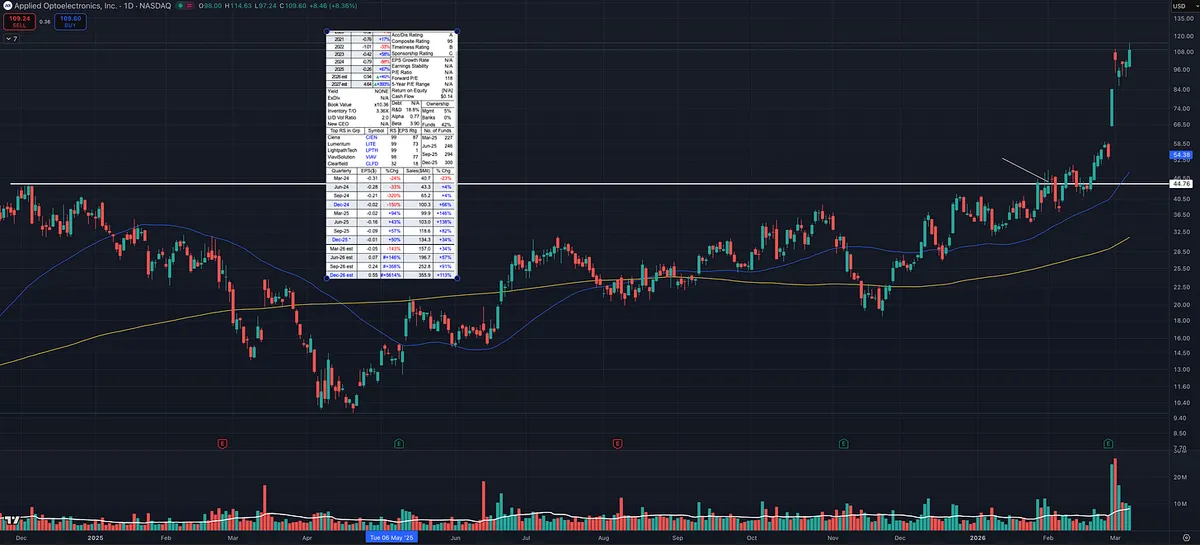
Someone asked why I mentioned AAOI in early February with earnings coming up.

First, the stock checked several boxes I look for.

It was in a HOT group (telecom) showing strong relative strength across multiple timeframes. I had already seen success with LITE and CIEN, which are in the same space. It reminded me of past industry runs like the computer data storage group when SNDK, MU, WDC, and STX all moved together.

AAOI also had:

• Strong earnings and sales acceleration

• Rising forward estimates

• Accelerating fund ownership

• Tight price action on the right side of the chart

• Trading near new 52 week highs

Since that mention the stock has moved about 150%, but the trade management is the important part.

I normally do NOT buy a stock a few days before earnings. There is too much risk and no time to build a cushion.

I follow the advice from Paul Tudor Jones:

“Never trade in situations where you don’t have control. For example, I don’t risk significant amounts of money in front of key reports, since that is gambling, not trading.”

In this case there were about three weeks before the report, which gave the trade time to work.

From the original buy, the stock moved roughly 30% before earnings.

At that point the plan becomes simple:

• Trim a large portion before the report

• Lock in gains and reduce risk

• Hold a smaller position into earnings

Even great stocks can drop 15–20% overnight on earnings.

By trimming beforehand, the position already has a profit cushion, so the remaining shares carry much less risk.

This is something I learned studying the playbooks of William O’Neil, Mark Minervini, and David Ryan.

The goal isn’t predicting earnings.

The goal is managing risk while letting strong stocks work in your favor.

View on Substack ↗

The Leaders Bottom First

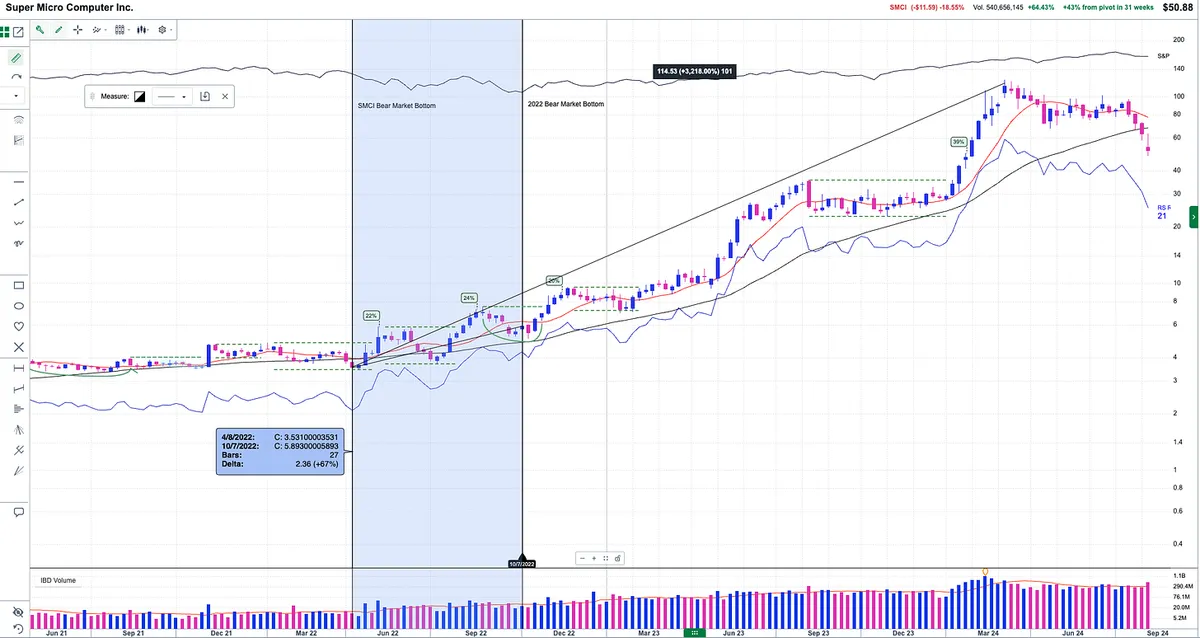
While the market was still falling in 2022, the biggest winner of the next cycle had already turned.

This is exactly what Mark Minervini talks about in Think & Trade Like a Champion. True leaders often bottom before the indexes and start building higher lows while everyone else is focused on the bear market.

Look at SMCI.

• April 2022 — SMCI bottoms

• October 2022 — S&P 500 finally bottoms

During that same period, SMCI had already rallied about 70%.

While the market was still weak, the stock began doing what leaders do:

• Forming higher highs and higher lows

• Holding key moving averages

• Building an ascending base

• Showing a rising relative strength line

By summer 2022, SMCI was already acting like a Stage 2 leader.

The market had not even bottomed yet.

From that early leadership signal to the peak in March 2024, SMCI went on to run over 3,200%.

The lesson is simple.

The next super performer can show itself while the market is still struggling. Pay attention to this. O’Neil highlighted the importance of this too!

Even if you waited until the market showed a clear character change in early 2023 with a confirmed higher low, higher high, and price back above the 200 day moving average, you still could have captured roughly 1,200% of the move from there.

Because the best stocks can tell you where the next bull market is going before the headlines do.

View on Substack ↗

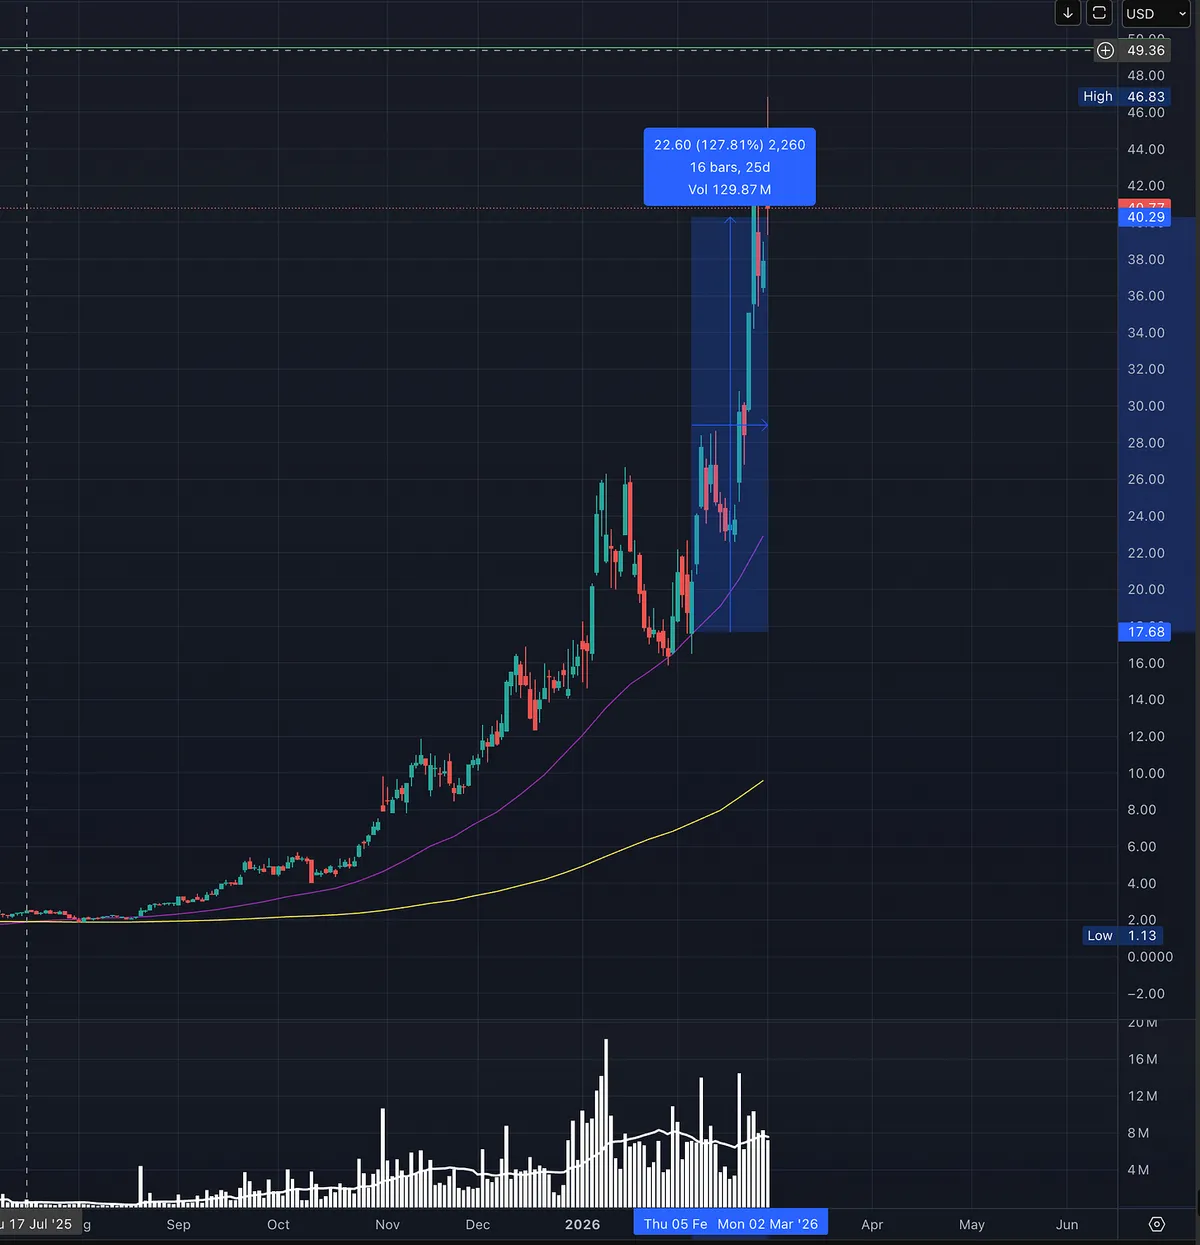
AXTI Is Up 127% Since I Flagged It in Chat

On February 5th, I mentioned AXT Inc. to paid subscribers in the chat.

Why?

It was showing up on my Relative Strength screener and pulling back to a key moving average that had been supporting price.

Nothing fancy.

No crystal ball.

Just strength plus constructive pullback.

Since then, the stock is up 127 percent.

Am I some stock picking guru?

Absolutely not.

I learned from people far more successful and intelligent than me. I just follow the process.

Here’s the truth most people do not want to hear.

I have more losers than winners.

The difference?

My winners pay for the losers and then some.

Bottom line.

I cut my losses short.

And I let my winners run.

That is the entire game.

View on Substack ↗

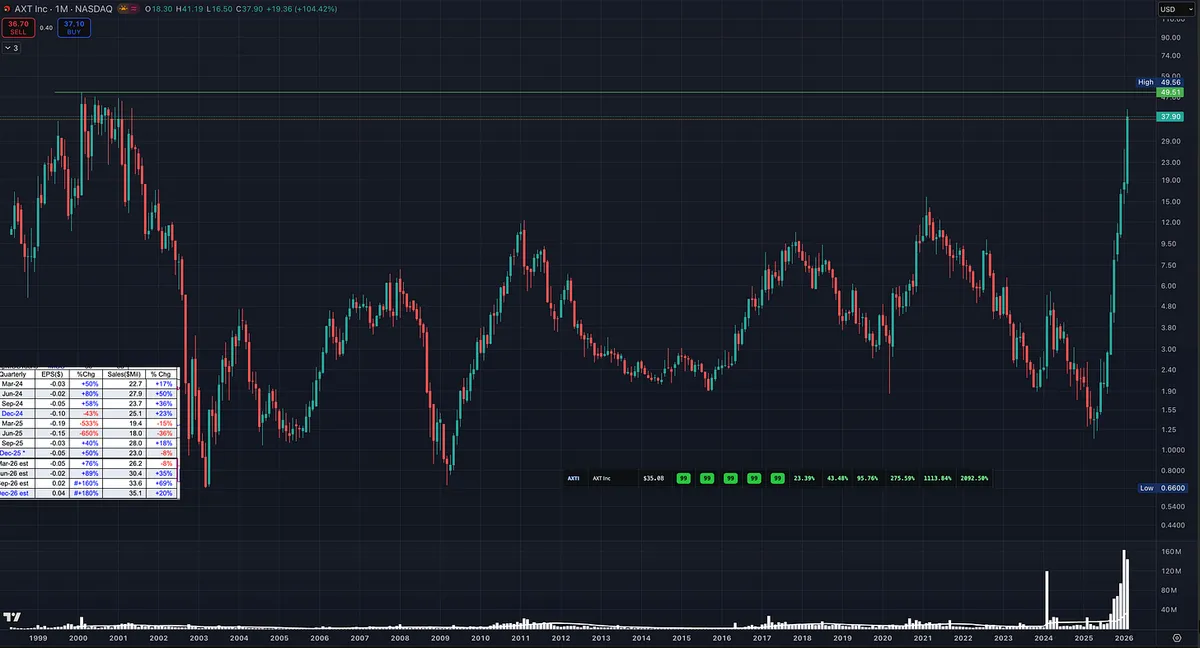
AXTI Is Up 3,000%… And Almost Back to Its 2000 Highs

Up 3,000 percent!

Found this one on my Relative Strength scanner.

From dot com darling to a 98 percent collapse.

AXT Inc. topped near 50 dollars in 2000.

Then it fell apart.

For 25 years it went nowhere. No sustained leadership. Just lower highs and dead money.

And then April 2025.

Right after the Nasdaq bottomed during the tariff scare and ripped higher, AXTI quietly turned up from under a dollar.

Since then it has surged more than 3,000 percent.

Now it is pressing into a 25 year ceiling with:

• 99 RS

• Explosive multi time frame strength

• Surging volume

• Sales and earnings estimates accelerating

Forward projections into 2027 are eye opening. Some estimates show earnings growth of over 11,000 percent off depressed levels.

The real question is not the percentage.

It is durability.

Is this:

A one cycle rebound fueled by tariff relief and the domestic semiconductor narrative?

Or the start of a true Stage 2 institutional move backed by sustainable earnings power?

A lot of investors get scared at all time highs.

But when you study the biggest winning stocks in history, that is often when their real run begins.

This is a U.S. based semiconductor materials company headquartered in Fremont, California. In a world worried about Taiwan supply chains, that story matters.

But price is now testing a level that trapped investors for 25 years.

Clear 50 with real volume and tight action and this becomes historic.

Fail here and it becomes just another high flyer that ran too far too fast.

Either way.

What a move.

View on Substack ↗

Stanley Druckenmiller on NVDA, AI, and Not Being an Expert

In 2022, Druckenmiller noticed something simple but powerful.

The “kids at Stanford” were shifting from crypto to AI.

That told him where the next wave was forming.

His partner said Nvidia was the way to play AI. So he bought a position.

Then ChatGPT launched. When he saw what it could do, he realized how big the shift was and doubled the position.

Here is what is important.

He openly admitted most of the AI discussion went over his head.

He was not an AI engineer. He was not a semiconductor expert.

He followed the theme. He recognized the transition. He pressed when confirmation came.

You do not need to understand every technical detail.

You need to understand where capital, talent, and momentum are going.

Themes change. Leadership rotates.

The money goes to those who recognize it and act.