Momentum Trading Strategy

Notes

Finding Leading Stocks

What to buy: how to find, screen and rank the strongest stocks and industry groups.

Showing 281–299 of 299 notes

View on Substack ↗

Powerful move from a watchlist stock today.

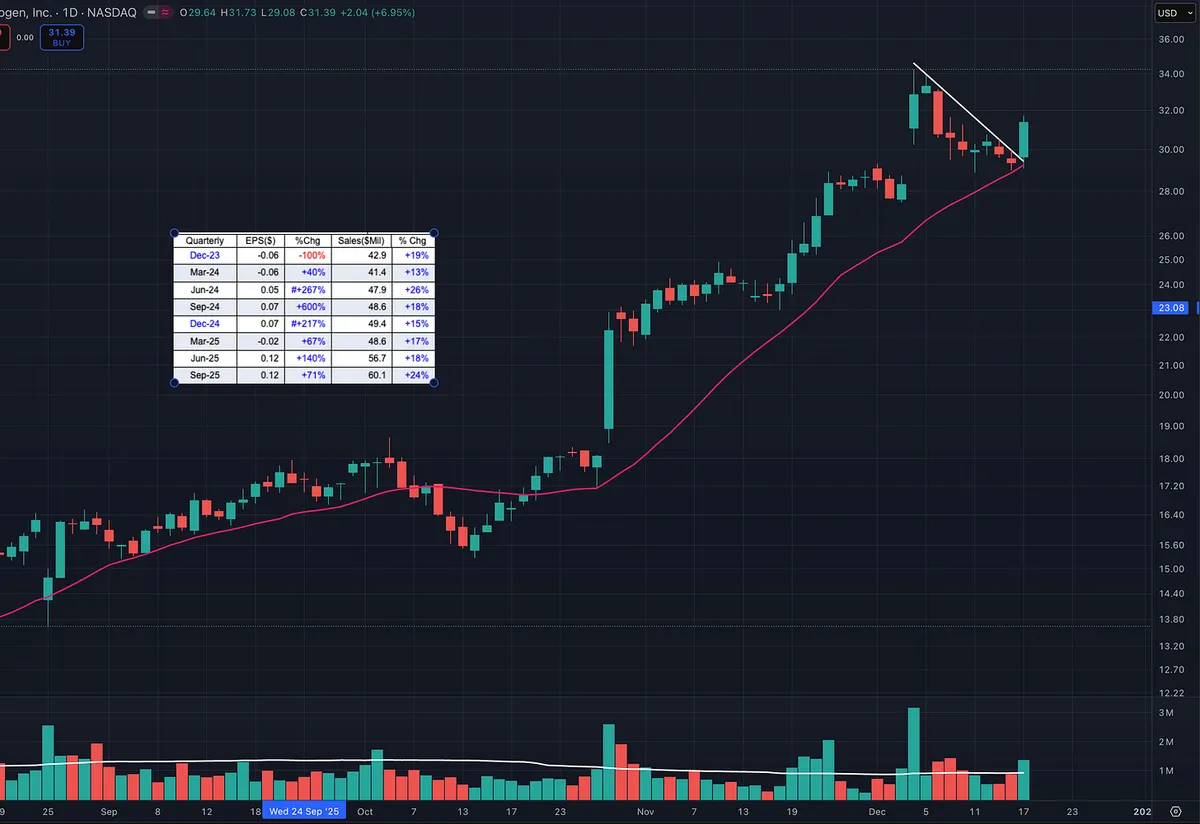
AXGN bounced cleanly off the 20-day moving average on expanding volume while the major indexes were down.

That relative strength matters. When a stock holds support and pushes higher against a weak market, it’s a sign institutions are still accumulating.

The best leaders rarely give deep pullbacks. They reset just enough to shake out weak hands, then move again.

This is why keeping a tight, prepared watchlist matters. When the market gives you the signal, it’s time to execute.

View on Substack ↗

Data Storage Quietly Became One of the Strongest Leadership Groups in the Market

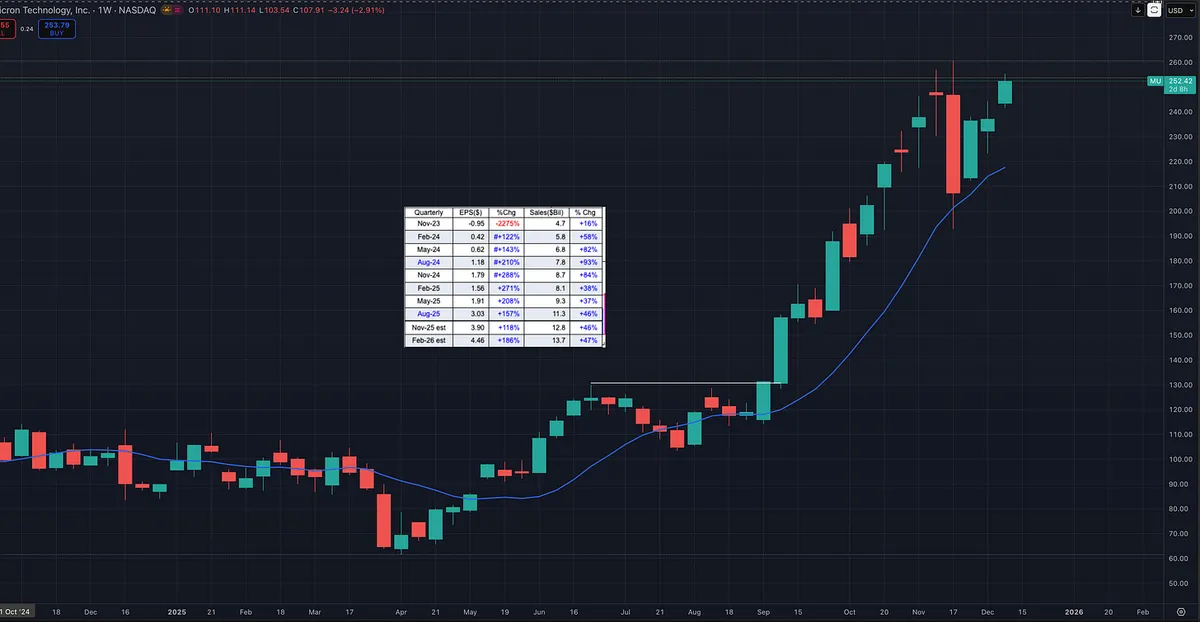
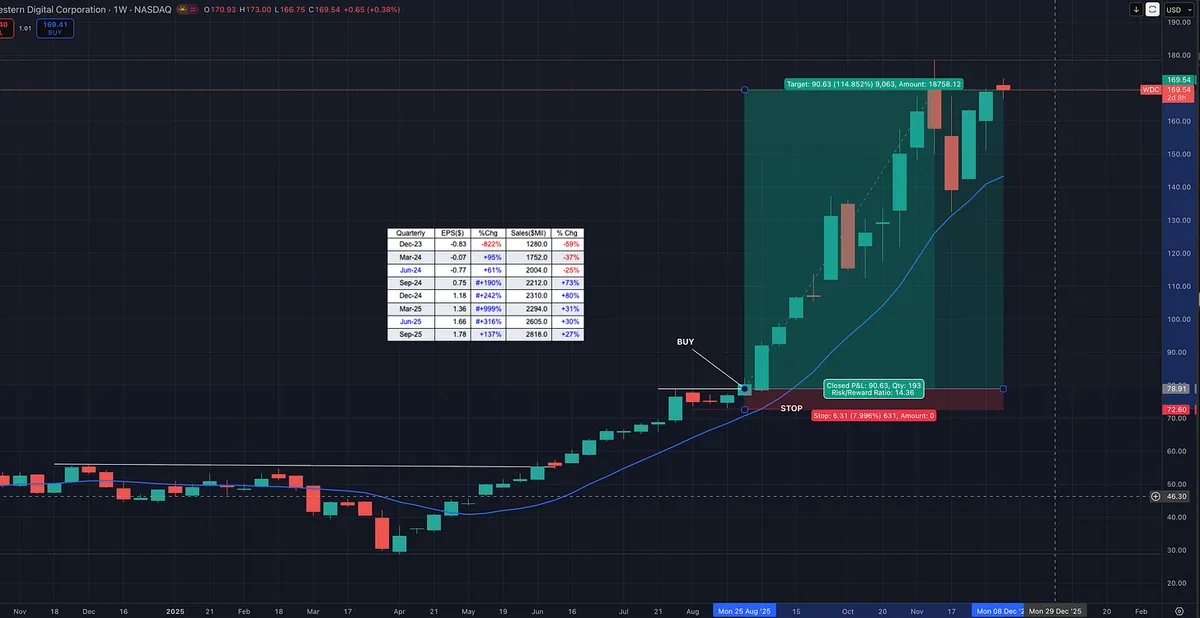
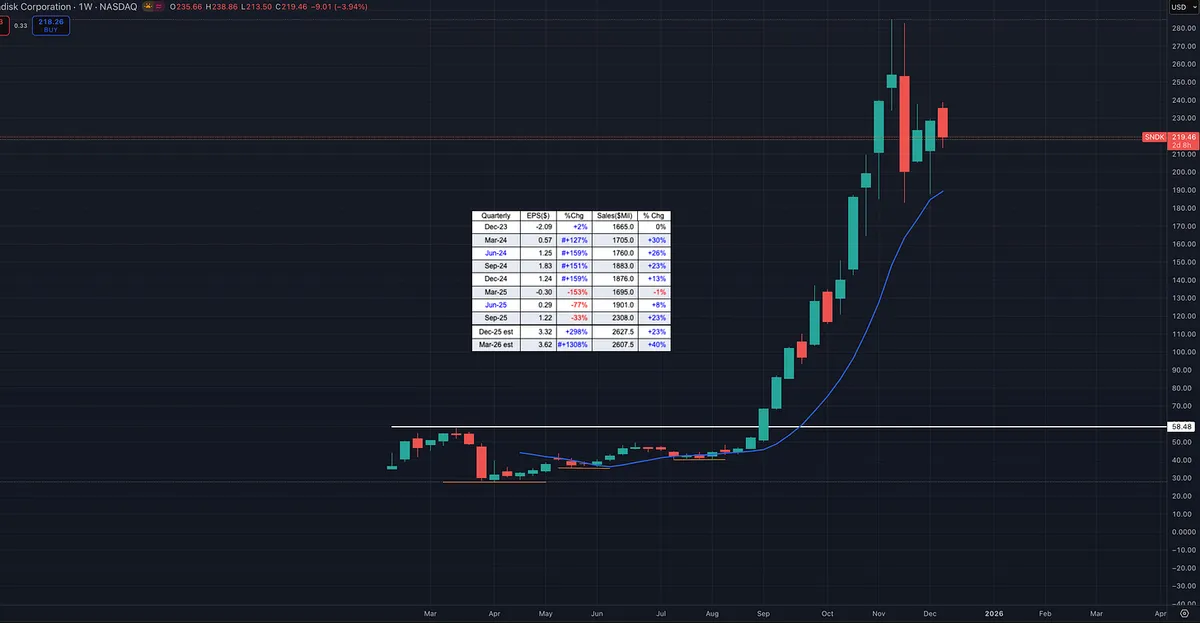
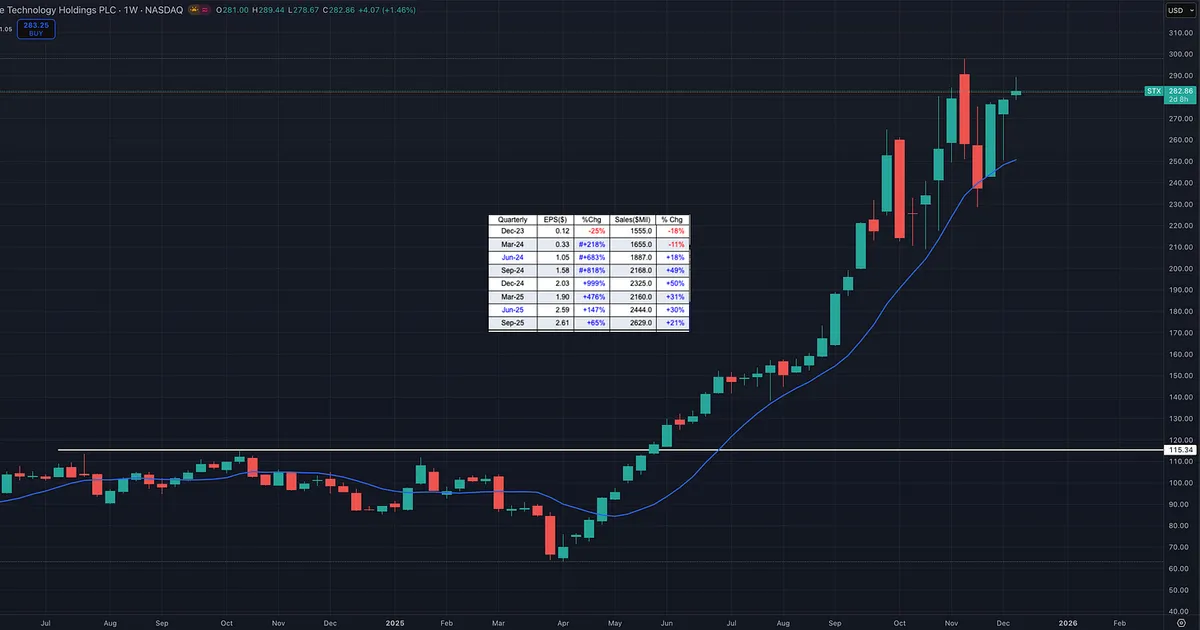
While everyone kept talking about chips, metals, and AI all year, the real expansion of this bull cycle has been happening somewhere else: data storage.

MU, WDC, STX, and even SNDK have been posting massive earnings and sales acceleration. SNDK has not delivered the same near-term numbers, but analysts and funds are clearly positioning for future growth and the stock has surged alongside the leaders.

This entire group started emerging back in April. Since then, the charts, the tape, and the fundamentals have all lined up.

This is exactly why serious traders track relative strength stocks and relative strength industry groups. Leaders rarely move alone. The biggest moves come when multiple stocks in the same industry begin showing strength at the same time, which is a sign that big money is rotating into that group.

When a major theme like AI takes hold, leadership does not stay static. It expands. And by the time most people finally recognize the True Market Leaders, the next group is already breaking out.

Watch the stocks. Watch the groups. Watch the earnings and sales.

View on Substack ↗

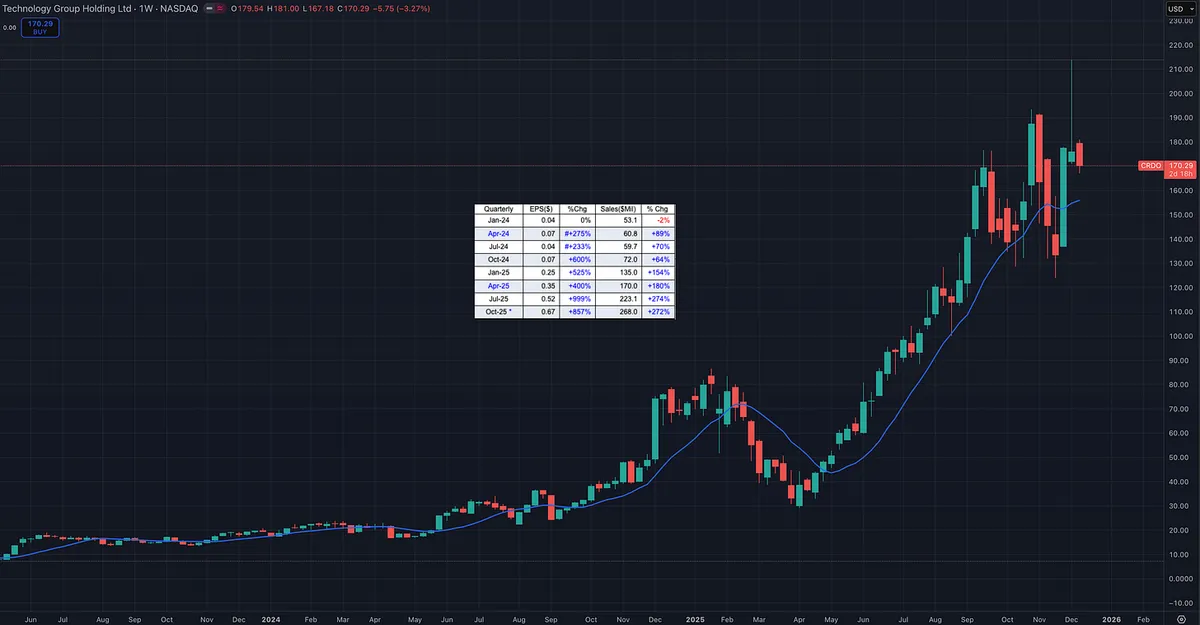
CRDO is a Leader with Elite Fundamentals but the Tape is Telling a Different Story

CRDO continues to post some of the strongest numbers in the entire market. Earnings growth is explosive. Sales acceleration is off the charts. Margins and return on equity are exceptional. Fund ownership is rising fast and the stock carries a Relative Strength rating of 98, which places it near the top of all equities.

The theme is perfect as well. CRDO sits in a hot industry group and lines up with the broader bull market cycle that has rewarded AI and high performance semiconductor names all year.

On paper this is everything you want to see from a future leader.

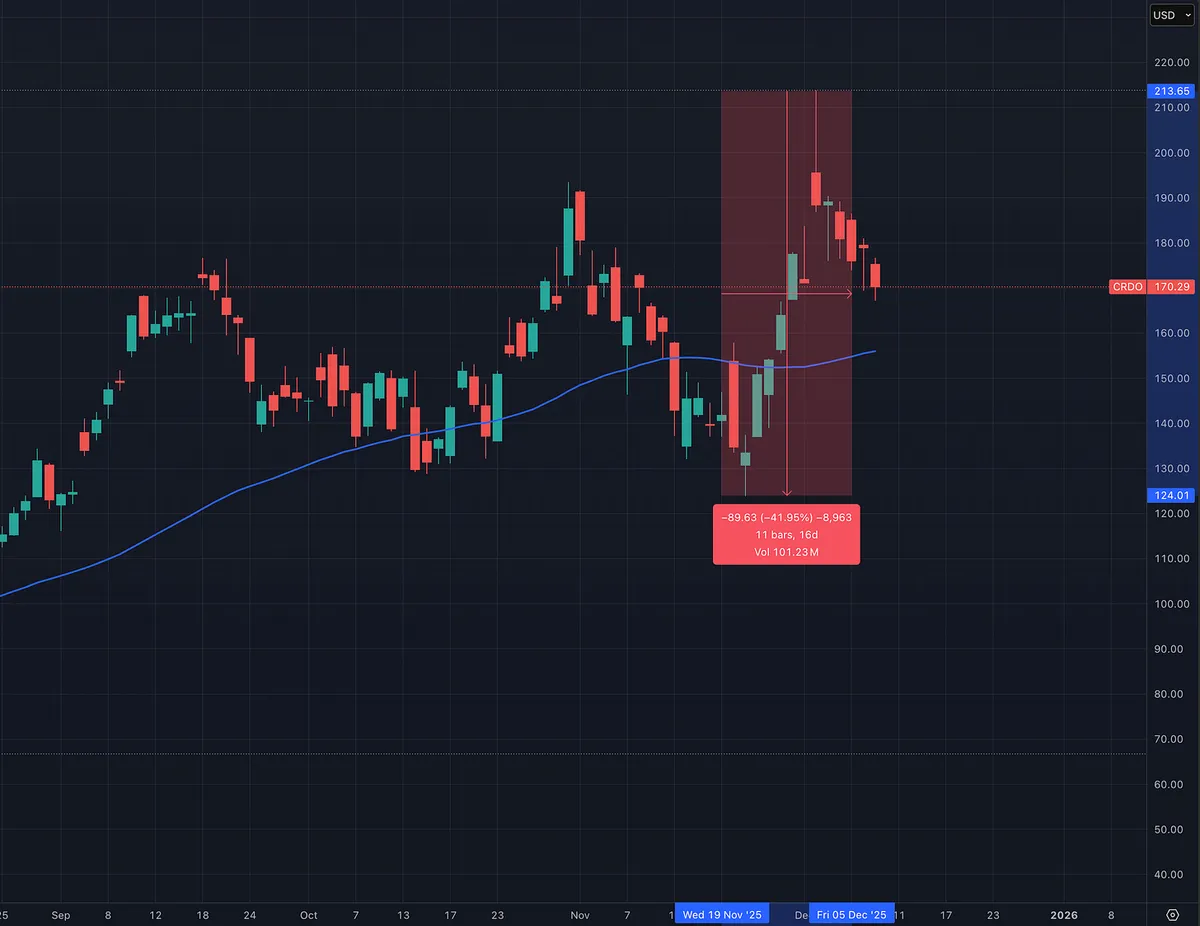
But the price action is sending a warning. The recent wide and loose behavior on the weekly chart is not what you want to see after a strong advance. True leaders usually tighten up, pull back in a controlled manner, and continue to show evidence of institutional support. When the bars become wide and the swings get emotional, it tells you the tape is not in full agreement.

The stock is powerful, but the action needs to calm down. The high to low swing is close to 40 percent. Ideally we would see the chart tighten along the right side and form a more controlled structure. That would give us a cleaner risk reward setup and a higher quality breakout opportunity.

View on Substack ↗

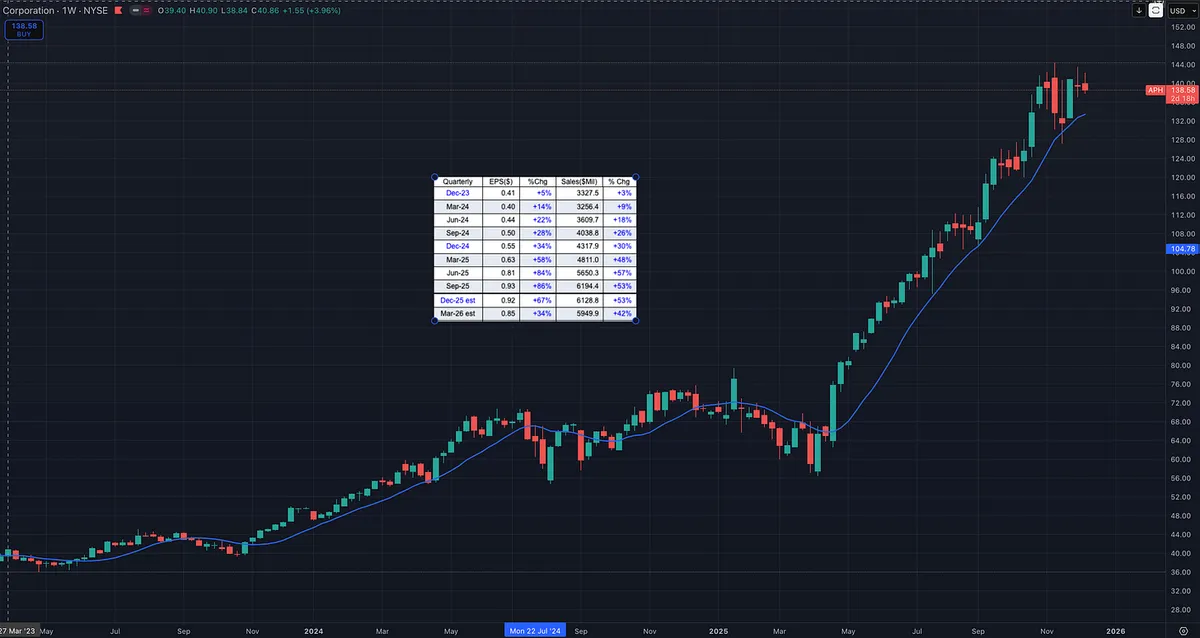
APH is a Textbook CANSLIM Leader

APH has been one of the true market leaders this year. The stock is showing the exact characteristics that appear again and again in the biggest winners. Earnings are strong and accelerating. Sales growth is consistent. Margins and return on equity are elite. Fund ownership keeps rising, which confirms steady institutional accumulation.

Price action agrees. APH carries a Relative Strength rating of 94 and continues to outperform most of the market. It also sits inside a powerful industry group and benefits from the larger AI infrastructure theme that is driving capital flows this cycle.

This is what CANSLIM was built to identify. A company with elite fundamentals, strong technical action, increasing sponsorship, and a major trend behind it. When all of these line up, you get a potential leader that can continue to surprise on the upside.

APH checks every CANSLIM box right now.

View on Substack ↗

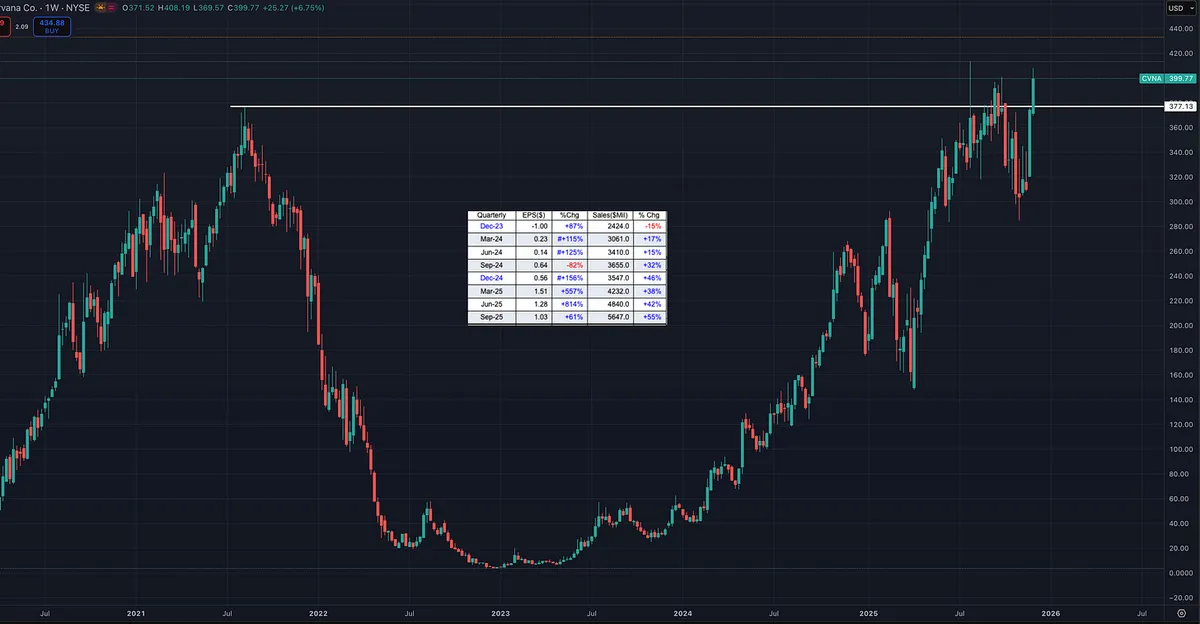
$CVNA is a powerful example of a true fundamental turnaround.

Earnings and sales growth have exploded over the past year, and institutional fund ownership has doubled. RS is 91 and confirming the strength.

EPS has shifted from negative to consistent double and triple digit growth. Sales have now accelerated for four straight quarters. When both earnings and revenue inflect this aggressively, the market pays attention.

The stock just broke out to all-time highs with clear institutional accumulation behind the move.

High growth. Rising demand. Strong technicals. Increasing institutional sponsorship.

This is the type of leadership you want on a watch list.

View on Substack ↗

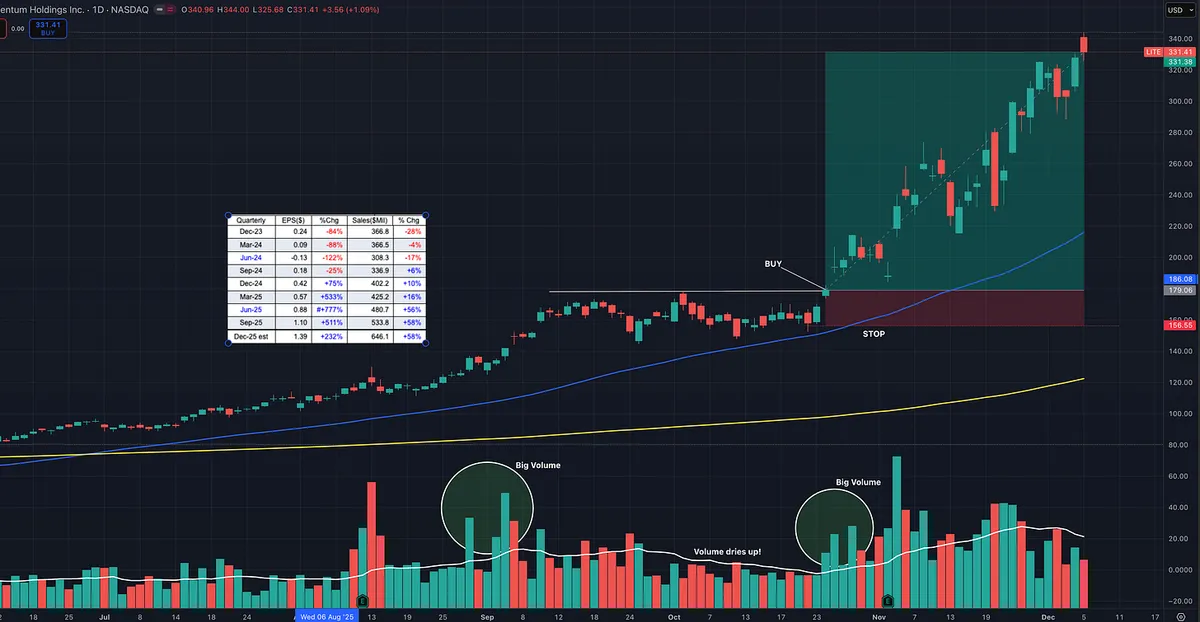
Great example of volume and price analysis with LITE.

LITE was easily spotted on scanners for its Relative Strength performance (RS 99), huge earnings and sales acceleration, and its position in a leading sector and theme. This is exactly what real leadership looks like from a top industry group in telecom and fiber optics.

The setup was a flat base breakout after tight consolidation. Big volume came in on the first move up, followed by controlled consolidation where volume dried up, and then another surge of big volume on the breakout.

The combination of strong fundamentals, clean technical price action, increasing fund ownership, and leadership within its sector created a high quality risk and reward opportunity.

View on Substack ↗

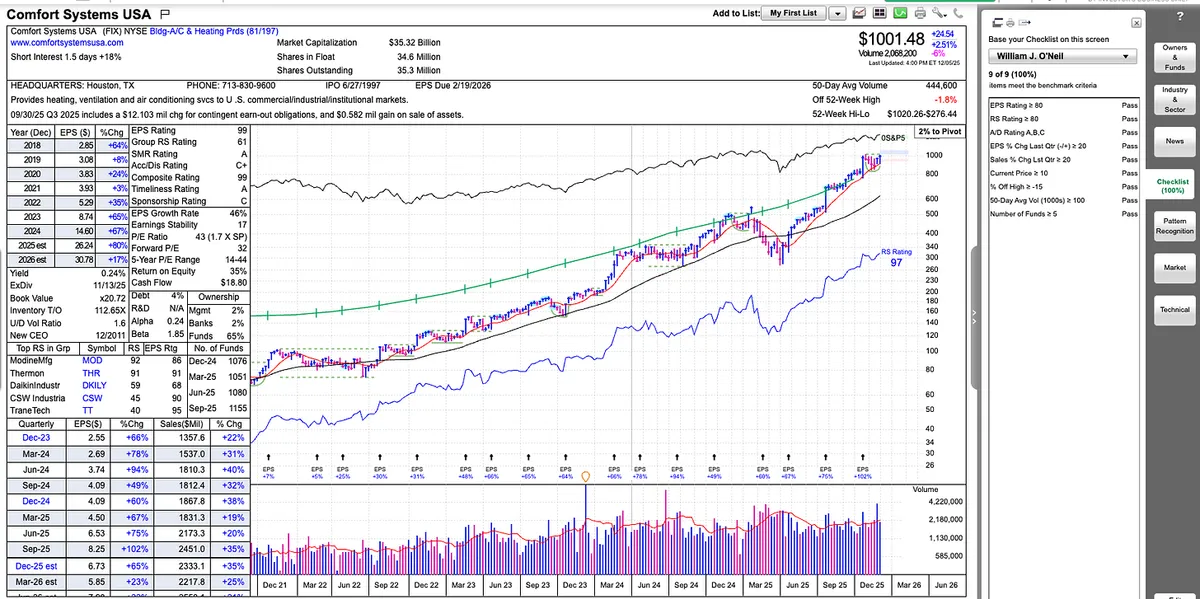
Some stocks lead loudly. Others lead silently.

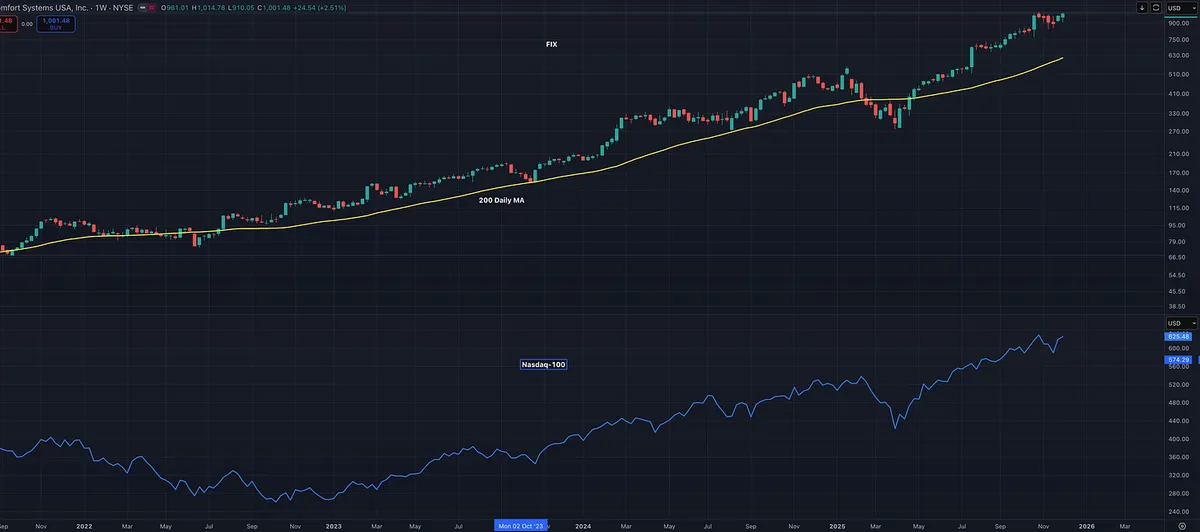
Comfort Systems (FIX) has been one of the cleanest and strongest institutional-quality leaders for nearly two years and hardly anyone talks about it. It is not from a hot sector or a trendy industry group. It just keeps delivering.

Just like ELF, this stock was making new highs while the indexes were still in the 2022 bear market. Unlike ELF, it is still a top performer two and a half years later. The lesson is simple. Real market leaders often emerge in bear markets. That is one of William O’Neil’s most important teachings.

Strong earnings. Strong sales. Top tier relative strength. Consistent institutional accumulation.

Sometimes the quiet leaders end up being the real ones.

View on Substack ↗

“I Rarely Pay Any Attention to Overbought/Oversold Indicators.” William O’Neil

Most traders hesitate when a stock looks “overbought.” O’Neil built his entire career on doing the opposite.

After studying more than 100 years of the greatest market winners, he realized something almost nobody wants to accept:

The biggest leaders spend most of their advances looking overbought. They break out to new highs while RSI is elevated. They stay extended for weeks or months. They never give you the oversold dip everyone waits for.

If you use overbought or oversold indicators to time CANSLIM type stocks such as big earnings, big sales, high relative strength, and leading sectors, you will almost always talk yourself out of the best trades.

These stocks run because institutions are accumulating them, not because RSI is comfortable.

The truth:If you wait for strong stocks to look not overbought, you will never own a true market leader.

This is why momentum traders like Darvas, O’Neil, Minervini, and Zanger focus on strength, not comfort.

Strong stocks tend to stay strong. Weak stocks tend to stay weak.

Everything else is noise.

View on Substack ↗

The Quiet Leaders: What’s Been Outperforming the Market All Year

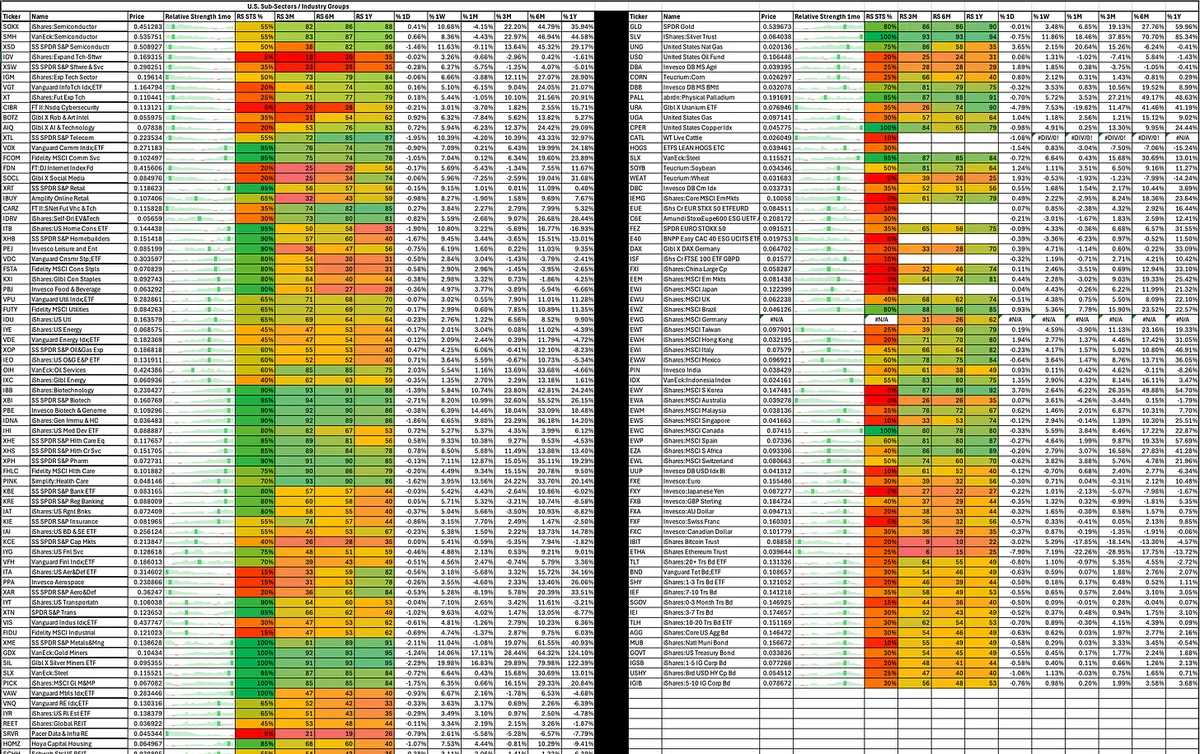
Looking at my Relative Strength Dashboard and combining it with IBD’s RS data, which ranks stocks and ETFs against over 11,000 tickers across the entire market, a clear group of long-term leaders emerges.

These are not just beating the S&P 500, they are outperforming almost everything.

Here is what has dominated across 1-year RS, 6-month RS, 3-month RS, and 1-month RS:

Biotech: IBB, IHI, XPH, PBE Biotech consistently shows up at the top regardless of timeframe. It has been one of the most reliable pockets of strength in the entire market, even during periods when growth cooled off.

Metals and Mining: XME, GDX, SIL, SLX, GLD, SLV This entire complex has been a powerhouse. Industrial metals, gold miners, silver, broad miners. Every category keeps landing near the top of the RS rankings. This is structural strength, not a short-term theme.

Chips (Semiconductors): Semis have shown strong RS over 1-year, 6-month, and 3-month windows. The only softness has been in the past month, and even that looks more like normal digestion after a big run.

Foreign Markets: Canada and Brazil consistently rank near the top across multiple timeframes.

Bottom Line: When RS leadership shows up in every timeframe, and across 11,000 plus tickers, it is not random. Biotech and metals and mining have been the real leaders all year.

This is why I rely on Relative Strength. Leadership is obvious when you measure it.

View on Substack ↗

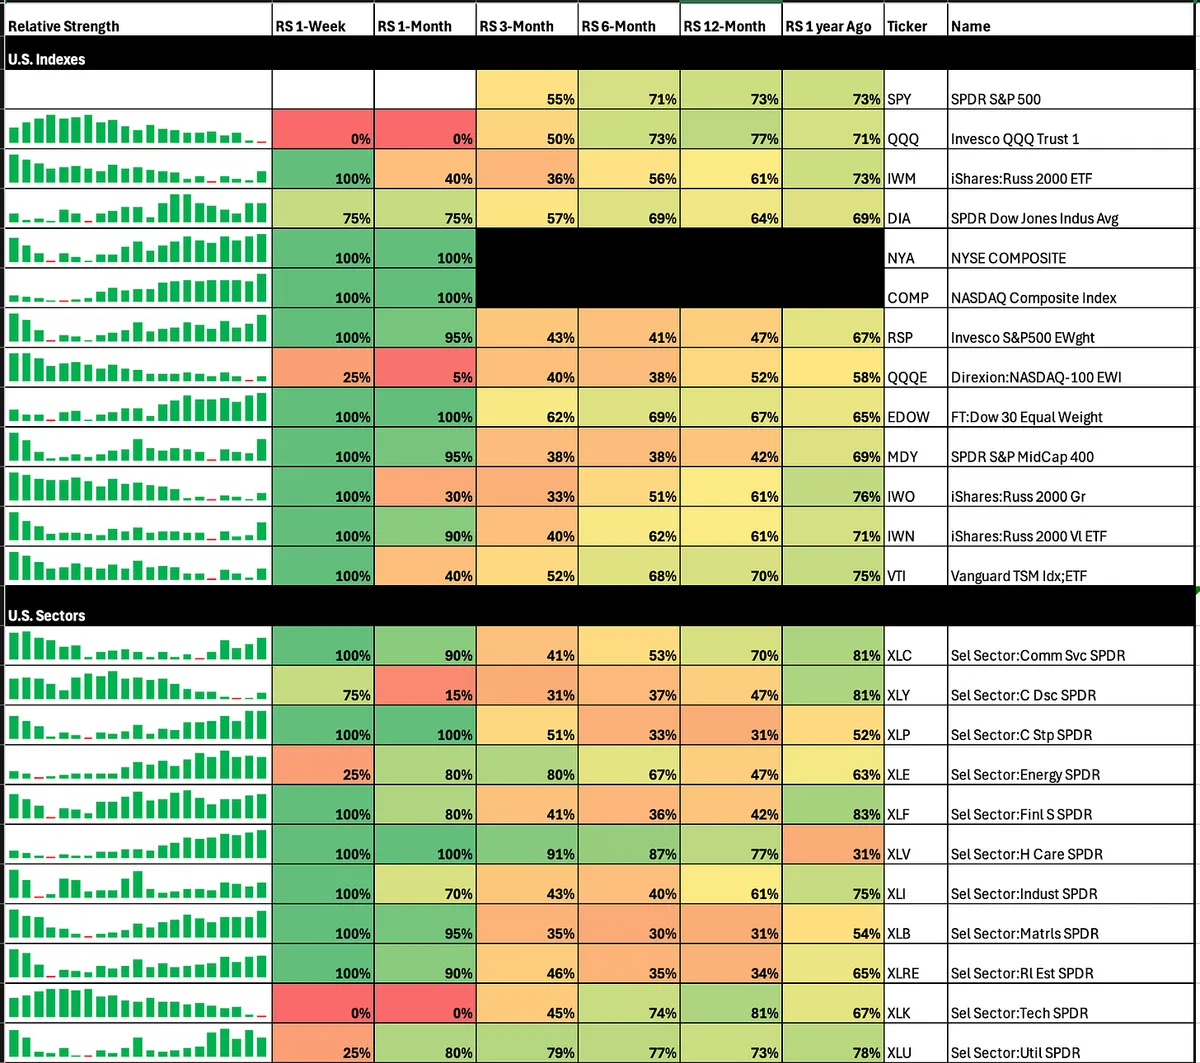
Looking at my Relative Strength dashboard today, something jumped out at me.

Health Care has been one of the strongest sectors over the last 6 months, and the biotech and pharma industries have been quietly leading inside of it. I have noticed this strength for a while, but I completely neglected this area in my own trading.

This is why I track relative strength across sectors and industries. Leaders often reveal themselves long before the headlines notice. While everyone was focused on tech and growth themes, Health Care just kept grinding higher with consistent strength.

Who here has done well trading this sector or these industries? I would love to hear what names have worked for you.

View on Substack ↗

Health Care does not care about the pullback.

XLV is one of the only sectors that completely ignored the recent market weakness.

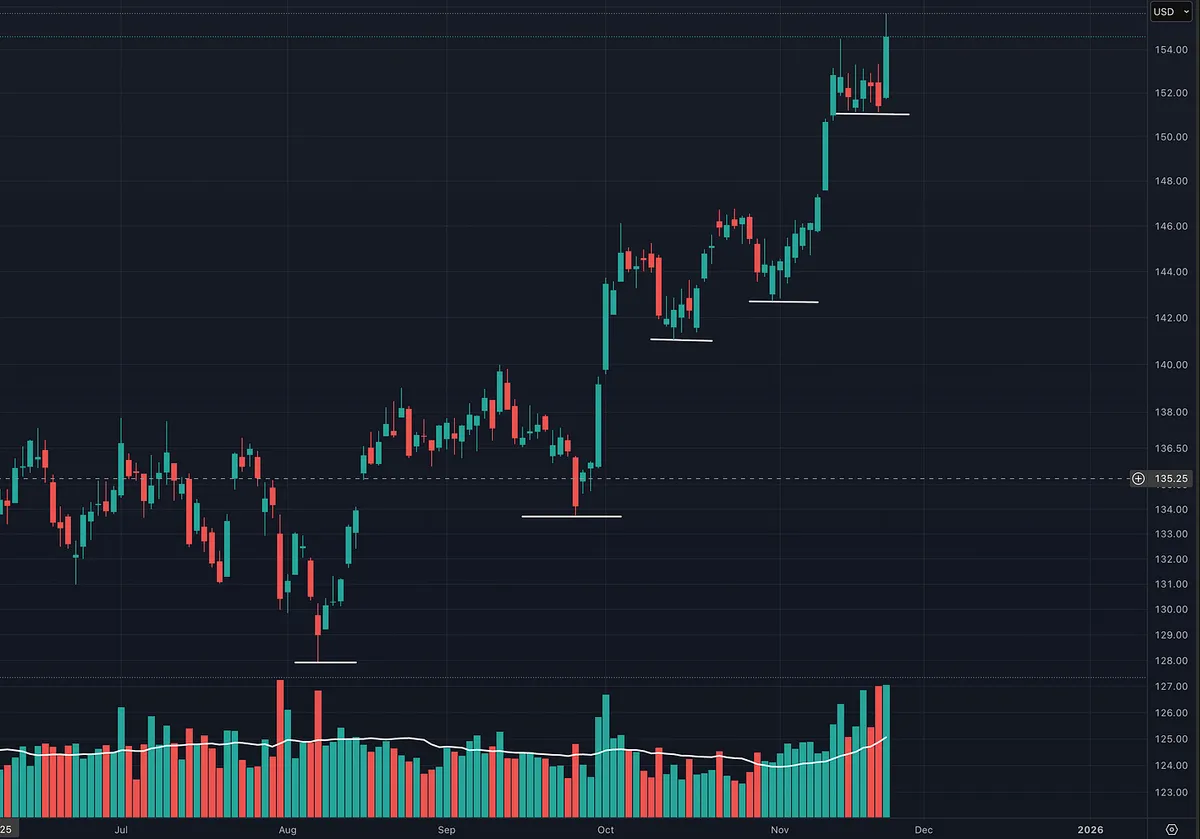
My RS dashboard has it sitting near the top across every major timeframe, and the chart shows clean breakouts and tight consolidations with real volume behind it.

When the market pauses and something keeps pushing higher, that is usually where the real institutional money is flowing.

Leaders reveal themselves during weakness.

XLV is acting like one.

Ream more: https://tradingmomentum.substack.com/p/health-care-does-not-care-about-the

ArticleHealth Care Does Not Care About the Market Pullback
View on Substack ↗

Do you know traders who crush it by focusing on just one asset?

I get it. There is a real advantage in specializing. When you trade the same asset every day you develop a feel for it. You learn how it moves, what the tape looks like when momentum shifts, and you gain confidence in execution. I experienced this firsthand trading the Nasdaq 100. That familiarity is powerful.

And although there are people who do well focusing on only one asset, the majority of professionals with long term consistent results do not. The traders who make it year after year move to what is in play. They follow strength instead of waiting for it to return.

But here is the problem no one talks about.

When you lock yourself into one asset class you give up one of the biggest edges in the entire market. You lose the ability to follow where institutional money is pouring in. You give up the ability to rotate into what is actually moving.

This is where the highest probability opportunities live.

Gold when it is breaking out and outperforming.

AI when capital starts flooding into the theme.

Robotics, energy, biotech, semiconductors, crypto. Whatever the market is rewarding right now.

What we call “stocks in play.”

I see this most with crypto traders. They only focus on that one asset class. They sit and wait for the next big move in Bitcoin or altcoins while ignoring massive opportunities happening in other areas of the market. They stay loyal to an asset that might be dead for months while strength is exploding somewhere else.

Here is the part that stings a little.

Most crypto-only traders are so in love with the idea of crypto that they become emotionally compromised. The narrative becomes part of their identity. In reality, that loyalty hurts their overall performance. They become stuck and rigid, tied to one story while the market rotates into new themes with massive momentum.

They miss powerful opportunities while crypto is sleeping, or they take massive losses because they feel loyal to the cause. It becomes almost cult like. We have seen the exact same behavior with certain stocks like Tesla, where belief and community became stronger than price action and risk management.

Why not move to cash and play the markets that are actually moving? And when nothing is moving, cash can be the best position.

When you follow strength and momentum across sectors you gain almost a margin for error. You are not trying to force trades in a dead asset. You are aligning yourself with the current market theme where volume, attention, and institutional flows are concentrated.

The traders who stay stuck in one asset often end up trading when nothing is happening. They are bored and trying to create opportunity instead of rotating into what is hot.

The market rewards movement, not loyalty.

If you want higher probability setups, follow relative strength. Go where the money is flowing right now.

Become the trader who adapts.

You need to decide what you really want. Do you want to be a great trader or investor? If the answer is yes, your job is to make money. You cannot fall in love with any asset class.

It reminds me of a William O’Neil quote that every serious trader should know:

“There are no good stocks unless they go up in price. If they go down instead, you have to cut your losses fast.”

View on Substack ↗

NVDA — Same Story, Different Cycle

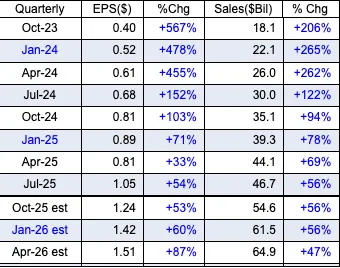
It’s always funny to see the chatter every time $NVDA consolidates. Just like people who think a stock or asset will never go down, there’s always another camp convinced “the top is in.” Then NVDA goes up, consolidates, and does it again, more times than I can count. 😂

That’s exactly why it’s so important to focus on price action and volume, and to look for good risk/reward opportunities until the trend actually confirms it’s over. Until then, the key is to stay unbiased and keep making smart, high-probability bets. If you study the greatest market winners of all time, as William O’Neil did, the pattern is clear: leaders in leading industry groups tend to dominate bull markets far longer than most people expect before finally topping out.

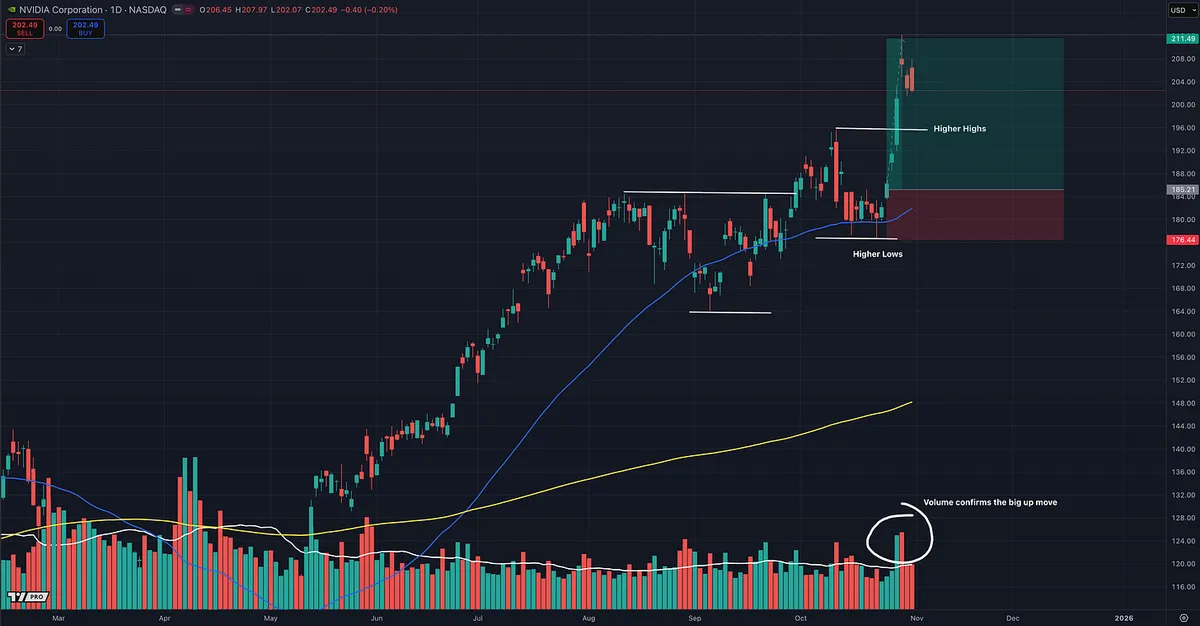
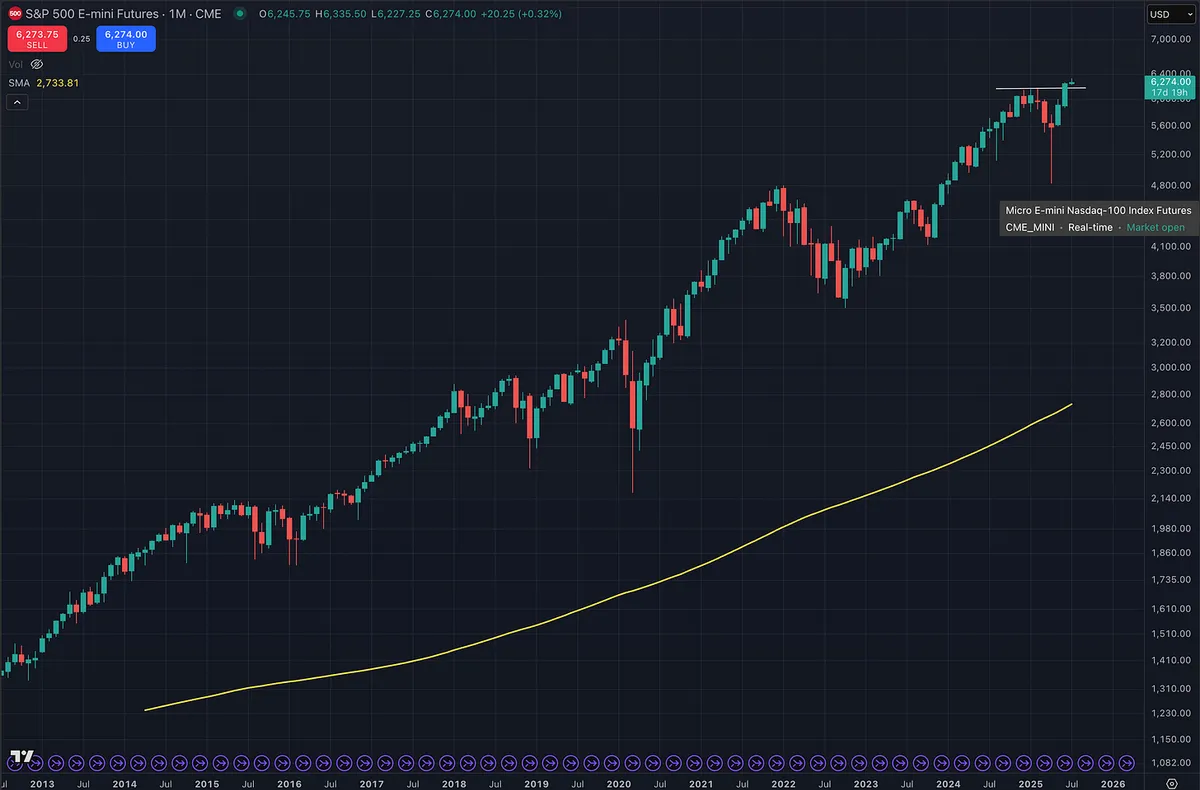
Plenty of bulls don’t rely on stochastics or oscillators, just price action and volume — the purest read of supply and demand. From that view, NVDA continues to show strength with higher lows and higher highs through its consolidation, and now it’s broken up out of that range, a textbook bullish continuation.

Price sits above all key daily moving averages (10, 20, 50, and 200 SMA). The last pullback found support at the 50-day on lighter volume, while the recent breakout came on big volume, confirming real institutional buying interest.

From a risk/reward standpoint, this setup is clean: defined support, strong momentum, and volume confirmation — everything you want in a continuation move.

And fundamentally, NVDA remains an absolute leader. It holds an IBD Relative Strength Rating of 90, meaning it has outperformed 90% of all stocks in the market over the past 12 months. That’s not the same as the RSI or Stochastic “relative strength” indicators. IBD’s RS Rating measures true performance versus all other stocks, not short-term momentum.

When you combine that kind of technical strength with fundamental dominance like strong earnings, consistent sales growth, and market leadership, it’s hard not to stay bullish.

NVDA continues to do what great stocks do: Climb, consolidate, shake out the doubters, and climb again.