Momentum Trading Strategy

Notes

Market Conditions

Reading the overall market and deciding how aggressive to be.

Showing 141–160 of 227 notes

View on Substack ↗

Most Traders Skip This Step Before Picking Stocks

Most traders jump straight to stock charts.

Professionals start with the market environment.

Before I analyze a single stock each week, I run through a structured Big Picture Market Pulse framework that looks at:

• Market trend and stage

• Breadth and participation

• Institutional buying and selling

• Sentiment and volatility

• Credit markets and macro signals

• Sector and industry leadership

• And more

Because the reality is simple:

No trading strategy works in every market environment.

If you're trading momentum stocks in a weak market, even great setups can fail.

In this new lesson, I walk through the entire framework I use every weekend before selecting stocks.

If you want to improve your probabilities as a trader, this step is essential.

Full breakdown:https://tradingmomentum.substack.com/p/momentum-trading-strategy-the-100-56a

On SubstackMomentum Trading Strategy: The 100-Year Playbook Behind the Biggest Winning Stocks — Module 3
View on Substack ↗

Want to know one of the fastest ways to spot market deterioration?

Watch the 52 week new highs and new lows list.

Many people ask why I track it.

Simple.

Because many of the greatest traders did.

William J. O'Neil wrote extensively about this in How to Make Money in Stocks.

The new highs and new lows list often reveals deceleration and deterioration in the market before most people notice it.

But there is an important nuance that many traders miss.

It is not just about seeing stocks make new highs.

You have to ask:

What kind of stocks are making those highs?

If leadership stocks with strong earnings and sales growth are breaking out, that is constructive.

But if the list is dominated by defensive or laggard type stocks, that is a warning sign.

Utilities. Staples. Preferred shares. Slow movers.

In past market cycles, some technicians ignored weakness because “stocks were still making new highs.”

But a deeper look often showed those highs were coming from defensive names.

That is not healthy leadership.

That is capital hiding.

This is why superficial knowledge can hurt you in the stock market.

It is not enough to look at the data.

You have to understand what the data is actually telling you.

View on Substack ↗

Just Because You Can Trade It Doesn’t Mean You Should

If you scan enough charts, you will always find something to trade.

A breakout forming.

A pivot setting up.

A stock sitting in a buyable zone.

But look a little deeper.

Weak sales.

Not in a leading group.

A slower mover that does not offer the risk reward your strategy is built for.

A market environment that is not supportive.

Yet traders convince themselves to take it anyway.

Why?

Because it’s there.

During consolidations like this, I’ve even caught myself throwing names out that aren’t really what we do. For most traders, this is a bad move.

Yes, those trades can work sometimes.

But they are usually lower probability than waiting for true A+ setups in strong groups when the market is supportive.

Another factor most traders ignore is where they stand for the year.

If you’ve had a huge year and are comfortable risking a small amount to probe weaker conditions, that’s one thing.

But if you’re just starting out, or the year hasn’t been great, forcing trades in mediocre names can do real damage.

Many traders believe their strategy stopped working.

Often the reality is simpler.

The environment changed, and they stopped following their own playbook.

The market will always show you something to buy.

The real edge is having the discipline to wait.

View on Substack ↗

How William O’Neil Spotted Institutional Selling Before Market Corrections

One of the simplest but most powerful concepts from William O’Neil’s How to Make Money in Stocks is something called distribution days.

A distribution day occurs when a major market index closes lower than the previous day on higher volume.

Price down + volume up.

Why does that matter?

Because volume reveals institutional activity.

Large mutual funds, hedge funds, and pension funds cannot quietly sell billions of dollars worth of stock. When they begin exiting positions, it often shows up as market declines on heavier volume.

That’s what distribution days are designed to detect.

O’Neil tracked these over roughly 20–25 trading days. When they begin to cluster, it can signal that institutional selling pressure is building beneath the surface of the market.

A simple way to think about it:

0–2 distribution days Healthy uptrend

3–4 distribution days Early warning

5–6 distribution days Institutional selling showing up

7+ distribution days Market under pressure

O’Neil typically monitored distribution days on the Nasdaq Composite and the S&P 500.

In my own process, I also include the Nasdaq 100 to capture what the large-cap growth leaders are doing.

When distribution begins appearing across multiple indexes at the same time, it often tells you something important:

Institutions may be selling.

And when institutions sell, the market eventually feels it.

View on Substack ↗

Most Traders Pick One Side of Market Analysis. The Best Traders Use Both.

I hear a lot of people talk about big-picture macro data, market cycles, interest rates, sentiment, and all the top-down market stuff. But when it comes time to actually pick individual stocks, they struggle.

Then I hear the opposite crowd.

They talk nonstop about stock selection. Breakouts. Chart patterns. Individual companies. But they completely ignore the broader market environment.

Both approaches miss something important.

The edge comes from combining both.

My philosophy is simple.

Top-down analysis plus bottom-up refinement.

Top-down analysis helps us understand the market environment. Every weekend I step back and analyze the market from a big-picture perspective. I want to understand what the overall environment looks like before focusing on individual opportunities.

This idea aligns with William O'Neil's concept of the M in CANSLIM, which emphasizes understanding the market direction before selecting stocks.

It also incorporates ideas from Martin Zweig, author of Winning on Wall Street. Zweig focused heavily on the larger forces that drive bull and bear markets.

Many legendary traders followed Zweig's work. Traders from very different styles including Richard Dennis, Paul Tudor Jones, Michael Marcus, Bruce Kovner, and even short-term momentum trader Marty "The Pit Bull" Schwartz referenced his research.

But top-down analysis alone is not enough.

Traders like Mark Minervini often point out that many times the individual stocks themselves begin to reveal changes in the market before the major indexes do.

Leadership stocks breaking down. Breakouts suddenly failing. Relative strength shifting across sectors.

These signals often show up before the broader indexes reveal what is happening.

That is why bottom-up analysis matters.

By studying individual stocks, sector leadership, and relative strength, we can often detect subtle shifts in the market's character.

Interestingly, this principle exists across every timeframe.

Many professional day trading firms conduct top-down market analysis, even though they trade on intraday charts. Understanding the environment improves their probabilities.

At the same time, swing traders and position traders zoom down into lower timeframes and analyze individual stocks to refine their entries.

In other words:

Day traders zoom out to understand the environment.

Swing traders zoom in to refine execution.

Both directions matter.

The real edge comes from combining both perspectives.

Top-down tells you where the wind is blowing.

Bottom-up helps you pick the fastest sailboat.

Ignore either side and you are trading with incomplete information.

Combine both and you dramatically improve your probabilities.

This is exactly what Module 3 and Module 4 of the Momentum Trading Strategy Course will cover and is free for paid subscribers.

Module 3 covers top-down analysis and the Big Picture Market Pulse.

Module 4 covers bottom-up stock level refinement and identifying the strongest leadership opportunities.

If you haven’t started the course yet, Modules 1 and 2 are already available.

View on Substack ↗

The Market Is Approaching a Critical Inflection Point

The S&P 500 and Nasdaq-100 are now approaching their 200-day moving averages while market breadth continues to deteriorate beneath the surface.

Several areas that had been holding up during this consolidation are now beginning to weaken, and leadership across the market has narrowed dramatically.

In this week’s Big Picture Market Pulse, we break down:

• The critical levels the major indexes are testing

• Why market internals have weakened so quickly

• Where the remaining pockets of strength still exist

• What the next move could mean for traders and investors

This framework follows the philosophy used by William O’Neil, who emphasized that the “M” in CANSLIM, the direction of the overall market, is one of the most important factors for individual stock success. It also incorporates the macro perspective popularized by Martin Zweig, whose work influenced several of the legendary traders featured in Market Wizards.

If you want to stay in tune with what the market is really doing beneath the surface, this report walks through the indexes, breadth, macro signals, and relative strength across sectors and industry groups.

https://tradingmomentum.substack.com/p/big-picture-market-pulse-march-15

On SubstackBig Picture Market Pulse | March 15, 2026
View on Substack ↗

The Best Traders Know When Not to Trade

Some of the greatest traders in history all share the same lesson.

You do not need to trade in every market environment.

“You don’t have to be in the market all the time.” William O’Neil

“Not trading when there was no market movement was, in fact, one of the most important rules of all. No trending market, no profit.” Richard Dennis

“Sometimes your best trades are the ones you don’t make.” Linda Bradford Raschke

“Most people will not wait for the environment to tip itself off. They will walk into the forest when it is still dark, while I wait until it gets light.” Mark Weinstein

“The general market direction is the most important factor in determining whether most stocks will rise or fall.” Stan Weinstein

Different strategies. Different timeframes. Different markets.

But the wisdom is the same.

Successful traders understand that environment matters.

More traders lose money by forcing trades in the wrong market conditions than by having poor setups or bad stock selection.

An edge is not constant activity.

The edge comes from recognizing when conditions are favorable for your strategy and having the patience to wait until they are.

Are you trading when you should, or are you trading in the wrong conditions?

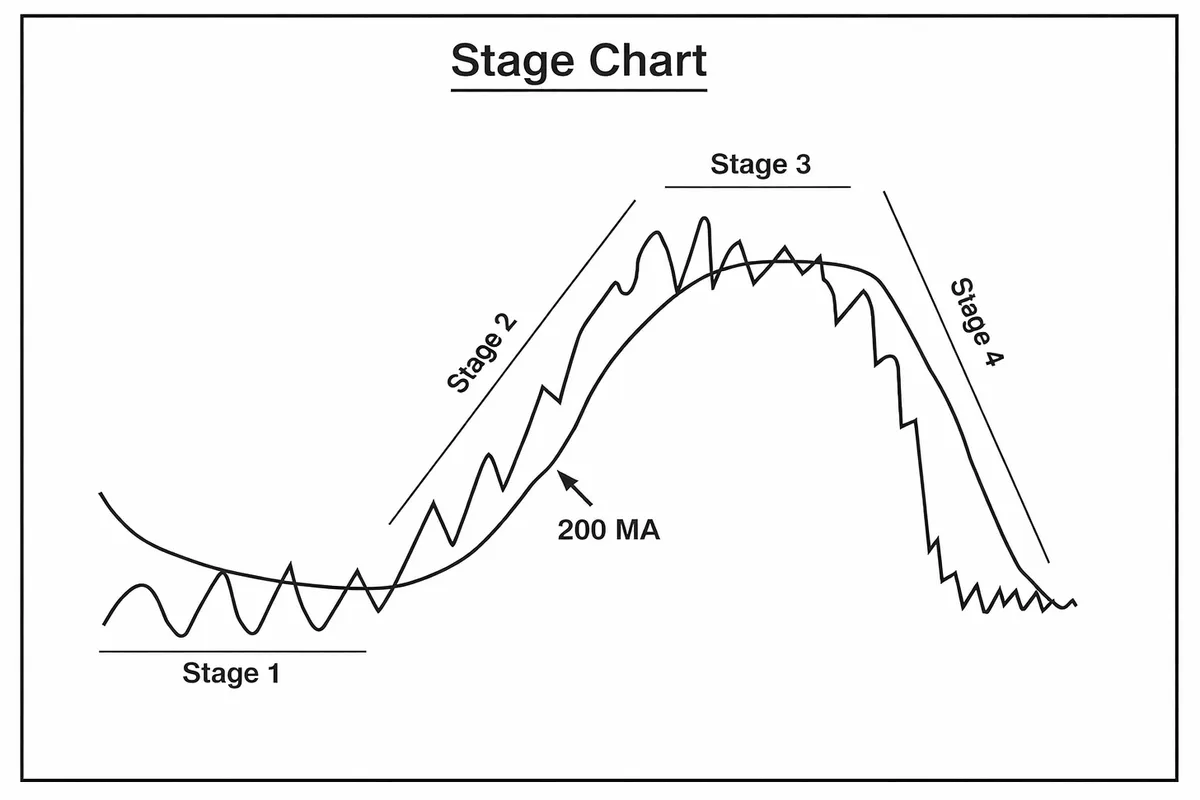
Chart below shows how market environments shift through the stages.

View on Substack ↗

You Do Not Need to Trade All Year to Have a Great Year

Many traders believe they need to be active in the market all the time.

In reality, some of the best years come from trading during relatively short windows when conditions are aligned.

Take 2025 as an example.

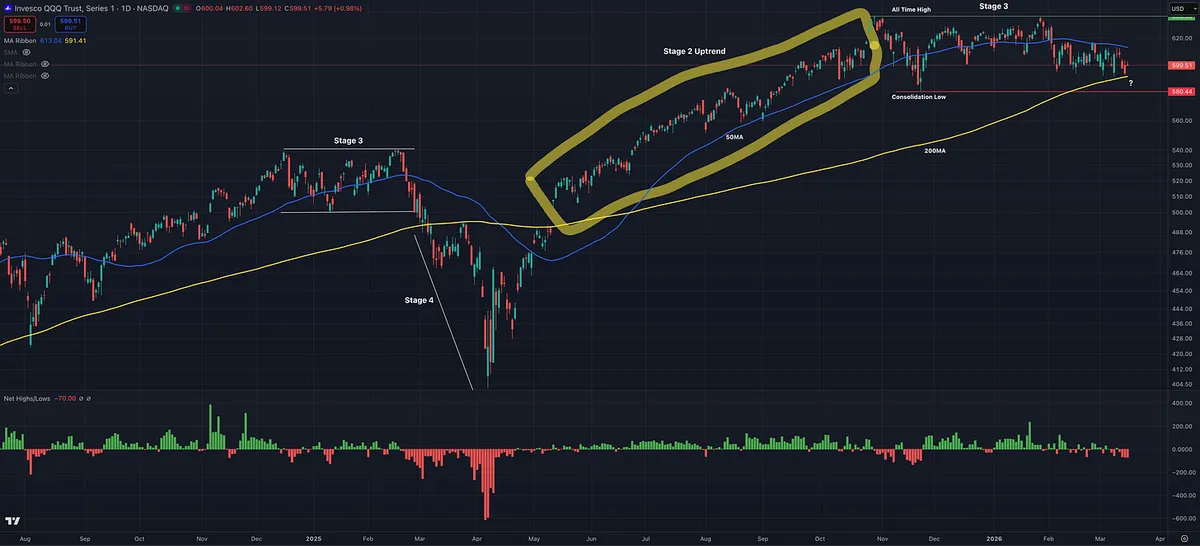
At the start of the year, from January through February, the market was already coming off a long advance and entered a Stage 3 consolidation, chopping sideways.

Then in March and April, the market broke down into a Stage 4 decline, falling below the 200 day moving average as volatility spiked during the tariff scare.

But then something important happened.

By late April, the market began stabilizing and we started to see the first signs of a character change, with price forming a higher low and then a higher high.

By May, the market reclaimed both the 50 day and 200 day moving averages, confirming the transition back into a Stage 2 uptrend.

From roughly May through October, the market entered a much healthier environment. The trend was steady, volatility was contained, and pullbacks were relatively controlled. This is the type of environment where growth stock traders tend to perform best.

Then by late October, the market began stalling again and transitioned back into another Stage 3 consolidation.

So if you step back and look at the entire year, the most favorable window for momentum trading was really just May through October.

That means you could have avoided trading during the first several months of the year and stepped aside again once conditions deteriorated later in the year.

The key lesson is simple.

You do not need to trade all year to have a successful year.

As Jesse Livermore famously said:

“The big money is not in the buying and selling, but in the waiting.”

Many of the best traders generate the majority of their returns during relatively short periods when market conditions are aligned.

The edge is not constant activity.

The edge comes from deploying capital when the environment is supportive and stepping aside when it is not.

View on Substack ↗

Trading Strategies Do Not Work in Every Market Environment

Many traders struggle not because they cannot identify strong stocks or quality setups.

They struggle because they trade those setups in the wrong market environment.

In Module 2 of the Momentum Trading Strategy Course, we focus on developing a deeper understanding of market conditions. We discuss when the environment supports momentum and when it does not.

As Dr. Van Tharp explains:

“The common mistake most people make in designing systems is to try to find a system that works in all market conditions. That’s insane.”

Understanding the market environment helps traders align their strategy with conditions and avoid forcing trades when the odds are not in their favor.

Read the full lesson here: https://tradingmomentum.substack.com/p/momentum-trading-strategy-the-100-e6c

On SubstackMomentum Trading Strategy: The 100-Year Playbook Behind the Biggest Winning Stocks — Module 2
View on Substack ↗

The Market Just Hit the 200 Day. Now Comes the Real Test

And just like that the market reached a key test

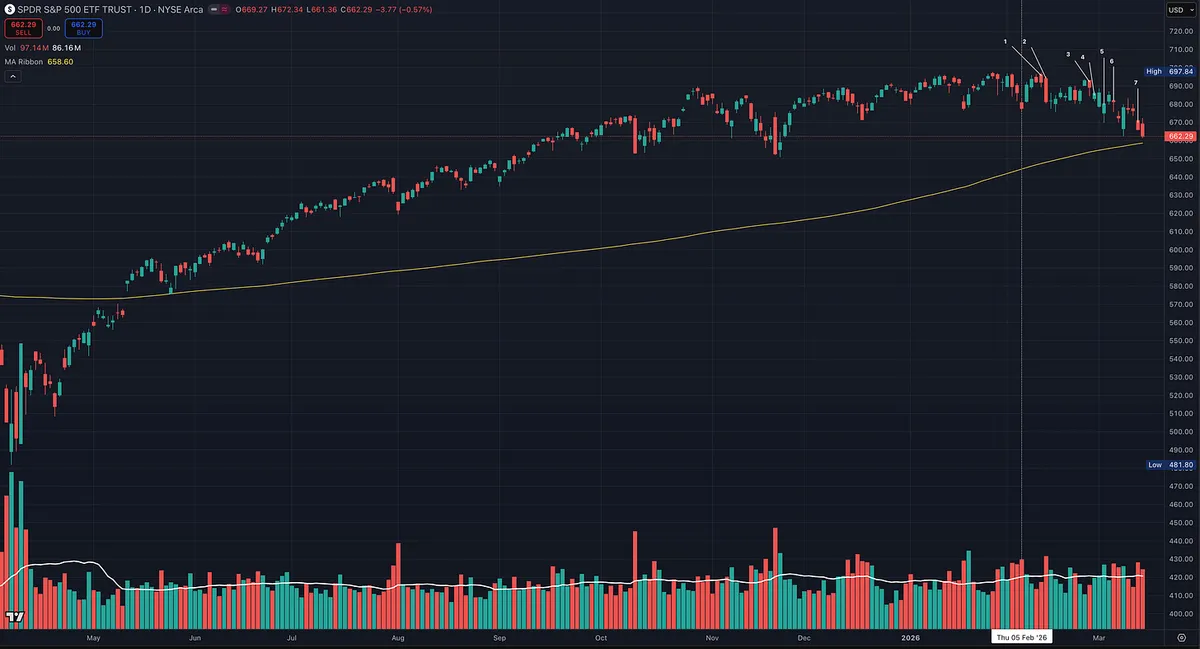
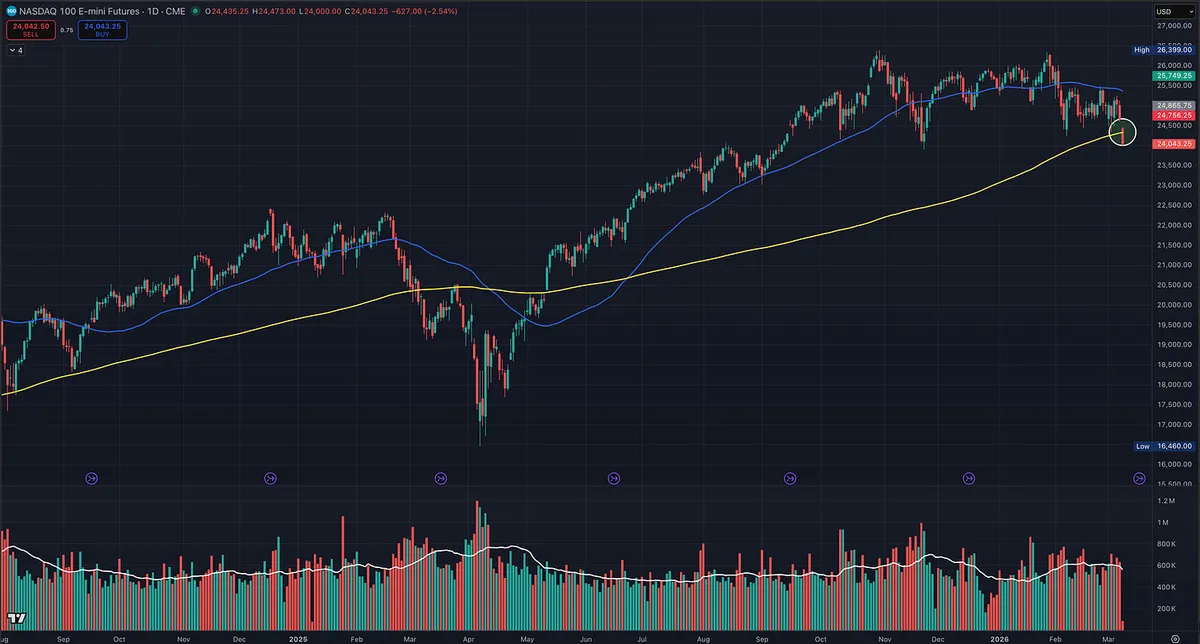
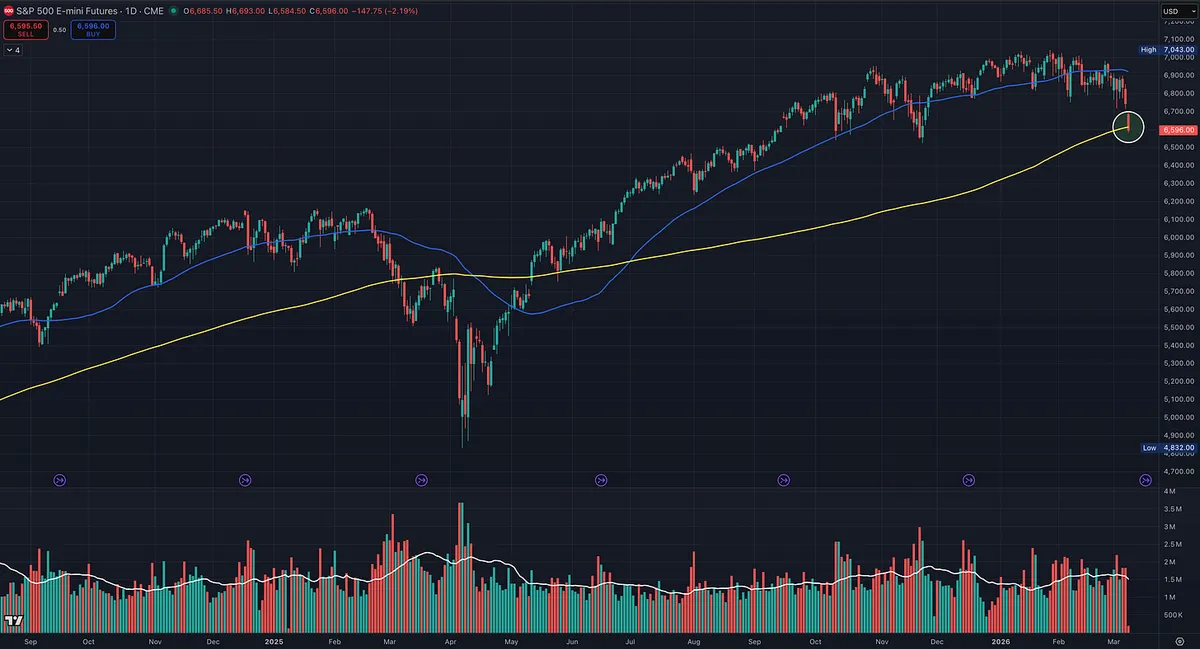
The Nasdaq 100 and S&P 500 futures have pulled back to their 200 day moving averages.

This level is widely watched because it reflects the long term trend institutions follow, but by itself the 200 day line is not a buy or sell signal.

What matters is the price and volume behavior around it.

Right now the market has been showing several caution signals investors should respect.

• A cluster of distribution days, which signals institutional selling

• Weakening market breadth

• Net new lows expanding

The 200 day moving average simply marks an area where the market must prove itself.

If buyers step in and the indexes regain strength, the longer term uptrend can remain intact.

If selling pressure continues and the indexes break lower on heavy volume, it would signal increased market risk and a time to become more defensive.

In other words, the key question is not whether the market touched the 200 day.

The real question is how the market reacts from here.

Historically this is where I have seen support and powerful rallies, and also where I have seen complete failures that led to sharp declines.

As Paul Tudor Jones once said,

“Nothing good happens below the 200 day moving average.”

View on Substack ↗

The Market Is Drifting Toward a Decision Point

Before the trading week begins, it’s important to step back and review the bigger picture.

Major indexes are now drifting toward key support levels near the 200-day moving averages, while last week saw a sharp spike in volatility and a significant deterioration in market breadth. These types of shifts often occur before the market makes its next meaningful move.

In this week’s Big Picture Market Pulse, we break down what the data is telling us right now and the key signals we’re watching for the week ahead.

Read the full report here: https://tradingmomentum.substack.com/p/big-picture-market-pulse-march-8

On SubstackBig Picture Market Pulse | March 8, 2026
View on Substack ↗

A Good Reminder in Tough Markets

“When things aren’t going right, don’t push, don’t press.”

— Richard Dennis

A good reminder in markets like this.

When conditions aren’t right, the best move is often patience.

Not every environment is meant for heavy trading.

Sometimes, cash is a great position.

View on Substack ↗

The Trader the Market Wizards Listened To

While reading Market Wizards by Jack D. Schwager, something stood out to me.

Schwager asked Paul Tudor Jones a simple question.

“Are there any market advisors that you pay attention to?”

His answer was immediate.

“Marty Zweig.”

That made me curious.

Then I noticed something else.

Other legendary traders interviewed in the book also respected Zweig. Traders like Michael Marcus, Bruce Kovner, and Richard Dennis.

Different trading styles.

Different timeframes.

Different personalities.

Yet they all paid attention to the same man.

So I picked up Winning on Wall Street by Martin Zweig.

What stood out was not some magical indicator.

It was his focus on market environment.

Zweig believed big performance happens when the wind is at your back.

Strong liquidity. Healthy breadth. Expanding participation. A market that wants to go higher.

That idea changed the way I approach trading.

Now every weekend I run what I call my Big Picture Market Pulse.

Studying the overall health of the market first.

Because the best stocks tend to make their biggest moves when the environment supports them.

The Market Wizards understood that.

Zweig understood that.

And once you see it, you start looking at the market very differently.

View on Substack ↗

How I Think About Portfolio Exposure

Great question from someone today, so I thought I’d share the response.

Sometimes I do a poor job explaining things in my posts, so hopefully this clarifies how I think about portfolio exposure and position sizing.

—

If my portfolio is only 20-40% invested and I’m in a drawdown or my trades aren’t working, it usually means the market environment isn’t supportive. In that case it makes no sense to increase exposure. I should actually be reducing exposure or even moving to cash.

When the market environment is supportive, like during a Stage 2 uptrend, and individual trades are working, that’s when I increase overall portfolio exposure. Sometimes that can reach 100% invested, with individual positions around 25% in the best names.

When the environment is choppy or consolidating, like it has been recently, and trades aren’t working well, I reduce portfolio exposure and take much smaller positions or move to cash.

Of course this is usually a gradual process. As trades begin working better, I may go from 25% exposure to 50%, depending on the quality and quantity of names showing up in my screens.

This is where trading becomes both an art and a science. Every cycle is similar, but never exactly the same. I allow the market and the stocks themselves to guide how aggressive I get.

So results and market conditions dictate how invested I am, similar to the exposure guidelines O’Neil and IBD often talk about.

Trade small and reduce exposure when things aren’t working. Increase exposure and trade bigger when they are.

View on Substack ↗

This Is Not a “Foot on the Gas” Market

Growth investors are frustrated right now.

And they should be.

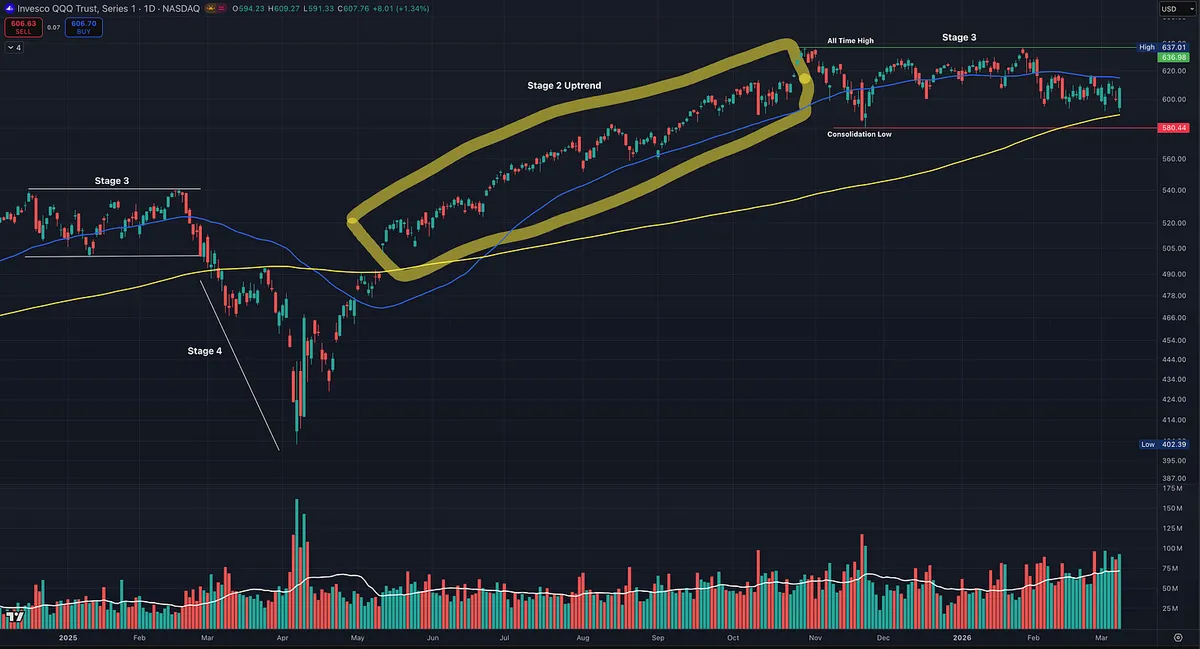
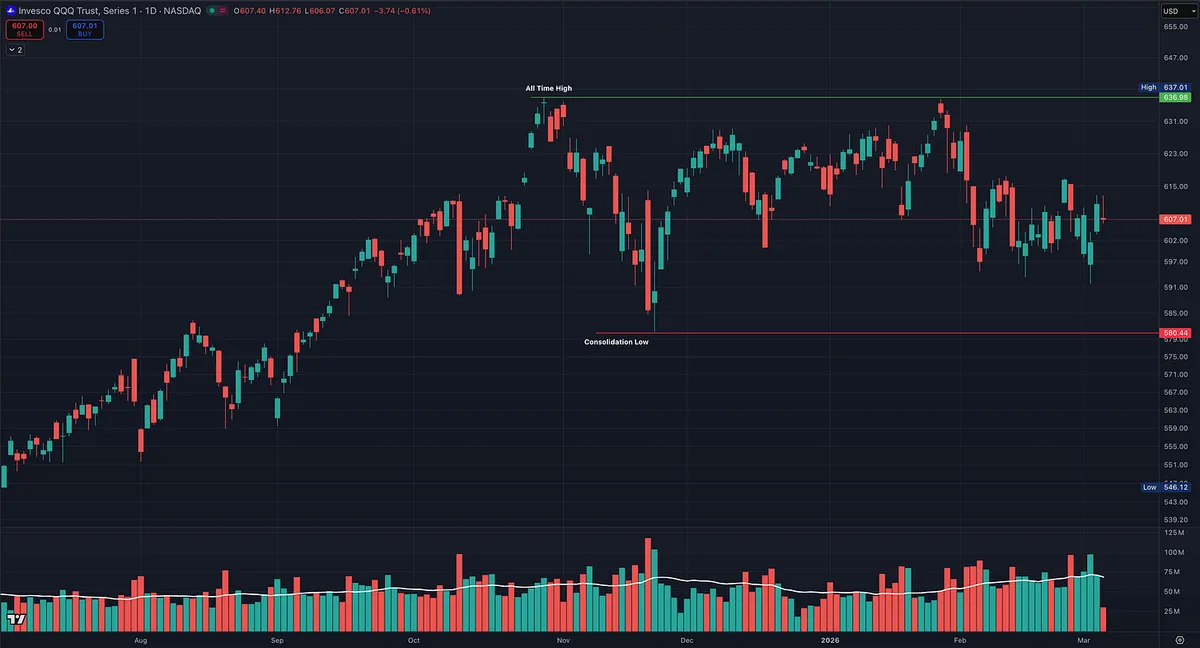
Look at Image 1.

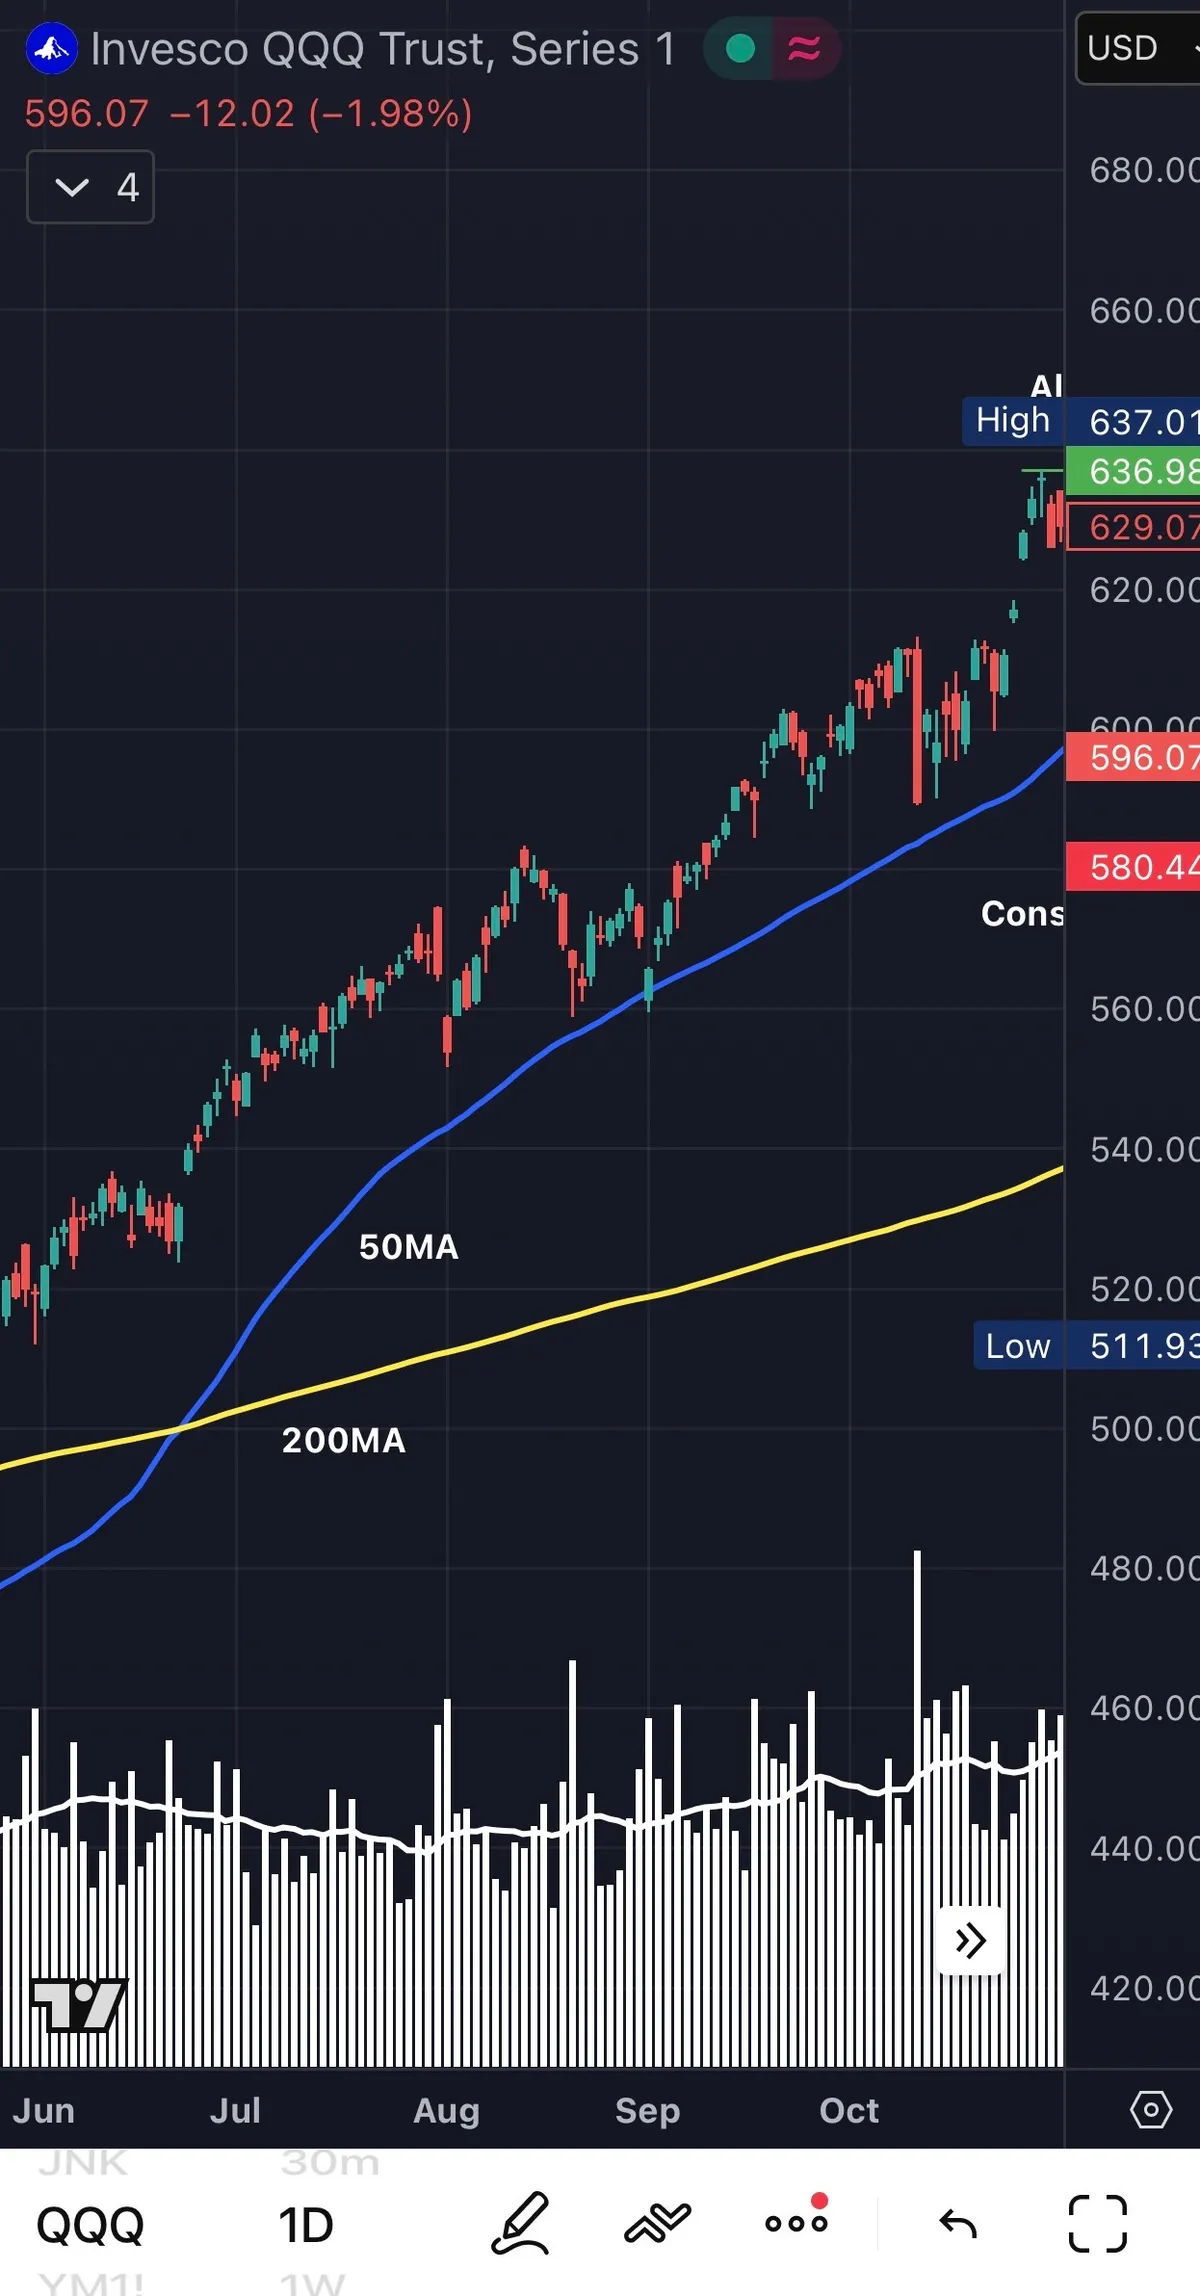
Since the fall of ’25, the QQQ has been in a prolonged consolidation.

Lower highs.

Choppy action.

Failed breakouts.

Distribution weeks mixed with weak rallies.

This is not a clean Stage 2 advance.

This is digestion.

William O’Neil was very clear in his work:

Most investors underperform not because they pick the wrong stocks…

But because they fail to align with the general market.

He studied over 1,000 of the greatest winners and found that 3 out of 4 stocks follow the direction of the general market.

Three out of four.

If the market is chopping, your growth stocks will struggle to gain traction.

And when that happens, professionals do something amateurs refuse to do:

They reduce exposure.

They raise cash.

They protect capital.

O’Neil taught that there are times to be heavily invested… and times to sit tight.

This is a capital preservation environment.

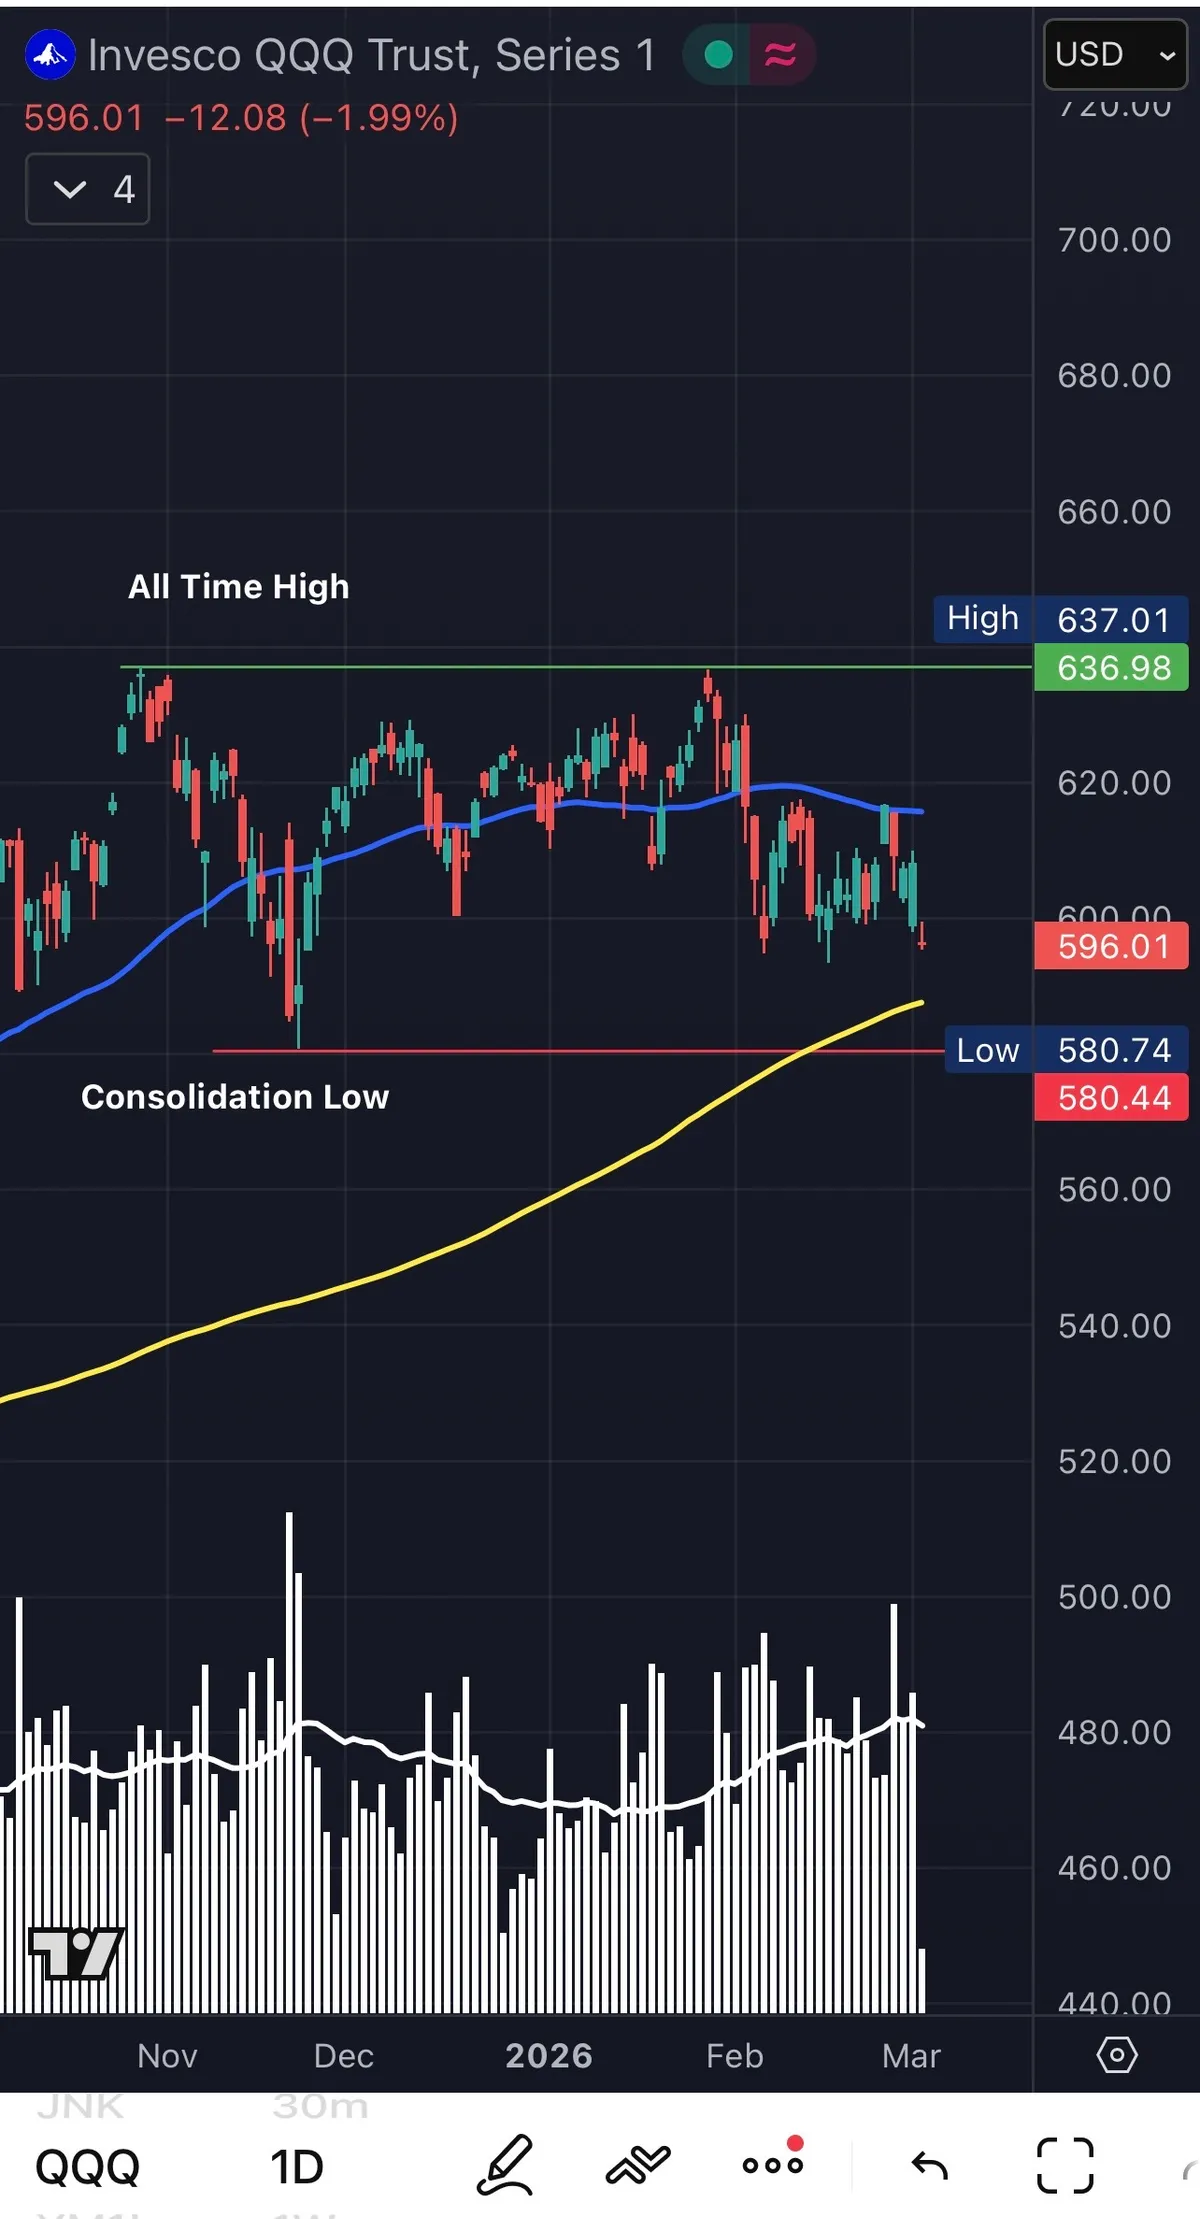
Now look at Image 2.

That is what a Stage 2 uptrend looks like.

Higher highs.

Higher lows.

50 day moving average rising cleanly.

Price respecting support.

Breakouts working.

That is when growth investors thrive.

That is when you increase exposure.

That is when you pyramid strength.

That is when you press your edge.

The mistake most traders make is simple:

They try to force Stage 2 behavior in a Stage 3 consolidation.

The market does not reward urgency.

It rewards alignment.

Professional money managers think in terms of environments, not emotions.

When the wind is at your back, you sail.

When it is not, you lower the sails and preserve the boat.

Right now, the job is not to be heroic.

It is to be disciplined.

And when the next true Stage 2 begins, you will have capital, clarity, and confidence to attack it.

View on Substack ↗

Geopolitical Headlines Get Priced In Faster Than You Think

Anyone that has been in the markets for a minute knows geopolitical flare ups like what we are seeing with Iran usually get priced in fast.

It is completely normal to see markets drop on the initial headline shock.

Oil spikes. Futures dip.

Then something interesting happens.

By the end of the week, a lot of that fear gets absorbed.

I am not a macro guy. I do not base my trading on any news feed. I do not trade headlines.

I will decide what to do based on price action and my criteria for stock picking. That is it.

But a lot of new traders get spun up in this stuff.

They see red futures and assume this is the start of something catastrophic.

Historically, most geopolitical shocks create an initial drop. Then they get priced in faster than people expect.

Markets are forward looking machines.

Unless there is a prolonged structural disruption, we often see fear fade and price recover quicker than the crowd thinks is possible.

I do not have a crystal ball.

I am just saying this is not something to panic over.

Watch price.

Stick to your rules. Focus on what you can control.

Let the market tell you what matters.

View on Substack ↗

Zoom Out Before You Zoom In

Before the week ahead, spend time zooming out before you zoom in.

This is the professional weekend process. We step back, assess the primary trend, measure leadership, evaluate breadth, credit, liquidity, and sector rotation, and only then move into stock selection.

Preparation precedes execution.

This week’s Big Picture Market Pulse walks through the full top-down framework before we refine into actionable setups.

Serious traders prepare first.

https://tradingmomentum.substack.com/p/big-picture-market-pulse-march-1

On SubstackBig Picture Market Pulse | March 1, 2026
View on Substack ↗

What Druckenmiller, O’Neil, and Minervini All Understand About Market Shifts

If you trade long enough, you will feel it.

Something that worked beautifully… suddenly doesn’t.

Breakouts fail. Follow through days don’t follow through. Trend trades chop.

And the temptation is to think:

“It’s broken.”

But here’s what Stanley Druckenmiller makes clear.

He said:

“That's not true anymore because everybody else has learned that.”

And:

“I haven't unlearned them, but I don't rely on them to the extent that I used to.”

He also said:

“There's no silver bullet.”

That is the key.

There are foundational truths in markets that never change:

  • Supply and demand

  • Crowd psychology

  • Leadership cycles

  • Trend persistence

But tactics can fluctuate in effectiveness.

This does not contradict William J. O'Neil. It supports him.

O’Neil constantly stressed that most breakouts fail in corrections and that the general market direction determines your success rate.

It does not contradict Mark Minervini either.

Minervini emphasizes environment. He teaches that optimal conditions increase probability and poor conditions demand defense.

The principle stays.

The environment shifts.

Breakouts do not “stop working.”

They work when conditions are right.

Trend following does not die.

It underperforms when markets are hostile.

The edge is not blind loyalty to a tactic.

The edge is awareness.

Adapt exposure. Adjust aggressiveness. Stay anchored to core principles.

Markets evolve.

Discipline does not.

View on Substack ↗

The M in CAN SLIM Is Not Optional

Stay aligned with the M in CAN SLIM.

Zoom out before you zoom in.

Before screening stocks, building watchlists, setting alerts or mapping out your trades for the week, step back and evaluate the overall market environment.

Many traders have experienced a “death by a thousand cuts” over the past several weeks. Not because the market is broken, but because what worked earlier in this bull phase is not what is working now.

Leadership has shifted.

Those who zoomed out sooner recognized the rotation. Others may now be realizing that the areas showing strength are not their typical expertise or preferred style of trading.

That awareness matters.

The market does not care what worked last year. It rewards alignment, not habit.

Start with the market. Then refine your process.

The full post is live.

https://tradingmomentum.substack.com/p/big-picture-market-pulse-february-0be

On SubstackBig Picture Market Pulse | February 22, 2026
View on Substack ↗

Rotation Is Not the End. It Is the Reset.

Technology, software, and semiconductors led this bull market.

Now they are under pressure.

Distribution has shown up. Relative strength has cooled. Former leaders are correcting hard.

That is not abnormal.

It is exactly how bull markets mature.

O’Neil showed that industry leadership rotates, but powerful themes often resurface with new companies driving the advance. Innovation does not disappear. It shifts hands.

Minervini teaches that leaders top first, correct deeply, and later the strongest stocks rebuild proper Stage 2 bases before emerging again.

The key distinction:

Old leaders rarely reclaim leadership. Strong industry themes often do.

After extended advances, superperformance stocks frequently decline 50 percent or more. That decline is not the death of the group. It is the reset that clears weak hands and allows new accumulation.

The next tech advance will not be led by stocks trying to recover broken charts.

It will be led by:

New bases New earnings acceleration New relative strength leaders New institutional accumulation

This is normal cycle behavior.

Capital rotates out of extended leaders. Groups consolidate. New names rise from the same ecosystem.

Semiconductors led before. Software led before. They can lead again.

But leadership must be proven again through price, volume, and earnings.

That is the process.

And that process is what creates the next superperformance opportunity.