Not All Swing Traders Are on the Same Time Frame
Two traders can both call themselves swing traders and still be playing completely different games.
Two traders can both call themselves position traders and still be managing completely different time frames.
That is one concept I forget many beginner and even intermediate traders have not fully learned yet.
Most people understand the basic labels.
Day trading usually means you are in and out the same day.
Swing trading usually means holding for a few days to a few weeks.
Position trading usually means holding for weeks to months.
Simple enough.
But the real world is not that clean.
There is a huge gray area between swing trading and position trading.
Some swing traders use intraday charts for execution. Some do not. Some swing traders focus mostly on the daily chart, while others use the daily and weekly structure together.
Position traders can be just as different. Some use the daily and weekly charts. Some care mostly about the weekly chart. Others use the weekly and monthly charts to manage the bigger trend.
And some position traders still look at intraday charts, daily charts, and weekly charts at the same time. They may use the lower time frames for entry and the higher time frames to manage the trade.
This is why one trader can be short a stock and make money while another trader is long the same stock and also make money.
That sounds impossible until you understand time frame.
One trader might be shorting a short-term overextension.
Another trader might be long from a much lower base, holding through normal volatility.
One trader might be managing a 2-day trade.
Another might be managing a 6-month position.
Both can be right.
Both can be profitable.
And the reverse is also true.
Two traders can be on opposite sides of the same stock and both lose money if their timing, sizing, risk management, or execution is poor.
This is why blindly copying someone else’s trade is dangerous.
When you hear that a famous investor is short a stock, you usually do not know their entry, size, hedge, time horizon, partial exits, risk plan, or real objective.
You do not know if they are managing a trade, a hedge, a portfolio position, or a thesis that may take years to play out.
So when people jump online and say, “Aha, he was wrong,” just because the stock went up, they are often revealing more about their own lack of trading knowledge than the investor they are criticizing.
The market does not grade opinions.
It grades time frame, entry, exit, size, risk, and execution.
That is why multiple time frame analysis matters.
Yes, when multiple time frames are aligned, the probability of a trade working usually improves.
And yes, when traders review their losing trades, they often find the same mistake:
They executed on a lower-time-frame signal while the higher time frame was moving against them.
But this note is about something even more basic.
When you are reading Substack, scrolling Twitter, watching YouTube, or listening to someone discuss a stock, you need to understand that everyone may be speaking from a completely different time frame.
Even if they use the same label.
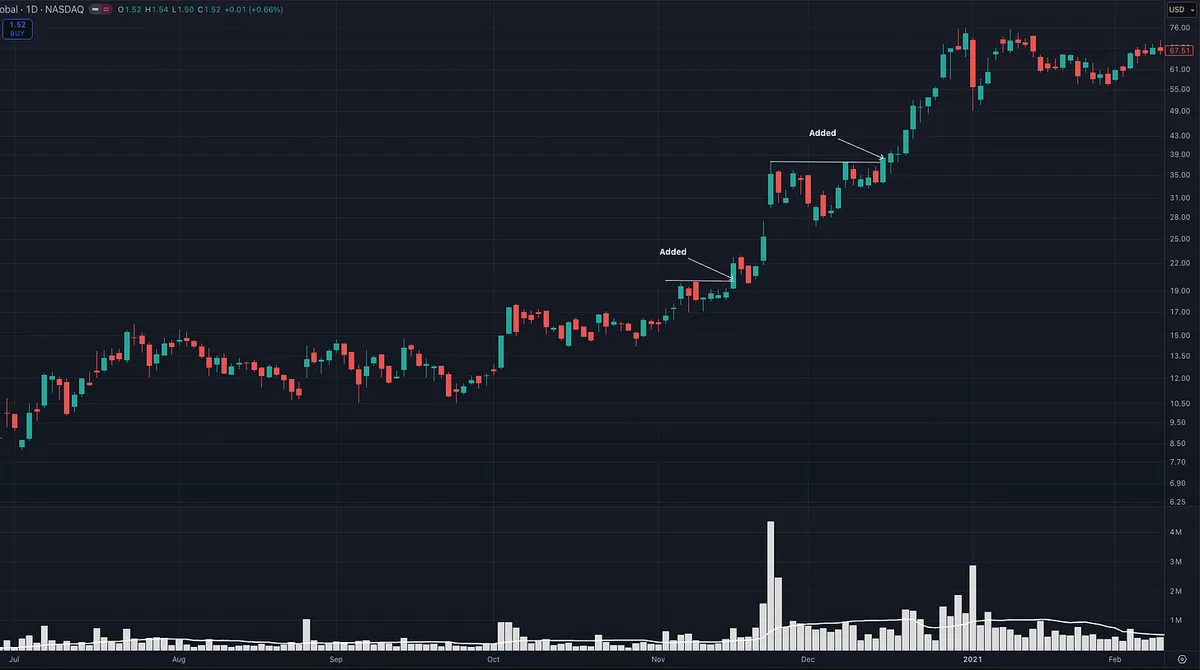
A stock can be bullish on the weekly chart, extended on the daily chart, and breaking down on the 15-minute chart, all at the same time.
That does not mean the chart is confused.
It means you need to know what game you are playing.
Before you ask, “Is this stock bullish or bearish?”
Ask a better question:
“On what time frame?”