Swing Trader or Position Trader? The Difference Is Management
The underlying strategy may be the same. What changes is the entry, holding period, and method used to manage the trade.
Time frame affects how long we hold a position and how we manage the trade. It does not necessarily change the foundation of the strategy.
Mark Minervini describes swinging in and out of stocks to compound capital, while David Ryan emphasizes holding winners as long as the uptrend remains healthy. These are tendencies, not rigid rules.
Minervini may hold an exceptional winner for multiple quarters, while Ryan will exit immediately if a new position hits his stop or doesn’t act right.
William O’Neil also combines profit-taking rules with provisions for holding exceptional winners longer. Position trading does not mean holding every purchase for years or tolerating big drawdowns. The longer holding period applies only to stocks that continue acting correctly.
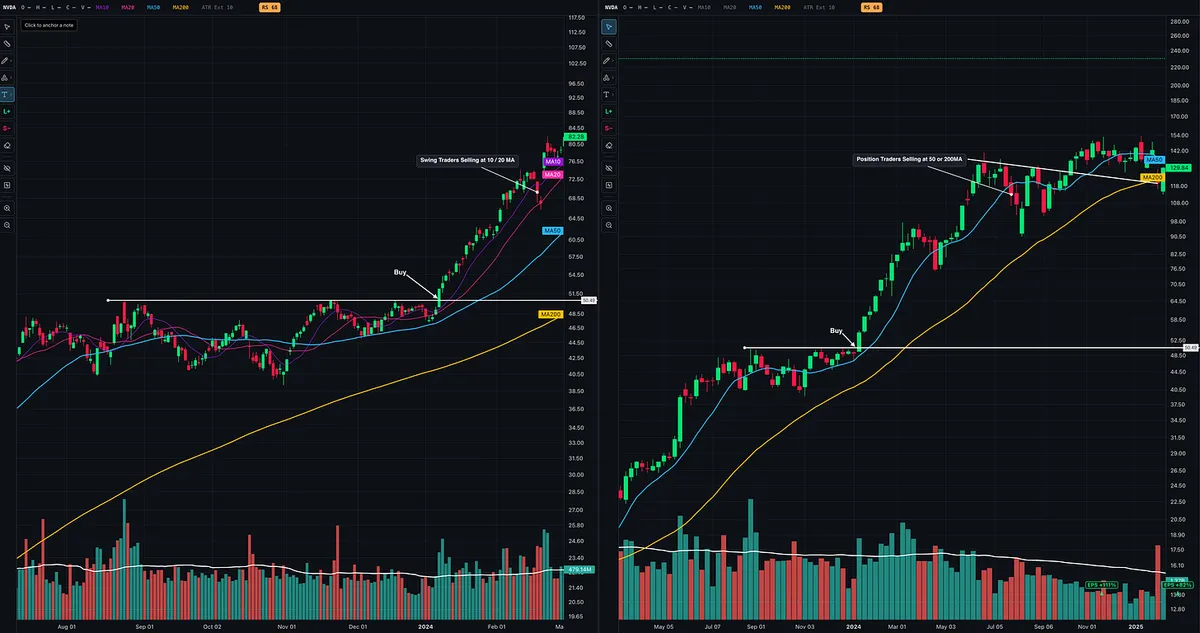
NVDA illustrates how the same opportunity can be managed differently depending on the trader’s time frame.
In this example, both traders enter at the same breakout.
The swing trader may capture the faster portion of the move and begin selling as the stock loses its shorter-term 10-day or 20-day moving averages. The position trader may give the stock more room and use the 50-day or even the 200-day moving average, along with the larger price structure, to participate in a longer advance.
They do not have to use the same entry, either.
One trader may enter on an early cheat, pullback, or pullback reversal, while another waits for the traditional breakout. These are differences in execution, not necessarily differences in the underlying strategy.
Many newer traders confuse a trader’s time frame with the time frame of the chart being viewed. They are related, but they are not the same thing.
A setup can be visible on the weekly chart that is not as clear on the daily chart. A shorter, tighter setup may also appear on the daily chart without creating a distinct pattern on the weekly chart.
Ideally, as we see in this NVDA example, the daily and weekly charts are aligned. The weekly chart confirms the larger Stage 2 uptrend and overall price structure, while the daily chart provides a more precise view of the setup, entry, and risk.
David Ryan is primarily a position trader, but he studies both daily and weekly charts. Minervini generally trades shorter-term swings, but he also uses both.
A swing trader may naturally rely more heavily on the daily chart for setups, entries, and trade management while using the weekly chart for context. A position trader may rely more heavily on the weekly chart for the larger trend and base structure while using the daily chart to refine entries and manage risk.
The chart time frame is the lens being used. The trading time frame is how the position is managed.
A position trader generally seeks to compound capital by giving winning stocks more time to produce larger gains. A swing trader seeks to compound the account through greater trade frequency.
What they share is more important than what separates them.
Both are buying a high-relative-strength leader in a confirmed Stage 2 uptrend with constructive price and volume characteristics. The opportunity may be the same. The difference is how each trader chooses to manage it.