Momentum Trading Strategy

Notes

Finding Leading Stocks

What to buy: how to find, screen and rank the strongest stocks and industry groups.

Showing 21–28 of 28 notes

$SNDK ×
View on Substack ↗

This Is Why You Track Leadership Before Everyone Else Sees It

On April 8, the market gave us the signal.

We had a follow-through day, the NASDAQ-100 reclaimed key moving averages, including the 50-day and 200-day, and the conversation shifted from defense back toward offense.

But the real edge was not just knowing the market was improving.

The edge was knowing where to look.

When the market gets stronger, I want to be focused on the strongest industry groups and the strongest stocks inside those groups.

That is exactly what we had been tracking for months.

  • Telecom.

  • Computer Data Storage.

  • Semiconductors.

Many of these names were not random new ideas. They had already been showing up in our work, some for months, and some even last year.

So when the market confirmed on April 8, there was no need to bounce around looking for the next hot ticker.

The leadership was already there.

From the April 8 signal to yesterday’s close:

AAOI up 40%

LITE up 12%

CIEN up 12%

VIAV up 30%

SNDK up 81%

WDC up 38%

STX up 53%

TER flat

AEIS down 4%

AEHR up 50%

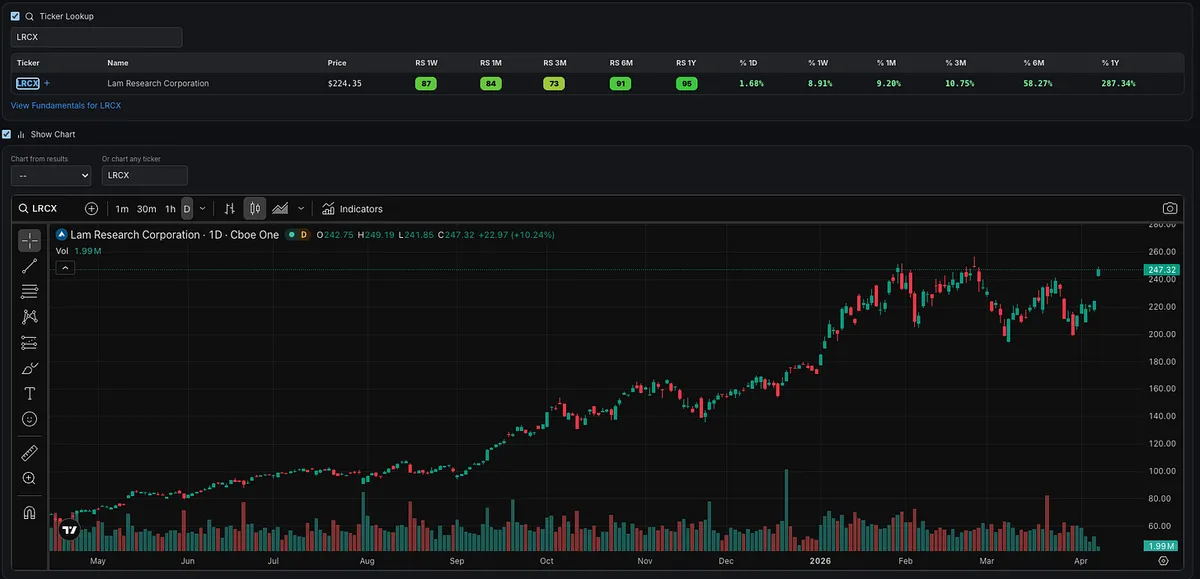
LRCX up 12%

FIX up 30%

GLW flat

Not every stock works.

That is normal.

But when the market confirms, and multiple stocks from the same leading groups start moving together, that is usually not a coincidence.

That is institutional money flowing into a theme.

Strong market.

Strong industry groups.

Strong stocks.

That is the process.

The goal is not to chase every move.

The goal is to already know where the strength is clustering before the move becomes obvious.
View on Substack ↗

What We Actually Do As Momentum Traders

For those of you that are new, here’s what we actually do.

Momentum Trading Strategy primarily focuses on swing and position trading, mainly in growth stocks, while following the trend.

Our strategy is rooted in principles that have worked for over 100 years.

The foundation comes from traders such as Jesse Livermore, Gerald Loeb, Bernard Baruch, Richard Wyckoff, Nicolas Darvas, William O'Neil, and more modern traders like Mark Minervini, David Ryan, Dan Zanger, Kristjan Kullamägi, along with many U.S. Investing Champions.

Different eras.

Same principles.

So what are we primarily looking for?

When the market is bad, we are preserving capital.

We are mostly in cash.

We are preparing for the next Stage 2 uptrend.

When the market is healthy, we are looking to participate in the strongest industry groups.

This changes cycle to cycle.

More recently, we’ve seen strength in areas like computer data storage with names like SNDK.

Telecom with LITE.

And semiconductors with AAOI.

Within these hot industry groups, we are looking to trade the biggest names and the best leaders.

These tend to have high relative strength (RS), meaning they are outperforming the index and most other stocks in the market.

They also have fuel driving that strength.

That fuel usually comes from:

  • Strong earnings

  • Strong sales

  • Or acceleration in earnings and sales

Also, something that might catch the market off guard.

These stocks are typically making new highs repeatedly.

If you look at the chart, they are consistently forming higher highs and higher lows.

So what we are doing is aligning:

  • The overall bull market theme

  • The hottest industry groups

  • The strongest stocks within those groups

All while looking to enter at points that offer low-risk, high-reward opportunities.

If we are wrong, we lose a small amount.

If we are right, we make multiples of that risk.

3x. 5x. 10x. 15x. 20x.

That’s the entire game.

My goal is to provide you with all the tools necessary to actually do this.

Paid subscribers get access to:

  • A web app with a Relative Strength Stock Screener to find these types of stocks

  • A weekly market newsletter to help you stay aligned with the market

  • A Relative Strength dashboard

  • A watchlist feature and additional risk management tools

  • Shared stock ideas and scans

  • And a full course that breaks all of this down in depth.

All for $120 per year.

That’s only $10 per month.

If that’s too expensive, then frankly, you probably shouldn’t be trading.

View on Substack ↗

This Is What Real Leadership Looks Like

It’s not a coincidence.

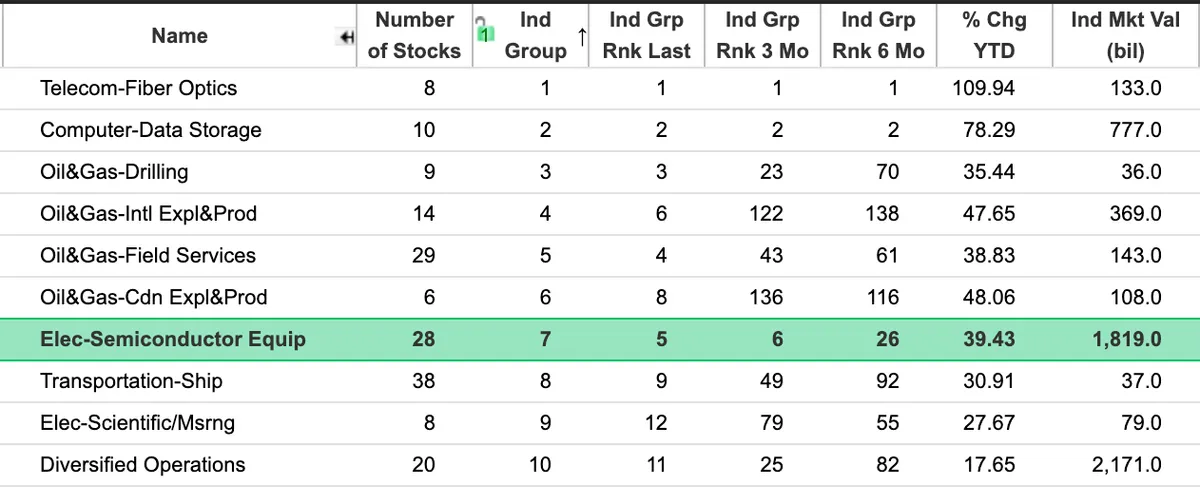
When we look at the Top 10 Industry Groups right now, we’re seeing clear clustering of strength:

  • Telecom: AAOI, LITE, CIEN, VIAV

  • Computer Data Storage: SNDK, WDC, STX

  • Semiconductors: TER, AEIS, AEHR, LRCX

All showing up in the top groups.

This is exactly how leadership reveals itself.

It’s not just one stock. It’s clusters of strength moving together.

When you start seeing multiple names across the same industry groups all:

  • Breaking out

  • Showing strong relative strength

  • Backed by strong fundamentals

That is not random.

That is institutional money flowing into a theme.

This is how real trends work.

Stay focused on where the strength is clustering, just like we teach in the MTS Course. https://tradingmomentum.substack.com/s/mts-course

How do we find the strongest names in the strongest groups?

Relative Strength Stock Screener.

Use it now as part of the MTS Web App https://momentumtradingstrategy.app/

That’s where the opportunity is.

momentumtradingstrategy.appMomentum Trading Strategy
View on Substack ↗

Why I Mentioned AAOI Before Earnings

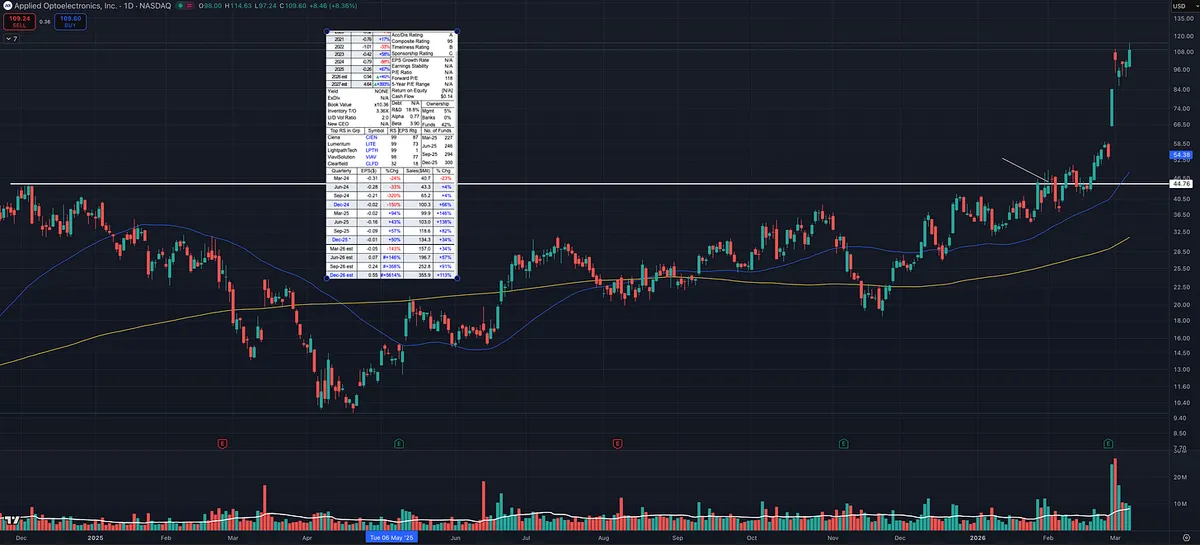
Someone asked why I mentioned AAOI in early February with earnings coming up.

First, the stock checked several boxes I look for.

It was in a HOT group (telecom) showing strong relative strength across multiple timeframes. I had already seen success with LITE and CIEN, which are in the same space. It reminded me of past industry runs like the computer data storage group when SNDK, MU, WDC, and STX all moved together.

AAOI also had:

• Strong earnings and sales acceleration

• Rising forward estimates

• Accelerating fund ownership

• Tight price action on the right side of the chart

• Trading near new 52 week highs

Since that mention the stock has moved about 150%, but the trade management is the important part.

I normally do NOT buy a stock a few days before earnings. There is too much risk and no time to build a cushion.

I follow the advice from Paul Tudor Jones:

“Never trade in situations where you don’t have control. For example, I don’t risk significant amounts of money in front of key reports, since that is gambling, not trading.”

In this case there were about three weeks before the report, which gave the trade time to work.

From the original buy, the stock moved roughly 30% before earnings.

At that point the plan becomes simple:

• Trim a large portion before the report

• Lock in gains and reduce risk

• Hold a smaller position into earnings

Even great stocks can drop 15–20% overnight on earnings.

By trimming beforehand, the position already has a profit cushion, so the remaining shares carry much less risk.

This is something I learned studying the playbooks of William O’Neil, Mark Minervini, and David Ryan.

The goal isn’t predicting earnings.

The goal is managing risk while letting strong stocks work in your favor.

View on Substack ↗

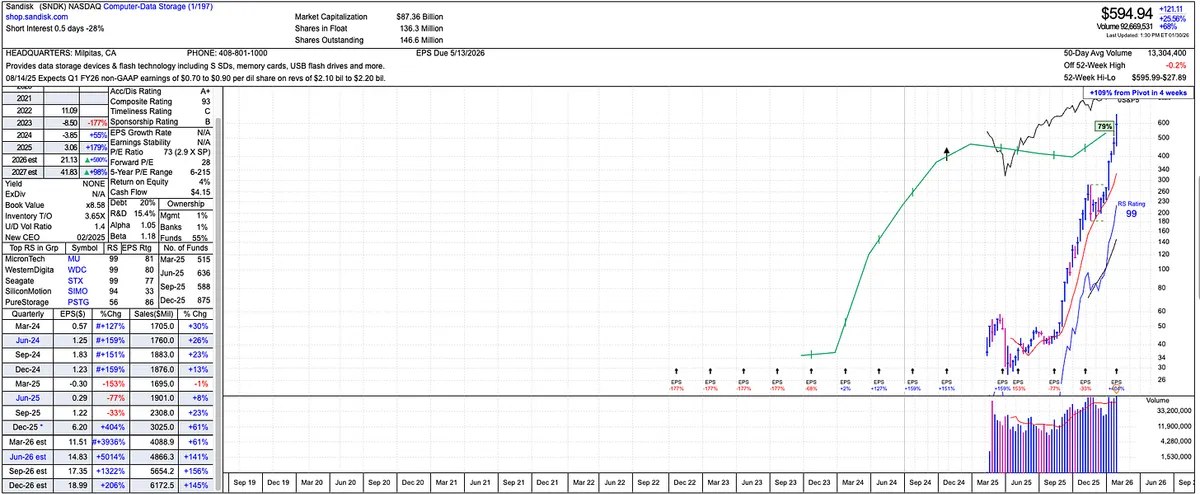
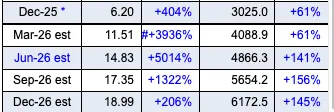
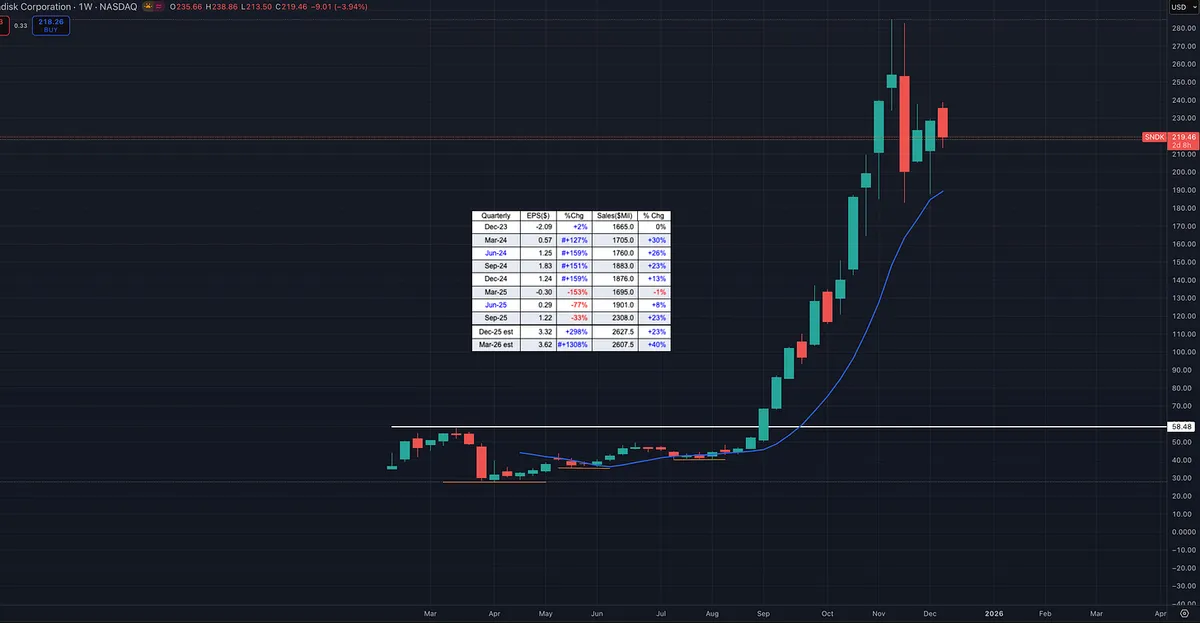
Look at Sandisk’s earnings and sales estimates heading into 2026.

This is a great reminder that markets are always looking forward, not backward.

The heavy buying in this stock didn’t start when the numbers looked good. It started much earlier, when earnings were weak and sales were just beginning to turn. Price and relative strength moved first. Fundamentals followed later.

That’s often how leadership develops.

By the time the estimates look obvious to everyone, a large part of the move may already be behind us… or it may still be early in a much bigger trend.

Only time will tell.

This is why price action, relative strength, and industry leadership matter so much. They often hint at what’s coming well before it shows up cleanly in the fundamentals.

View on Substack ↗

Study This Chart. This Is Leadership.

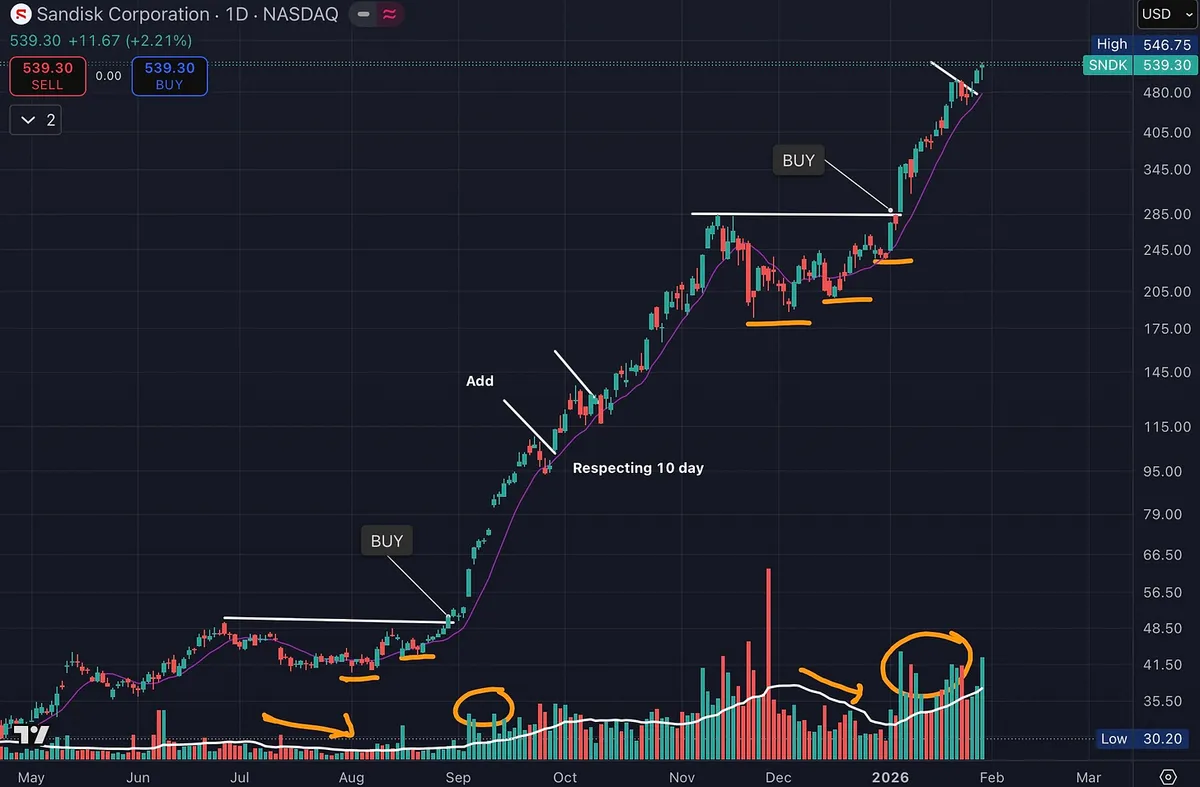
One area that has quietly dominated since the April correction is data storage, a key part of the broader AI theme.

SNDK is a great example.

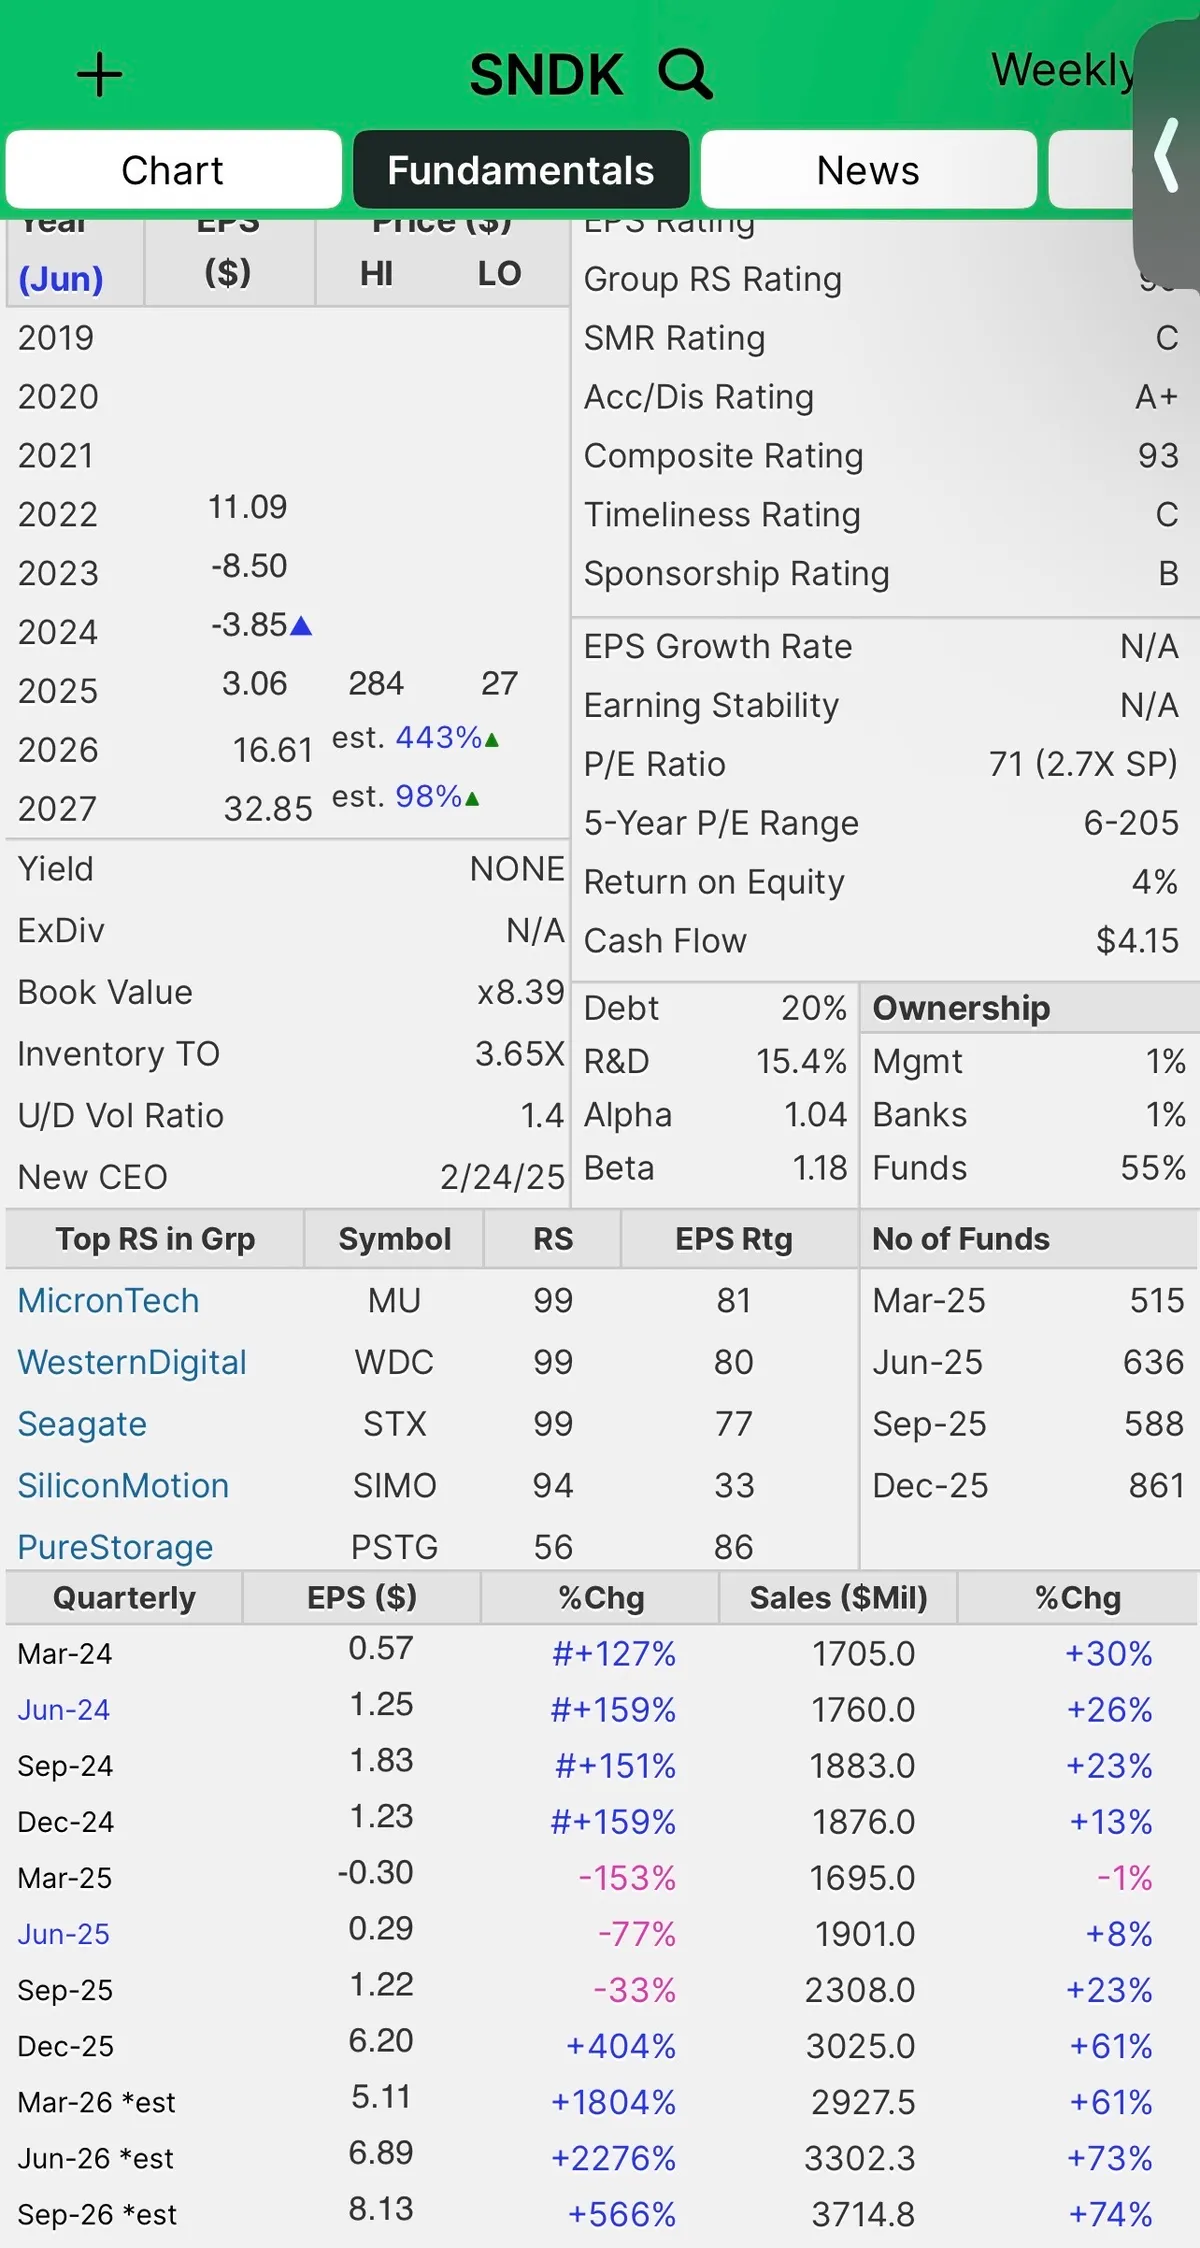
The fundamentals are there.

High relative strength.

Earnings and sales acceleration.

Rapid increase in fund ownership.

But the real lesson is in the chart.

Price exploded higher on heavy volume. That’s institutional demand showing its hand.

Then price paused.

Volume dried up during consolidation. Pullbacks stayed shallow. The right side tightened up. Sellers stepped aside.

Price respected the 10-day moving average with a smooth, orderly advance. No volatility. No panic. Just controlled strength.

Then it did it again.

Another tight consolidation.

Another dry-up in volume.

Another expansion higher on strong volume.

This is textbook supply and demand in action.

Strong stocks don’t give back much. They move up, rest, absorb supply, and continue higher. That’s exactly what’s happening here.

And this wasn’t a one-off.

The category gave it away. Other data storage names were acting the same way. When multiple leaders in a group show identical behavior, pay attention.

This is the kind of chart that should be studied over and over.

Not because it’s perfect.

But because it clearly shows where risk is defined and why big trends are built the way they are.

Charts like this are how you learn to recognize real leadership.

Study this.

View on Substack ↗

This Is What Institutional Accumulation Looks Like

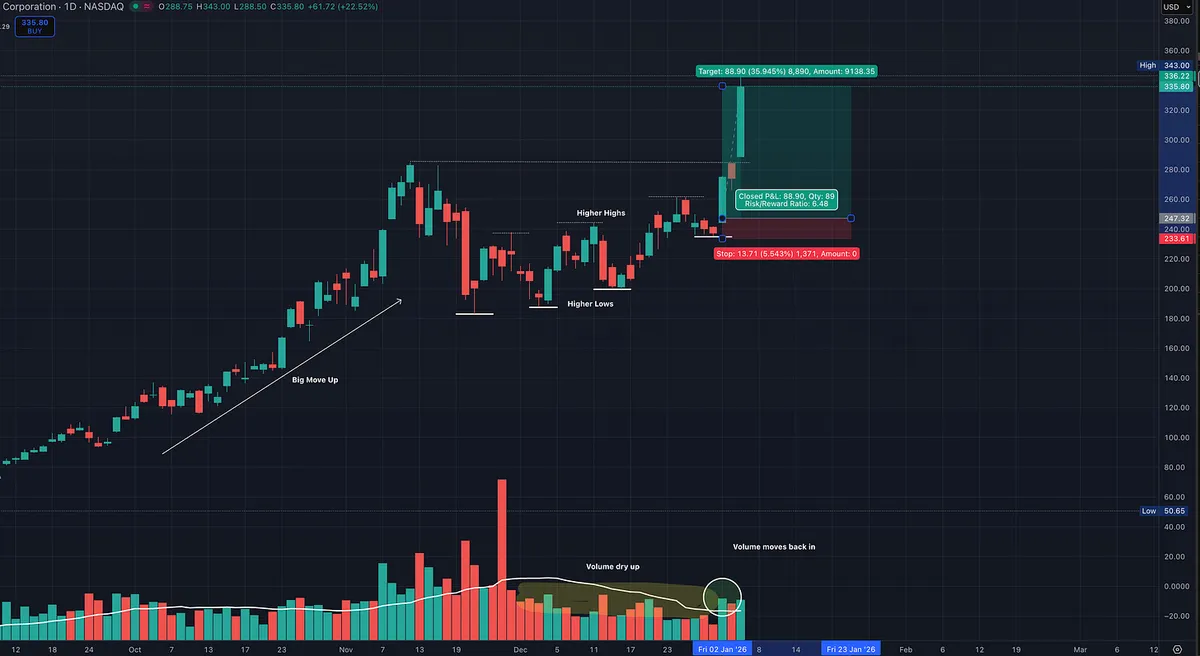
Here is a great example of a true leader digesting a major advance. Volume dries up as price tightens, forming higher lows and higher highs. Selling pressure fades while the structure strengthens.

As volume begins to move back in, demand returns ahead of the next powerful move higher.

SNDK also shows increasing fund ownership, confirming institutional accumulation. With a 99 Relative Strength rating, this is exactly the type of behavior you want to see in big winners before the next leg.

View on Substack ↗

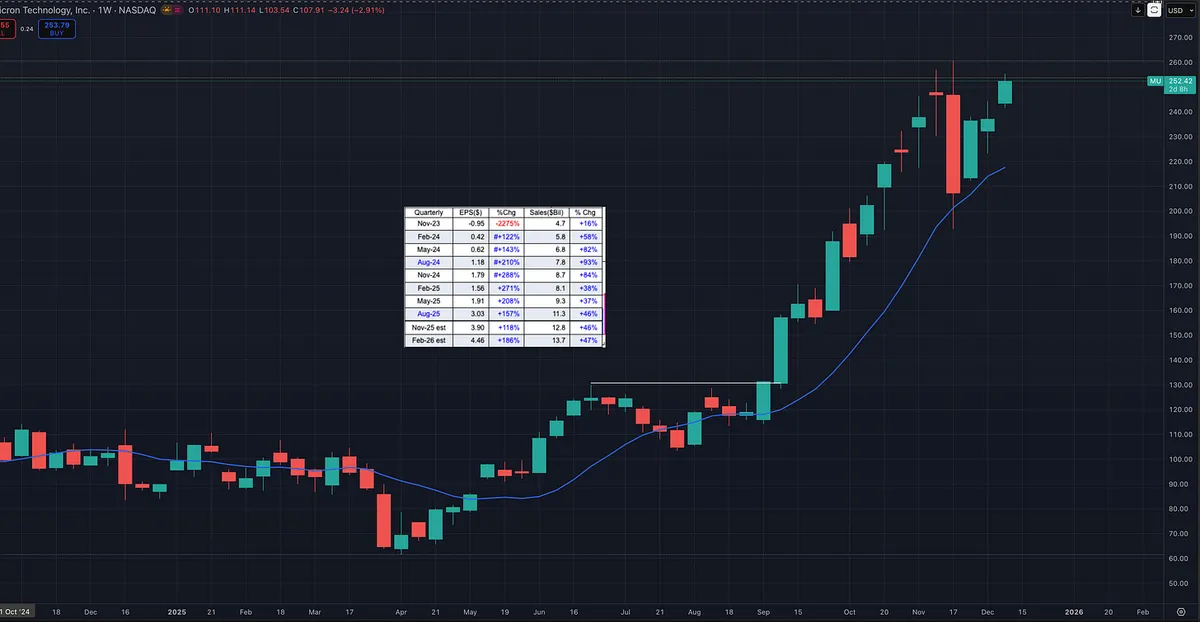
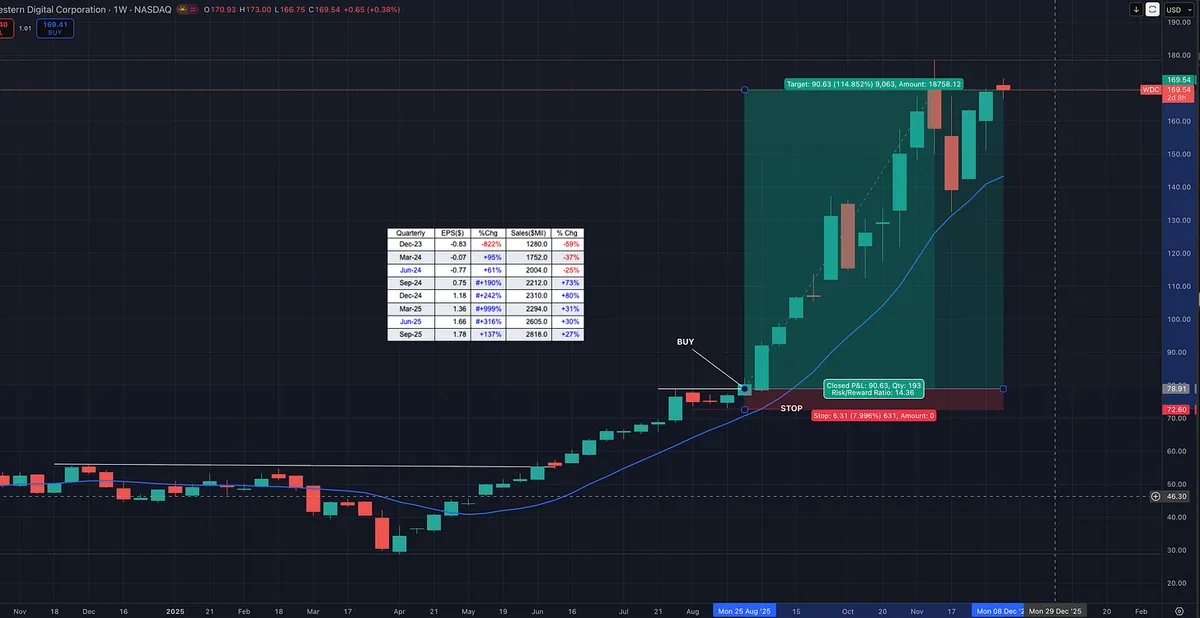
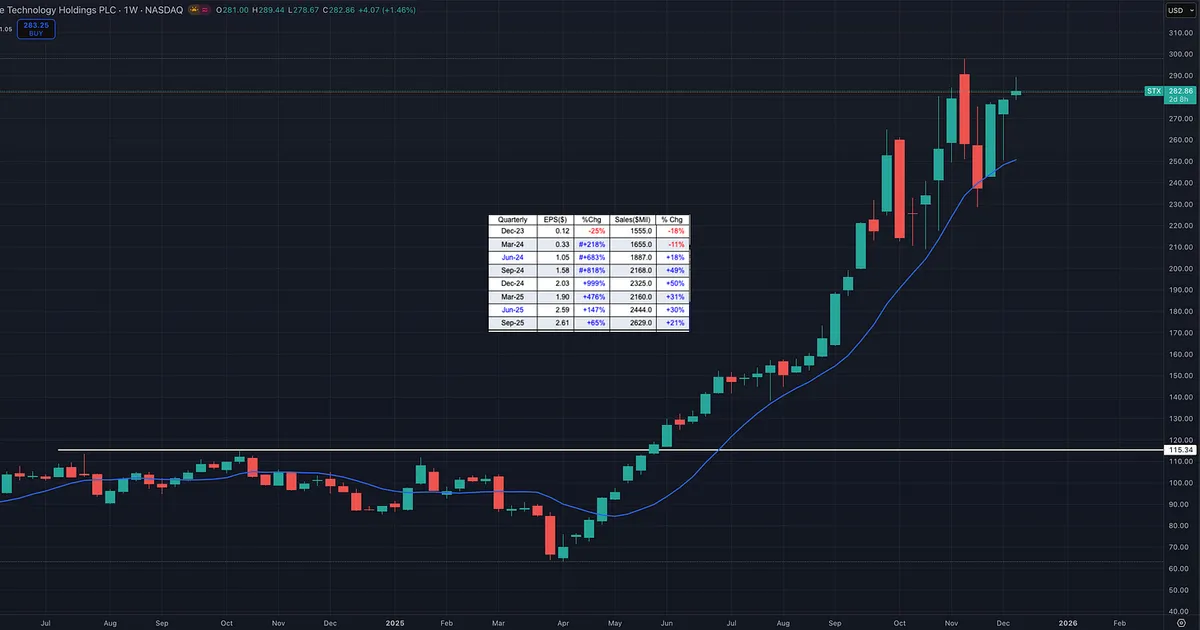
Data Storage Quietly Became One of the Strongest Leadership Groups in the Market

While everyone kept talking about chips, metals, and AI all year, the real expansion of this bull cycle has been happening somewhere else: data storage.

MU, WDC, STX, and even SNDK have been posting massive earnings and sales acceleration. SNDK has not delivered the same near-term numbers, but analysts and funds are clearly positioning for future growth and the stock has surged alongside the leaders.

This entire group started emerging back in April. Since then, the charts, the tape, and the fundamentals have all lined up.

This is exactly why serious traders track relative strength stocks and relative strength industry groups. Leaders rarely move alone. The biggest moves come when multiple stocks in the same industry begin showing strength at the same time, which is a sign that big money is rotating into that group.

When a major theme like AI takes hold, leadership does not stay static. It expands. And by the time most people finally recognize the True Market Leaders, the next group is already breaking out.

Watch the stocks. Watch the groups. Watch the earnings and sales.