The Answer: Stock C
Obviously, this one was too easy. You all got it.
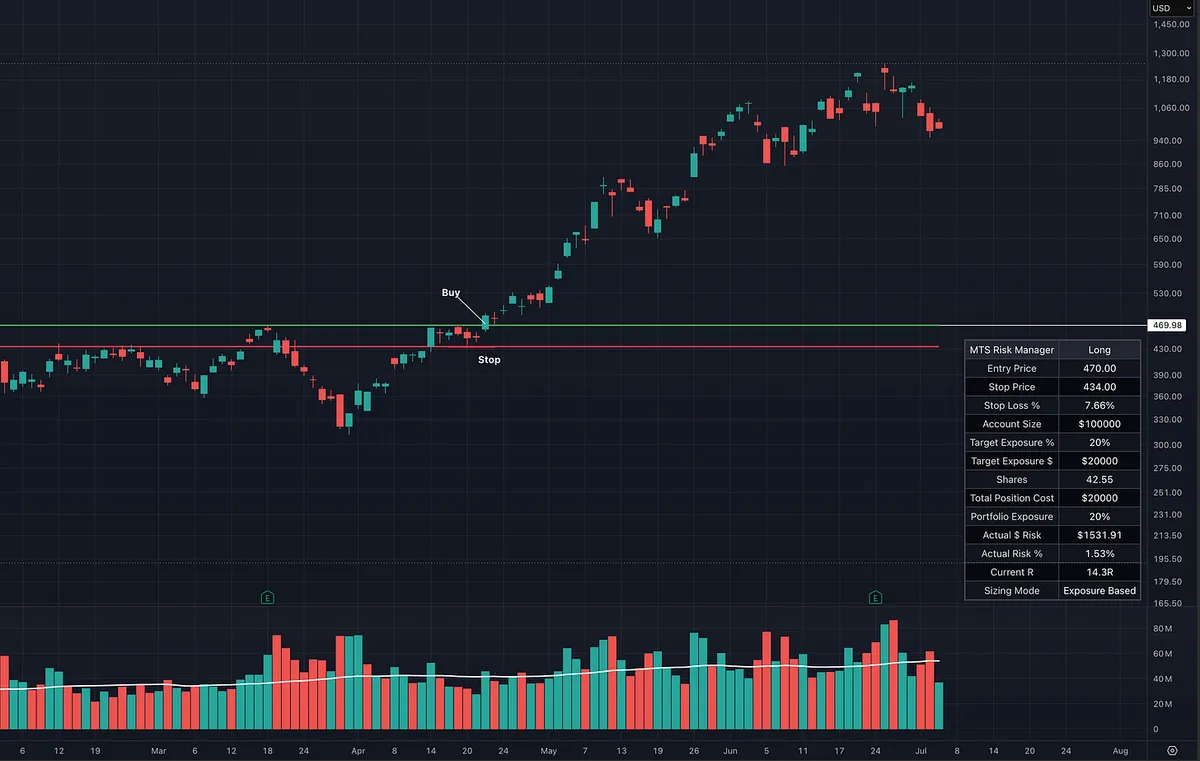
This is something Dr. Van Tharp really drives home throughout his work: stop thinking only in percentages and start thinking in terms of R, or the amount you are risking on the trade.
A lot of traders look only at the potential gain.
“How much can I make?”
But the better question is:
“How much am I risking to make it?”
Here is the breakdown:
Stock A: Risk 10% to make 30% = 3R
Stock B: Risk 8% to make 20% = 2.5R
Stock C: Risk 6% to make 24% = 4R
Stock D: Risk 3% to make 6% = 2R
Stock E: Risk 20% to make 50% = 2.5R
Even though Stock E had the biggest potential gain, Stock C offered the best return relative to the amount being risked.
That is the difference between chasing the biggest number and evaluating the quality of the trade.
William O’Neil, Mark Minervini, David Ryan, and Dan Zanger all built their approaches around buying correctly, defining risk, and keeping losses under control.
There is also another reason Stock C stands out.
Suppose your rule is to risk no more than 1% of your portfolio on any trade.
With a 20% stop, you can only take about a 5% position.
With a 10% stop, you can take about a 10% position.
With a 6% stop, you can take roughly a 16.7% position.
So a tight, logical stop does more than reduce the damage when you are wrong.
It allows you to take a more meaningful position while keeping total portfolio risk exactly the same.
That is why proper entries matter so much.
The goal is not simply to find the stock with the biggest possible upside.
The goal is to find the highest-quality setup with the best reward relative to the amount you must risk.
Amateurs focus on how much they can make.
Professionals focus on how much they can lose.
And they express that relationship in R.