
Trading articles/You Didn’t Miss the Move. You Stopped Working the Watchlist.
May 17, 2026 · Momentum Trading Strategy
You Didn’t Miss the Move. You Stopped Working the Watchlist.
MU shows why patient traders can still find elite leaders after the market turns, if they stay prepared, manage their watchlist, and avoid FOMO.
Originally published on Substack.
The Mistake Traders Make After a Market Turn
One of the biggest mistakes traders make after a market turn is assuming they missed the entire move if they did not buy the first signal. This is especially true after a sharp rally off the lows. Leadership starts moving, the indexes gap higher, and traders who stayed defensive begin telling themselves that everything worth owning is already extended.
To be fair, there is some truth to that concern. In most powerful market turns, the best leaders often move before the indexes. They show relative strength during the correction, start turning higher before the broader market confirms, and in many cases are already extended by the time the major averages give a clear signal to move back toward offense.
That is an important principle. It is also something we teach.
But it does not mean all opportunity is gone.
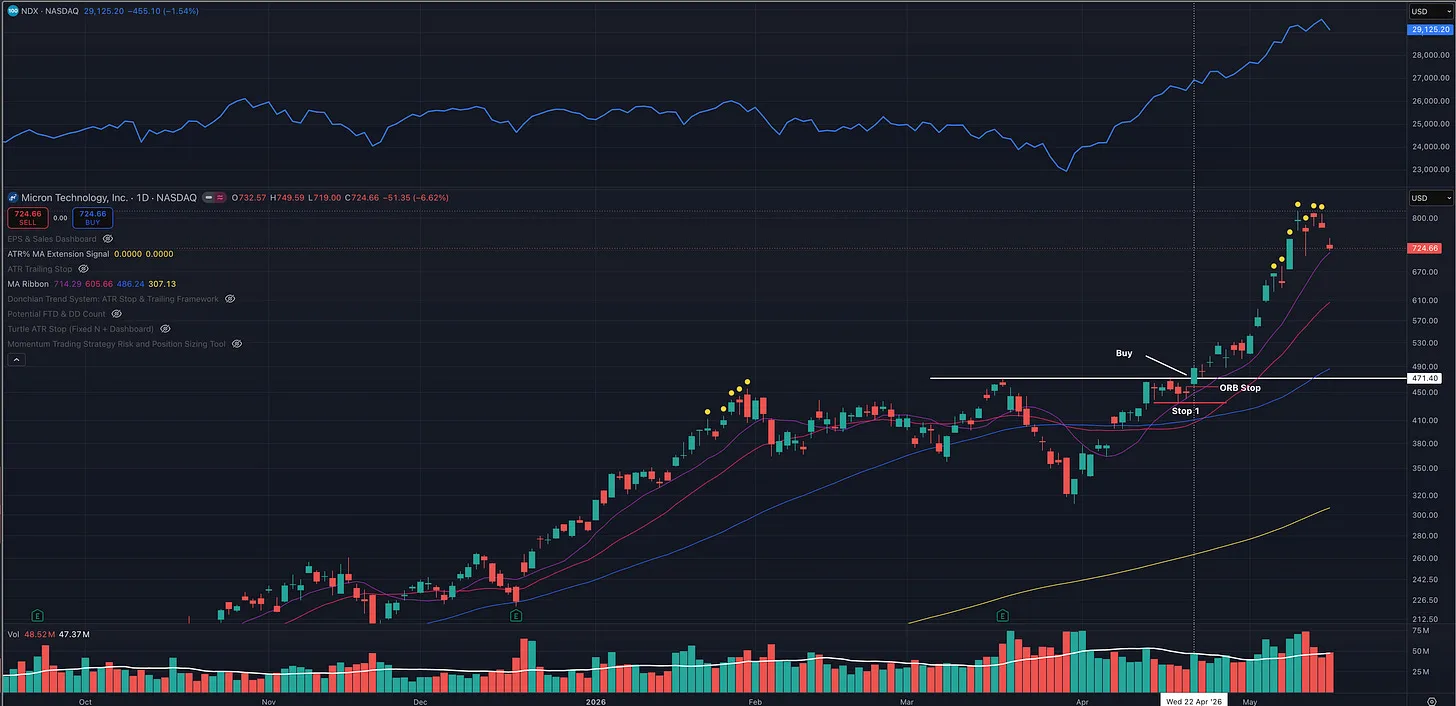
Micron Technology, Inc. (MU) is useful precisely because it was not the first stock to lead the market off the lows. The Nasdaq 100 had already delivered a major re-entry signal on April 8, gapping above key moving averages. By April 15, the index was already pushing back to all-time highs after a sharp rally from the bottom.
At that point, many traders were already saying the same thing traders always say after a strong move off the lows: “There is nothing left to buy. Everything is extended.”
MU showed why that conclusion can be wrong and why maintaining a prepared watchlist matters.
The stock did not break out to new highs until April 22, more than 10 days after the market’s re-entry signal and after the Nasdaq 100 had already made a significant move off the bottom. Yet MU was still setting up. It was still a leading stock. It still had a powerful fundamental profile. It was still in one of the strongest industry groups, and it still offered a defined, risk-controlled entry before making a major move higher.
That is the real lesson.
Even when the first wave of leaders has already moved, a prepared trader should not assume the opportunity is over. The job is to keep working the watchlist, keep studying the stocks that are setting up, and stay focused on the names that still combine all the CANSLIM and LEADERS characteristics we follow.
MU was not proof that every leader gives you unlimited chances. It was proof that patience does not have to mean missing the move. In a real Stage 2 uptrend, there are often still high-quality opportunities for traders who know what to look for.
MU Was Not a Random Trade
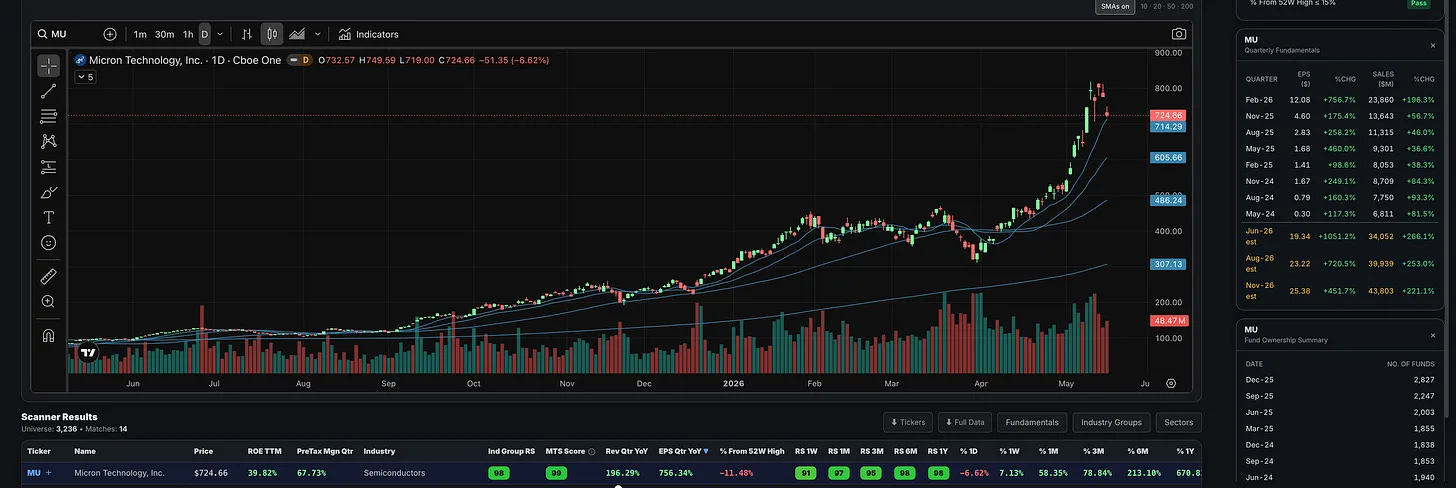
This was not a random trade. MU was not a hot tip, a late-stage chase, or a name discovered after the breakout. It had been a leadership candidate for months.
It was aligned with the dominant bull market theme: artificial intelligence. It belonged to semiconductors, one of the strongest industry groups of the entire advance. It also had the type of fundamental profile that attracts institutional sponsorship: revenue growth above 100%, earnings growth above 700%, pretax margins near 67%, return on equity close to 40%, strong and improving estimates, and a dramatic increase in fund ownership, with more than 1,000 new funds added over the prior year.
That combination matters. The objective is not simply to buy a stock because it is moving. The objective is to find the names where the technical action, fundamental acceleration, industry group strength, institutional sponsorship, and broader market backdrop are all pointing in the same direction.
The Market Backdrop: From Breakdown Risk to Re-Entry Signal
The Nasdaq 100 made an all-time high on October 29, 2025. After that, the market moved into a difficult period of sideways and corrective action. By March, the index had broken below the 200-day moving average and appeared to be entering what could have become a Stage 4 decline. For a brief period, we did.
The market then bottomed near the end of March and started to rally powerfully off the lows. There were five strong up days, but the index was still only back near the 20-day moving average. For very short-term traders, that may have been enough to begin testing exposure. For many traders, however, the market was still below the 200-day moving average. That remained a major caution signal.
Paul Tudor Jones has famously warned that nothing good happens below the 200-day moving average. Whether a trader uses that rule literally or as a broader risk-management principle, the takeaway is simple: when the market is below a major long-term trend, defense is the default. Staying defensive in that environment is not weakness. It is discipline.
April 8: When Defense Shifted Back to Offense
Then April 8 changed the picture.
Before the market opened, futures were already sharply higher. The Nasdaq 100 gapped above both the 200-day and 50-day moving averages in a single session. The index opened up almost 3% and closed higher by nearly 3.5% on the day.
That type of move changes the conversation. The market had shifted from defense back toward offense. That is why, on the morning of April 8, I was telling members that the market had given us a meaningful signal to start getting back involved. The weight of the evidence had changed, and when that happens, prepared traders need to be ready to act.
Prepared traders had an opportunity to begin buying that day. There were also additional opportunities on April 9 and April 10 before the market surged higher again on April 13, April 14, and April 15.
But many traders, including many experienced traders, likely missed that first window. By the time the indexes had advanced sharply, the common complaint became predictable: there was nothing left to buy.
That is where leadership lists matter.
The Key Point: MU Triggered More Than 10 Days Later
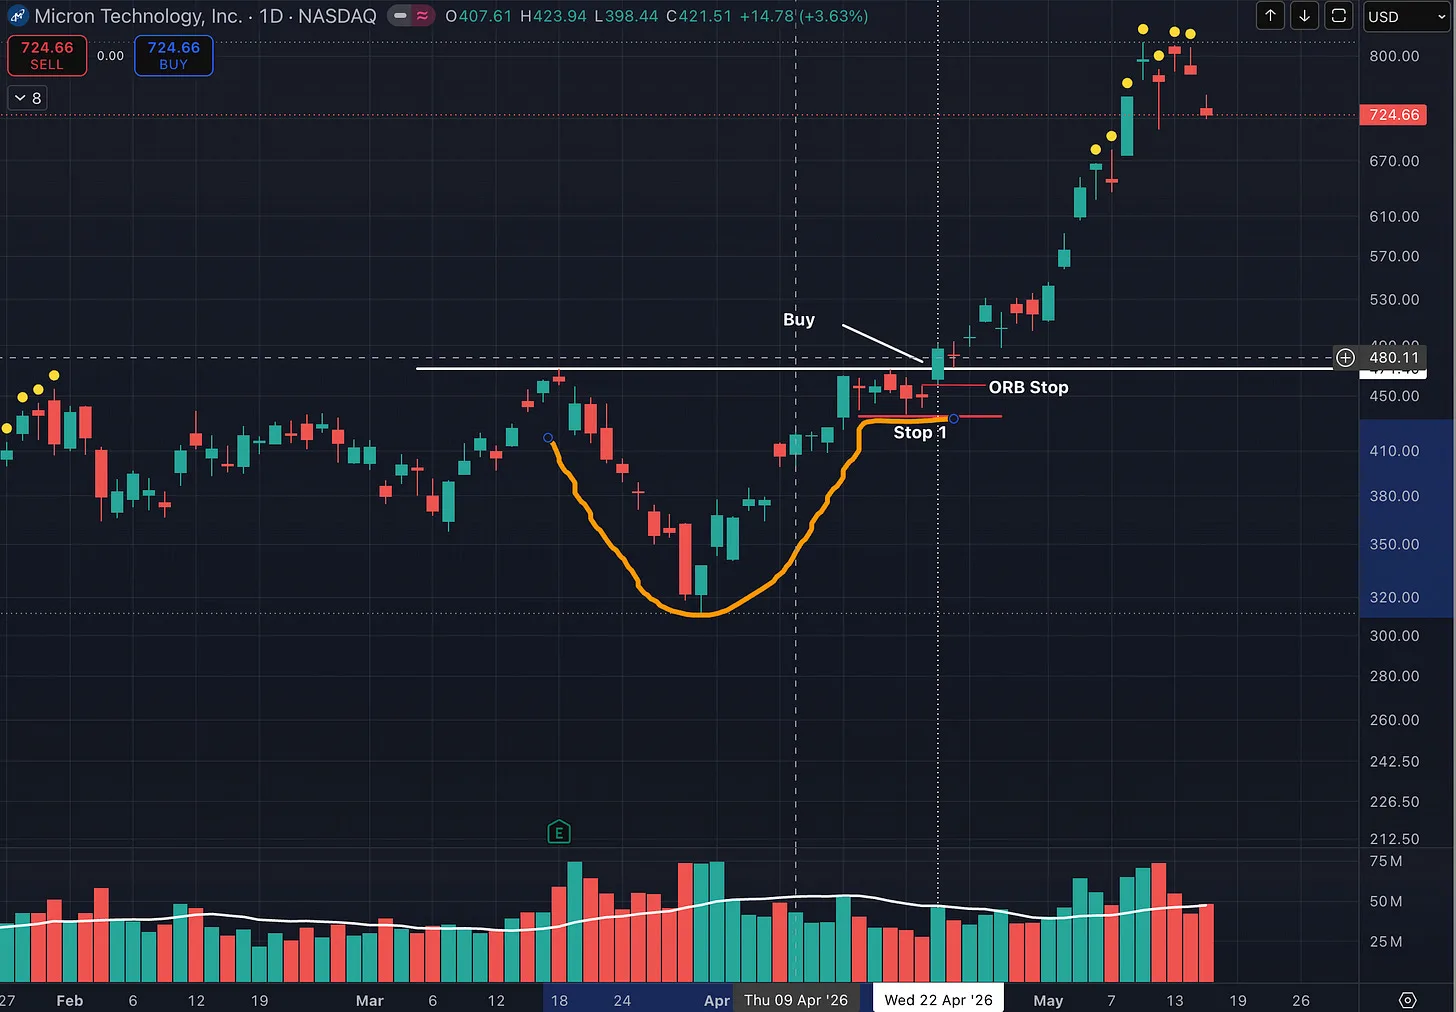
MU did not trigger until April 22, more than 10 days after the initial market signal.
That is the key point.
Even after the Nasdaq 100 had reclaimed the 200-day and 50-day moving averages, and even after the first burst higher, MU still gave traders a defined low risk, high reward technical entry.
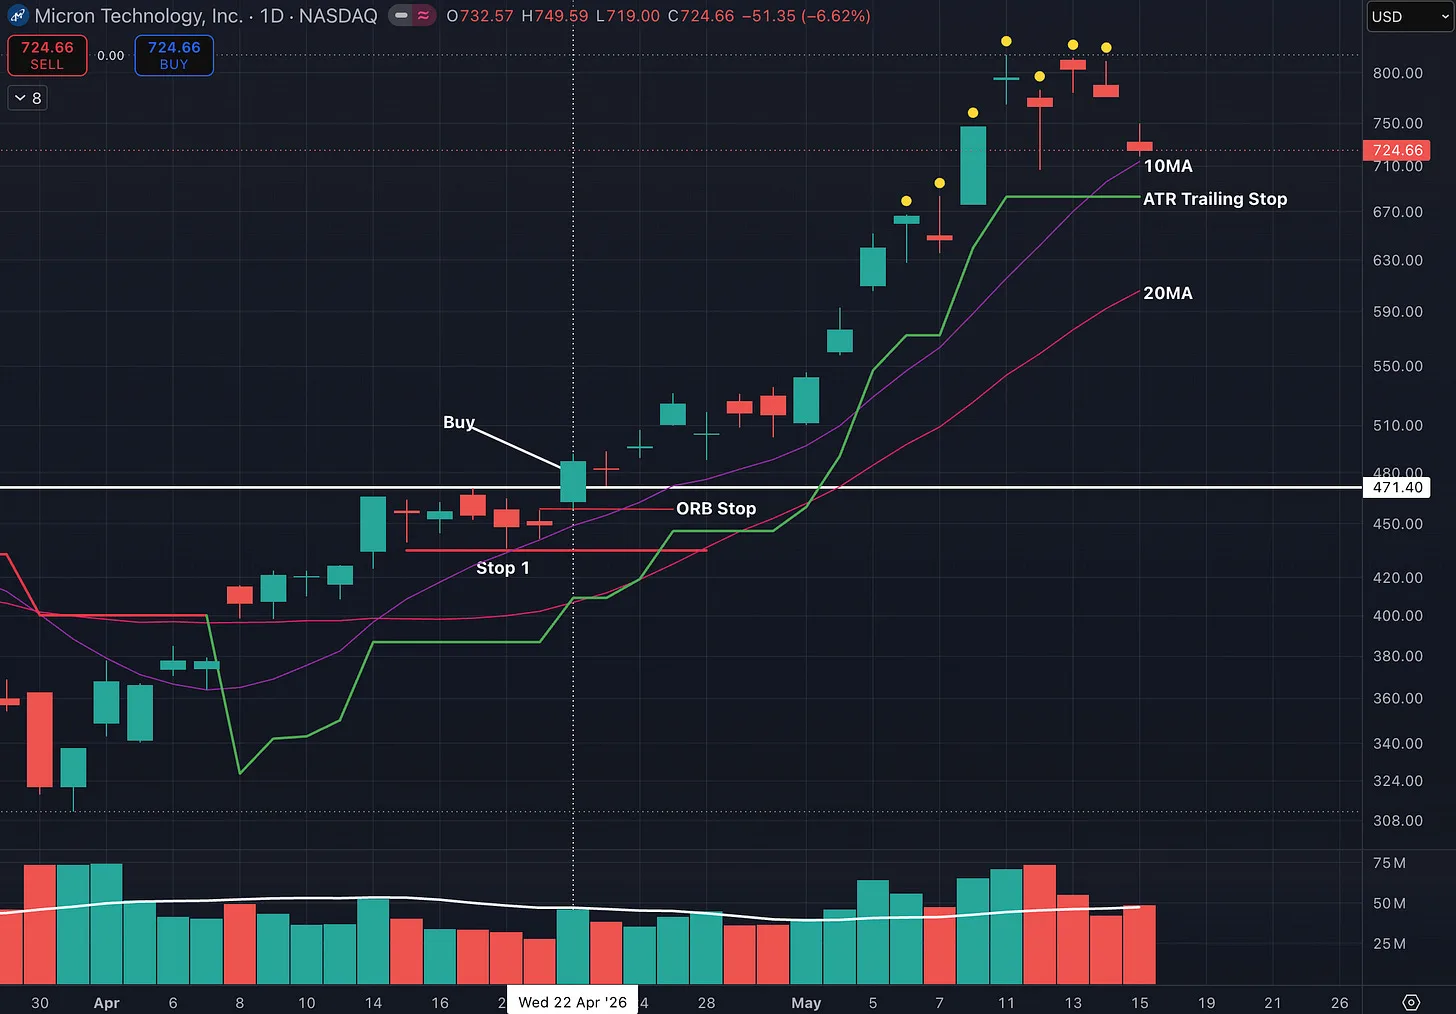
The stock had formed a cup-with-handle pattern. The bottom of the cup was admittedly V-shaped, but after the recovery, MU tightened up and moved sideways for approximately five or six sessions before breaking out to all-time highs. That handle provided a clear reference point.
The breakout area was approximately $471.75.
Entry Method One: The Standard Daily Chart Breakout
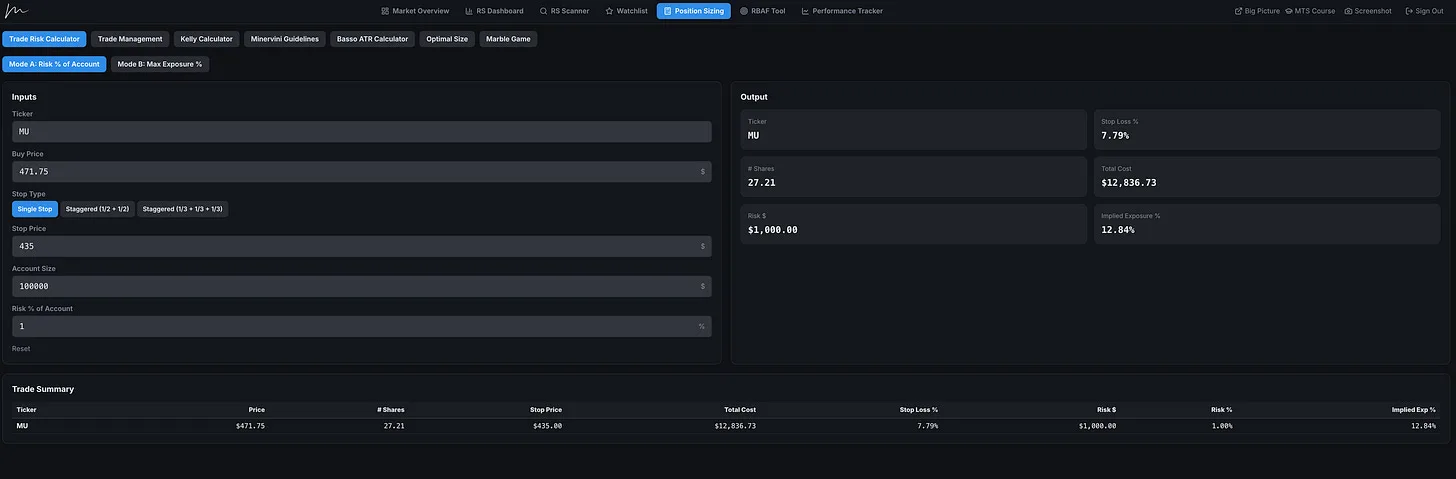
Using a standard daily chart approach, a trader could have purchased the breakout near $471.75 with a stop near $435. That created a risk of roughly 7.79%.
This fits within the classic William O’Neil risk framework and remains below the 8% stop and 10% maximum loss area often emphasized by Mark Minervini. It was not a loose, undisciplined trade. It was a defined breakout with a defined technical stop.
That daily chart method was one valid way to trade MU. Buy the breakout through new highs, place the stop below the logical technical level (right under the higher low and handle), size the position so the total account risk remains controlled, and then allow the trade to work.
In this case, price never came close to the stop. It did come back near the entry area, which is an important reminder that stops should not be raised too quickly. Strong stocks often retest or shake near the breakout area before continuing higher. If a trader moves the stop to breakeven too soon, the trade can be stopped out before it ever has the opportunity to develop.
Entry Method Two: Opening Range Breakout Precision
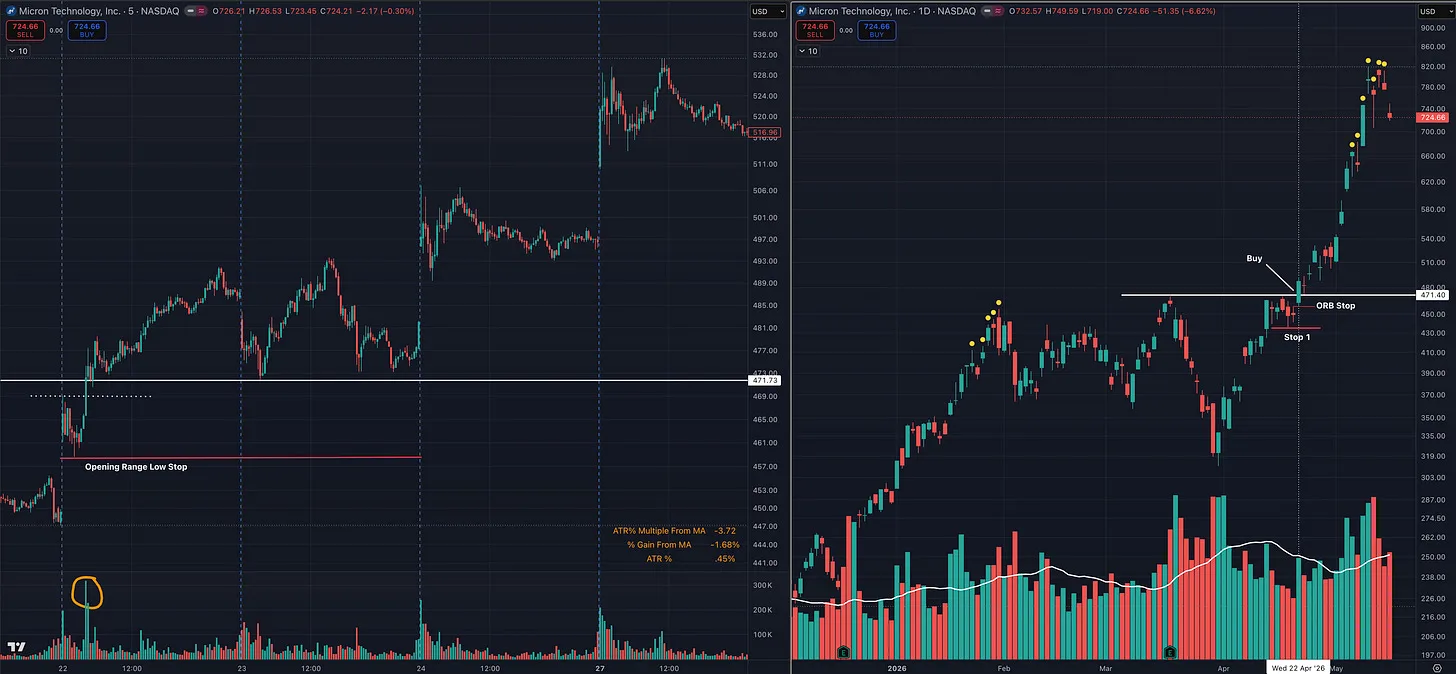
There was also a second way to enter the trade with more precision: the opening range breakout (ORB).
This is a method Dan Zanger has used for decades, and Kristjan Kullamägi has helped popularize recently through his own trading examples. The concept is straightforward. Instead of using only the daily chart, the trader uses the opening range on an intraday chart to define a more precise entry and risk level.
On the MU breakout day, the 5-minute opening range breakout level was near $469.10. A trader could have purchased through that level or waited for the higher time frame breakout through approximately $471.75.
To keep the example conservative, assume the purchase occurred at $471.75 (higher timeframe breakout on daily chart).
From there, the trade could be structured with staggered stops. The first stop would sell 50% of the position if price broke the opening range low near $458.50. The second stop would sell the remaining 50% if price broke the daily chart stop near $435 (low of the handle).
Why Staggered Stops Changed the Math
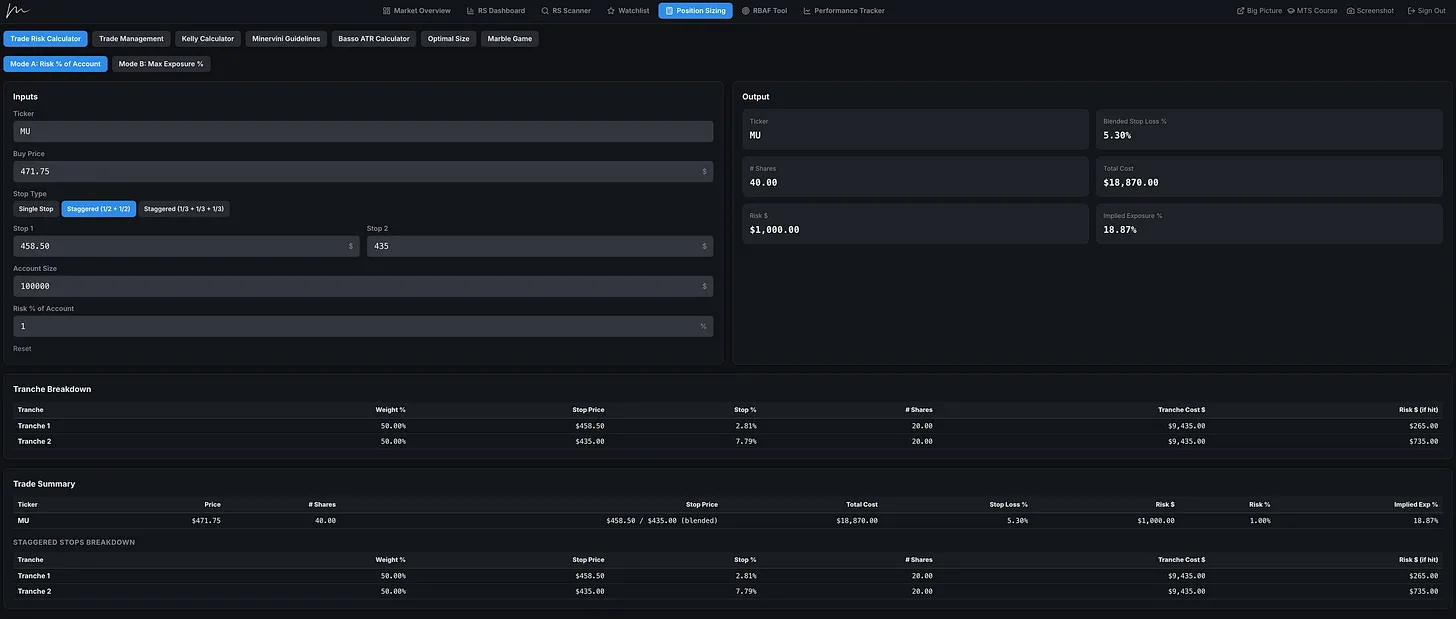
This adjustment materially changed the trade math.
A single daily chart stop near $435 created a risk of approximately 7.79%. The staggered-stop method reduced the blended stop loss to approximately 5.30%.
On a $100,000 account risking 1%, the single-stop method allowed for roughly 27 shares and approximately 12.84% exposure. The staggered-stop method allowed for approximately 40 shares and roughly 18.87% exposure while still risking only 1% of the account.
That is the value of precision.
The trader is not taking more account risk. The trader is using a more refined stop structure to improve the position size, exposure, and reward-to-risk profile.
Both methods worked. The standard O’Neil-style daily breakout worked. The opening range breakout with staggered stops worked. The reason both worked is because the trade was built on the right stock in the right environment.
Intraday tactics are useful, but they are not a substitute for leadership. The opening range breakout is powerful when it is applied to an elite stock emerging from a proper base in a confirmed market uptrend. It is much less useful when applied randomly to weak stocks, laggards, or names outside of institutional leadership.
Managing the Winner: Selling Strength Without Killing the Trade
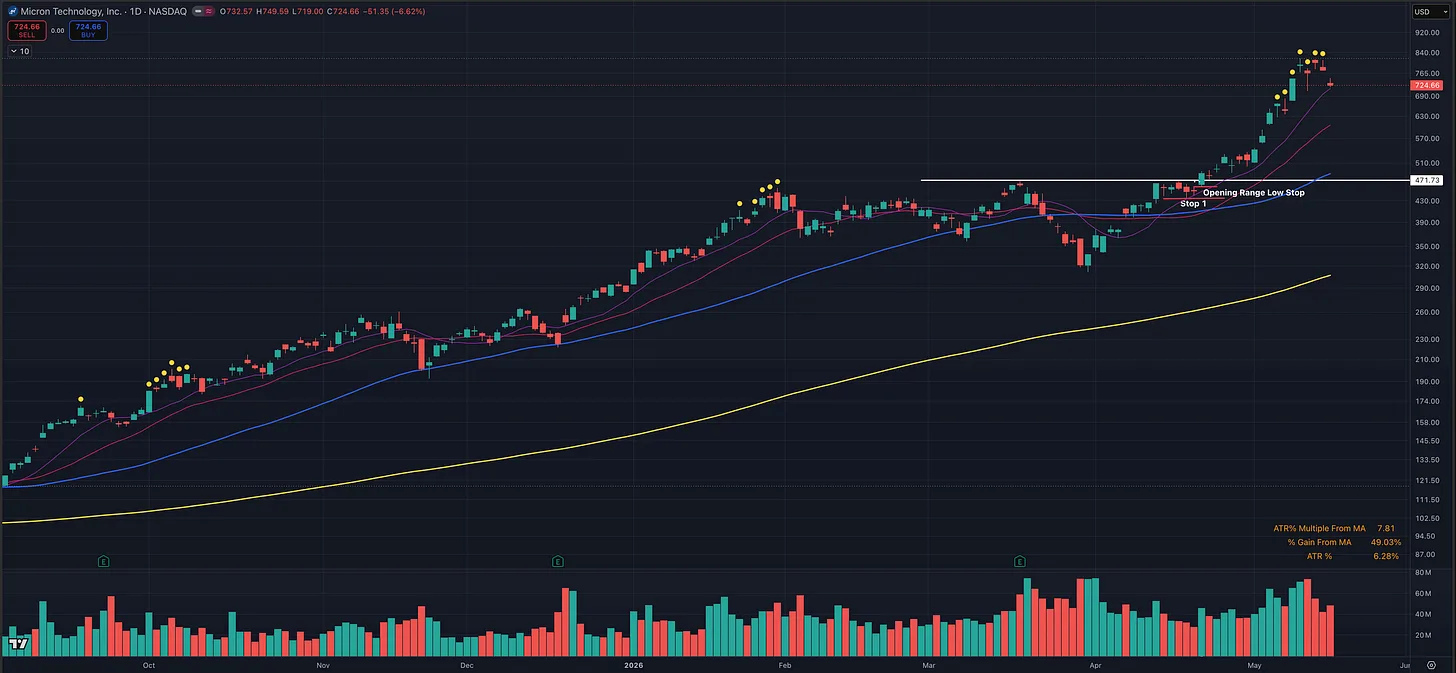
Once MU broke out, the stock moved aggressively higher. By May 6, it triggered its first ATR percentage extension signal from the 50-day moving average.
That did not mean the stock had to be sold completely. It did, however, signal that MU had moved a long distance in a short period of time. For a trader sitting on a large open profit, this is where trade management becomes more important than the original entry.
A trader could have used that extension signal as a reason to sell some into strength. Another trader could have waited for a break of the prior day’s low, a short-term reversal signal, or another objective weakness trigger.
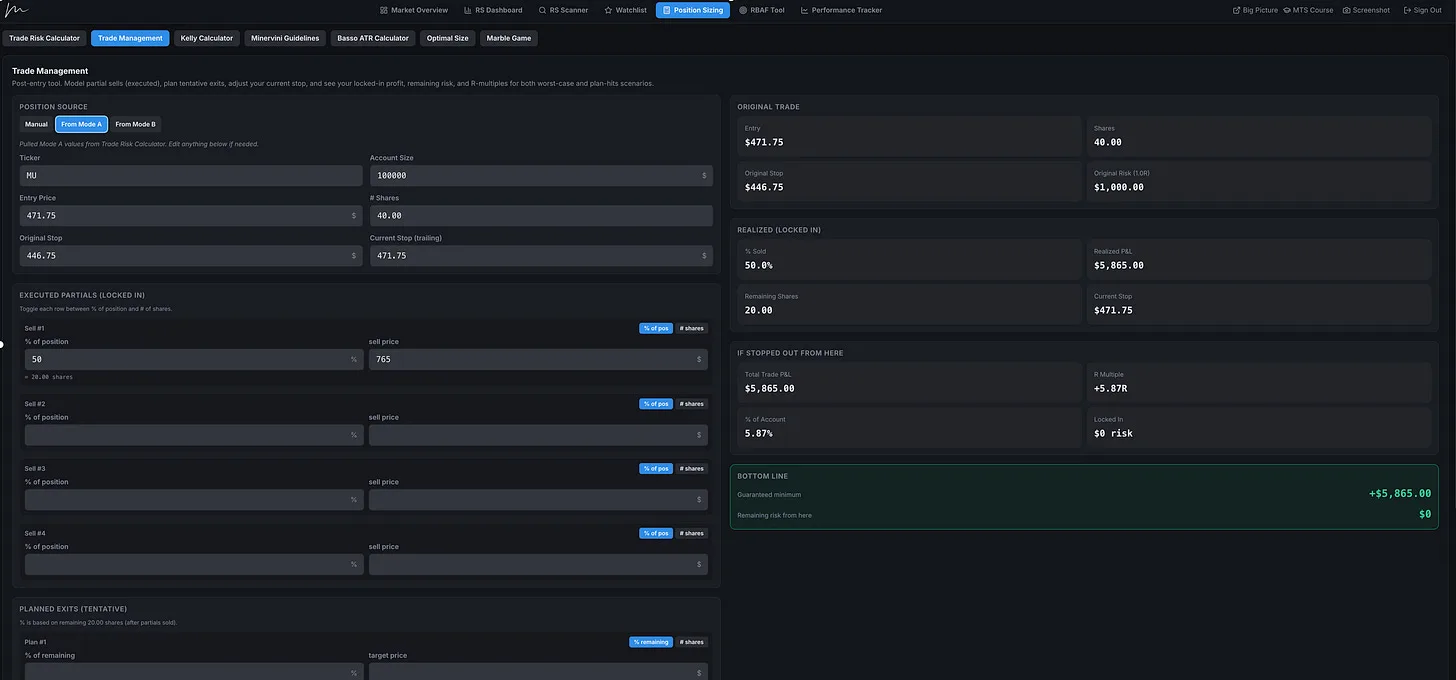
For this example, assume a 50% partial sale around $765 on May 12.
If the trader sold 50% near $765 and then moved the remaining stop to breakeven at $471.75, the trade had already locked in a significant gain. Using the opening range breakout method with staggered stops, that partial sale secured approximately 5.87R. Using the standard daily chart breakout entry, it secured approximately 4R.
That means even if the remaining half of the position came all the way back to the original entry price and stopped out at breakeven, the overall trade would still finish as a major winner with no remaining downside risk.
That is an excellent position to be in.
The Purpose of Selling Into Strength
This is the practical purpose of selling into strength.
It is not about predicting the top. It is not about abandoning a winner. It is about financing the risk of the remaining position.
Once part of the gain is realized and the stop is moved to breakeven, the trader has removed the possibility of turning the entire trade into a loss while still preserving upside exposure.
From that point, there are several reasonable ways to manage the remaining position. A trader could trail the stop with an ATR-based method. A trader could use the 10-day moving average for a tighter approach. A trader could give the stock room to the 20-day or 50-day moving average in an attempt to capture a larger move.
There is no single perfect answer. What matters is that the decision is made through a defined process rather than emotion.
Where MU Stood After the Pullback
As of Friday, May 15, MU had pulled back for three consecutive sessions and was moving back toward the 10-day moving average. But the stock remained above its 10-day, 20-day, 50-day, and 200-day moving averages, with those moving averages properly layered and trending higher.
Even after the pullback, MU was still more than 50% above the breakout buy area.
That is the position a trader wants to be in after a successful breakout: sitting with a nice profit cushion, with the stock still acting constructively, and with multiple options for managing the rest of the trade.
The Bigger Lesson
The biggest lesson from this trade is not just that MU worked. It is that patience and preparation still matter after the market turns.
Many traders miss the first opportunity after a major market signal and immediately feel behind. That feeling often leads to FOMO. Instead of waiting for the next proper setup, they chase extended stocks, force trades, or buy names that do not offer a favorable risk/reward profile.
That is usually where the damage happens.
The better approach is to stay focused on the watchlist. Keep updating it. Keep studying the stocks that are setting up. Do not lose sight of major leadership candidates simply because they were not the first names to break out off the lows.
MU had the proper characteristics of a leading stock. It had the theme, the group, the relative strength, the earnings and sales growth, the margins, the fund ownership, and the technical setup. It should NOT have disappeared from the radar simply because other leaders moved first.
For traders who missed the initial market re-entry signal, MU provided a defined opportunity to get involved later. For traders who were already positioned, it offered another potential way to add exposure after the first wave of leaders had already moved.
That is how a real process works.
We are constantly cutting losers and letting winners run. As weaker trades fail or get stopped out, capital becomes available for stronger opportunities. The goal is not to force exposure immediately after the market turns. The goal is to stay prepared so that when a true leader sets up, you are ready to act.
Final Takeaway
The job is not to buy the exact bottom. The job is not to predict the news. The job is not to chase whatever is moving that day.
The job is to know what leadership looks like, maintain a prepared watchlist, define the risk before entry, size the position correctly, and manage the trade as it develops.
MU is a clear example of why missing the first market signal does not always mean missing the opportunity.
One trade like this can make a month, a quarter, or even a year, but only if the trader avoids taking unnecessary damage along the way. That is why the process matters. Stay patient. Stay prepared. Avoid the euphoria. Let the market confirm, then focus on the leaders that are still offering proper risk/reward setups.
Remember: You can still make a killing if you stay patient and avoid doing something stupid.
More in Trading Psychology
All Trading Psychology articles →
Oct 27, 2026 · Trading Psychology
The Hidden Beliefs Sabotaging Your Trading
Why knowing the rules isn’t enough. Lessons from Van Tharp and Ed Seykota on trading psychology, self-sabotage, and changing the beliefs that hold you back.
- trading psychology
- Investing
- Trading
- Momentum Trading Strategy
- Market Wizards

Sep 1, 2026 · Trading Psychology
The Market Isn’t Your Biggest Opponent. You Are.
Why the greatest traders eventually discover that trading psychology, discipline, and self-mastery matter more than another setup, indicator, or strategy
- growth stocks
- Momentum Trading
- Learn Trading
- trading psychology
- Investing
- ed seykota
- position trading
- Peter Brandt

Aug 26, 2026 · Trading Psychology
Most Traders Fail. But That Statistic Doesn’t Tell the Whole Story
Why the failure rate in trading may say more about preparation, persistence, and process than your actual odds of success
- Momentum Trading
- Learn Trading
- CANSLIM
- Growth Stock Trading
- trading stocks
- growth stock investing