
Trading articles/When Good News Gets Sold, The Market Is Sending a Warning
Nov 21, 2025 · Momentum Trading Strategy
When Good News Gets Sold, The Market Is Sending a Warning
The strongest signal in market behavior is not the news itself, but how price reacts to the news.
Originally published on Substack.
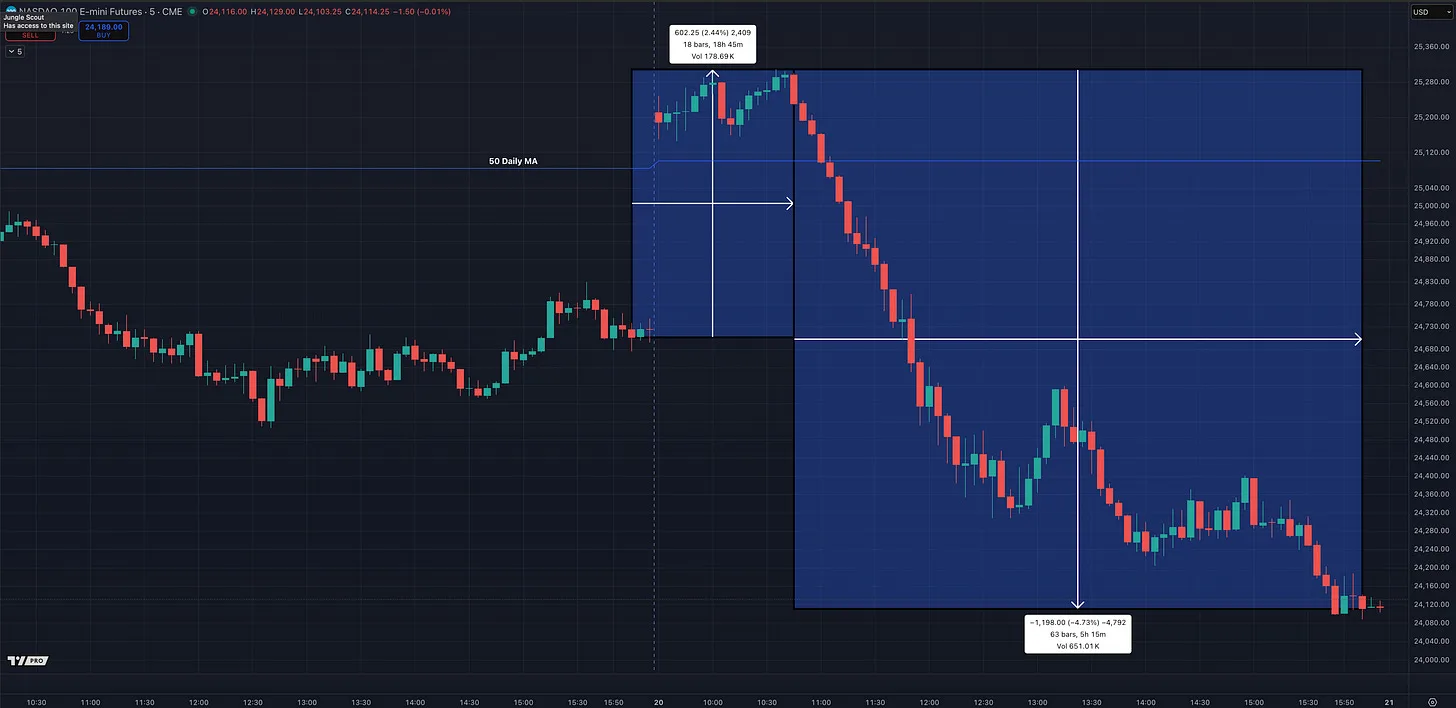
Did you see the market’s warning today?
If you caught it, you are already ahead of most traders. If you missed it, this is the type of signal that separates professionals from everyone else.
Most traders watch headlines. The best traders watch how the market reacts to those headlines.
If you understand that difference, you already have an edge.
Today gave you a perfect example of why.
A Monster Gap Up That Completely Failed
NVDA delivered a huge earnings beat. Earnings were up 60 percent from the same quarter last year and sales were up 62 percent. The Nasdaq opened with a large gap and pushed hard, running about 2.44 percent by 10:30 AM. A healthy market usually builds on this. Strong news should produce a strong reaction and follow-through.
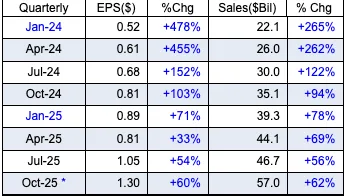
*IBD calculates these growth rates by comparing each quarter to the same quarter one year earlier.
That is not what happened.
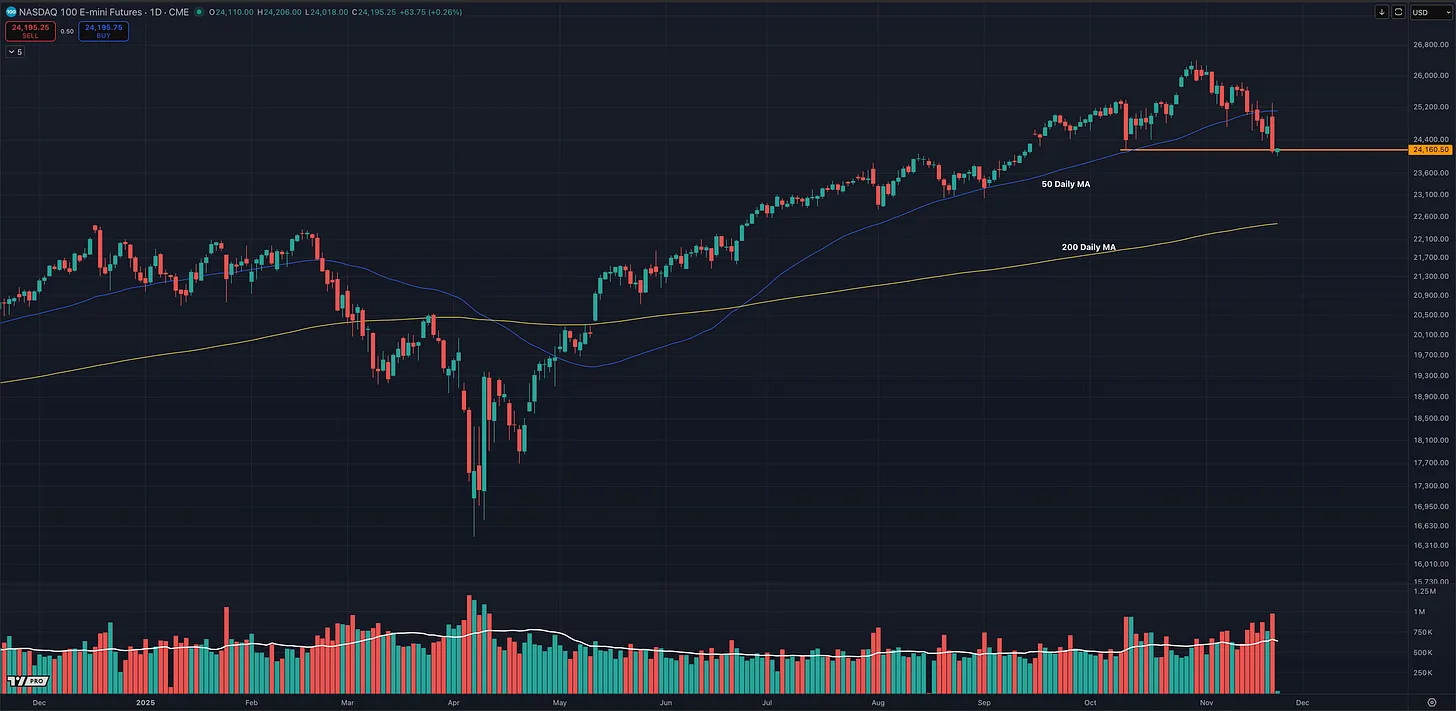
Instead of pushing higher, the entire move was erased. The gap was filled. Momentum stalled almost instantly. Every bounce was sold. By the end of the session, the Nasdaq broke below the October 10 swing low and printed a lower low on the daily chart, finishing the day down about 2.4 percent after being up 2.4 percent earlier in the morning.
The last time the chart looked this heavy was back in February during the tariff scare.
Days like this are never random. They are signals.
The Most Important Pattern in Market Character
In a healthy market:
- Good news pushes price higher
- Bad news barely dents the trend because institutions buy weakness
- Trend follows through even on questionable headlines
In a weak or topping market:
- Good news gets sold
- Bad news hits harder
- Very bad news can create a capitulation low
Price action always reveals market character before headlines do.
A market that fades a strong earnings gap is a market that is tired. Institutions are shedding risk, not adding to it. They use good news as exit liquidity.
That is exactly what happened today.
Institutional Behavior Was Obvious in the Tape
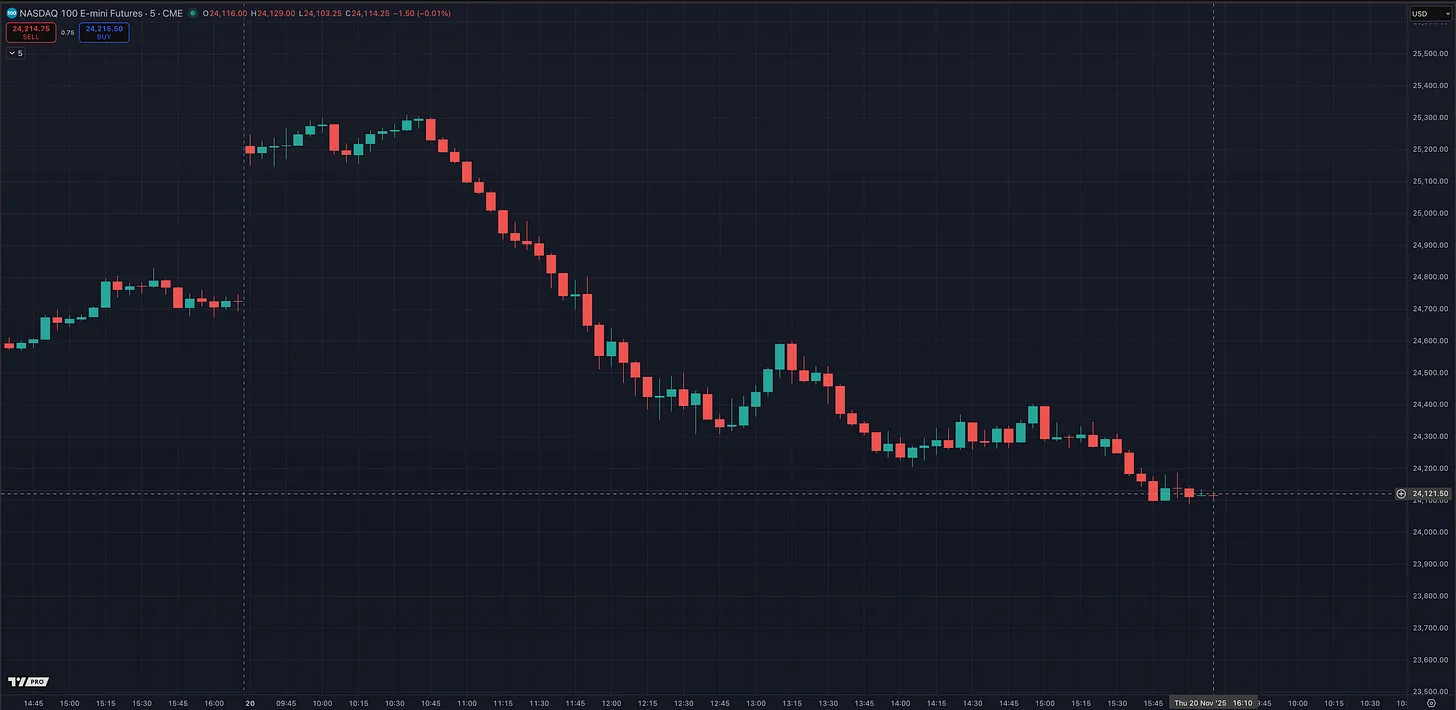
You could see institutional behavior clearly on the intraday chart. The selling was steady, controlled, and persistent. There were no violent spikes or messy swings that normally show up during retail panic. Instead, the market moved lower in a clean stair-step pattern. Every bounce was sold almost immediately and buyers could not sustain momentum at any point.
This is systematic selling. The trend stayed intact for hours and volume remained elevated throughout the entire session. That only happens when large funds are distributing positions. Retail traders do not have the size or consistency to create this kind of pressure.
When big money sells into strength, the tape turns heavy and trend becomes one-directional. When big money buys into weakness, the opposite happens and the tape becomes supportive. Markets can move sideways when buyers and sellers are balanced, but today was not one of those days. The tape was one-sided and showed clear distribution.
Why This Matters More Than the News
Most traders read headlines and then guess what the market should do.
Professionals watch the market and let the reaction guide them.
Good news being bought is strength.
Good news being sold is weakness.
Bad news creating a sharp drop is normal in a topping phase.
Terrible news that no longer pushes price lower often signals the beginning of a bottom.
History has shown this over and over:
- Dot-com bubble
- Financial crisis
- Covid crash
- 2022 bear
- The February tariff scare
The news is not the signal. The reaction to the news is the signal.
Today’s reaction was a warning.
What Today Is Telling Us
The Nasdaq did not behave like a healthy market.
- The huge gap up was erased
- A lower low formed on the daily chart
- Strong NVDA earnings were sold instead of bought
- Buyers were exhausted almost immediately
- Distribution showed up on multiple timeframes
On top of this, the net new highs and lows have been trending deeper into negative territory. You can see a clear shift where more stocks are making new lows than new highs, which is a classic sign of market deterioration under the surface. Even while the indexes looked stable, breadth has been weakening for weeks.
We also broke down through the 50 day moving average, which removes a key area of support that funds often use to judge trend strength. When price loses the 50 day and breadth is already deteriorating, it signals that the internal structure of the market is weakening faster than most traders realize.
Markets do not fall apart for no reason. They fall apart when demand fades and institutions quietly move out of positions. Days like today reveal that process clearly.
Price always signals first.
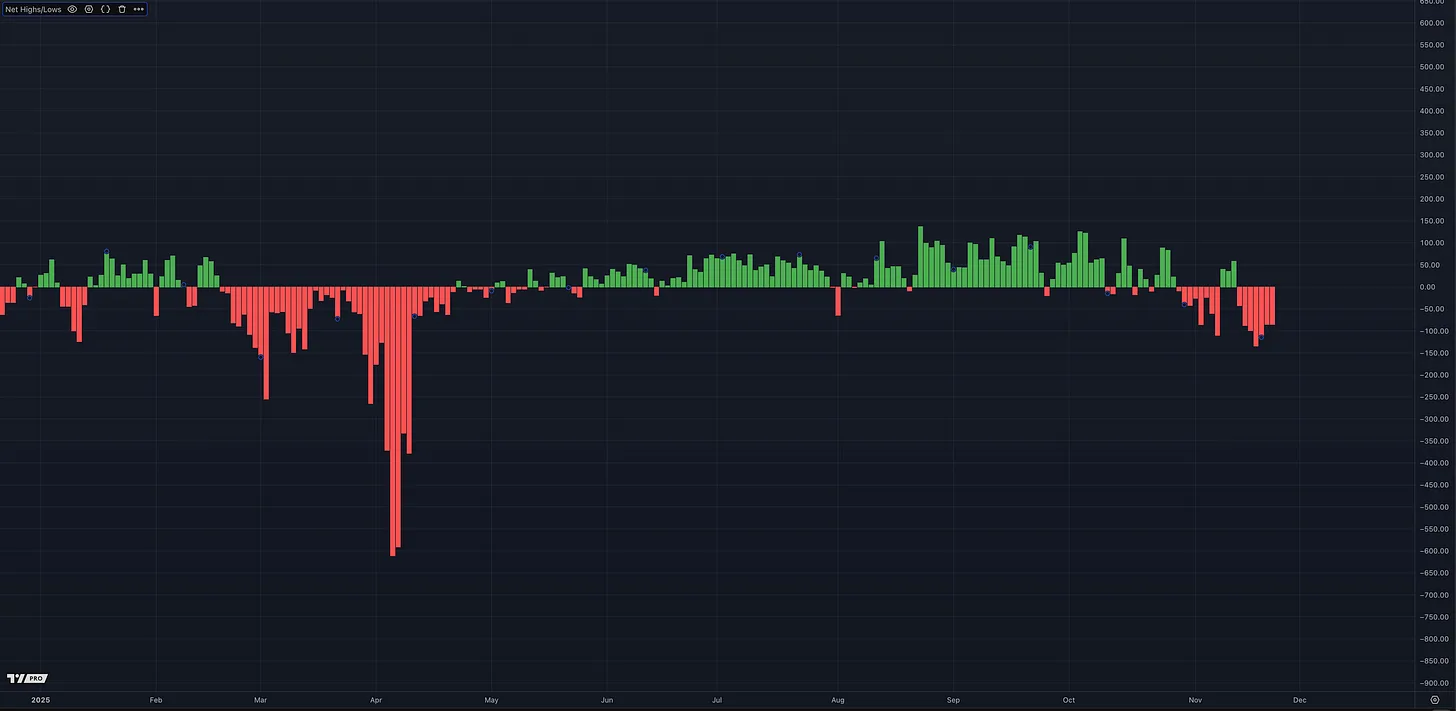
*Net new highs and lows have been trending deeper into negative territory, showing that more stocks are breaking down than breaking out. This is classic internal weakening beneath the surface of the indexes.
Final Thoughts
This is not the time to increase exposure or buy dips. When the tape looks like this, most momentum traders sit in cash and wait patiently for the next clean opportunity. Cash is a position and it protects both capital and confidence during periods of distribution.
If you want to stay ahead in this environment, stop watching the headlines and start watching how price behaves after the headlines hit. The reaction tells you everything you need to know.
Today told you that big players used the NVDA strength to unload. That is not something you ignore. Strength that evaporates on good news is not real strength. It is distribution.
The market just revealed its character. Your job is to respect it.
More in Strategy & Tactics
All Strategy & Tactics articles →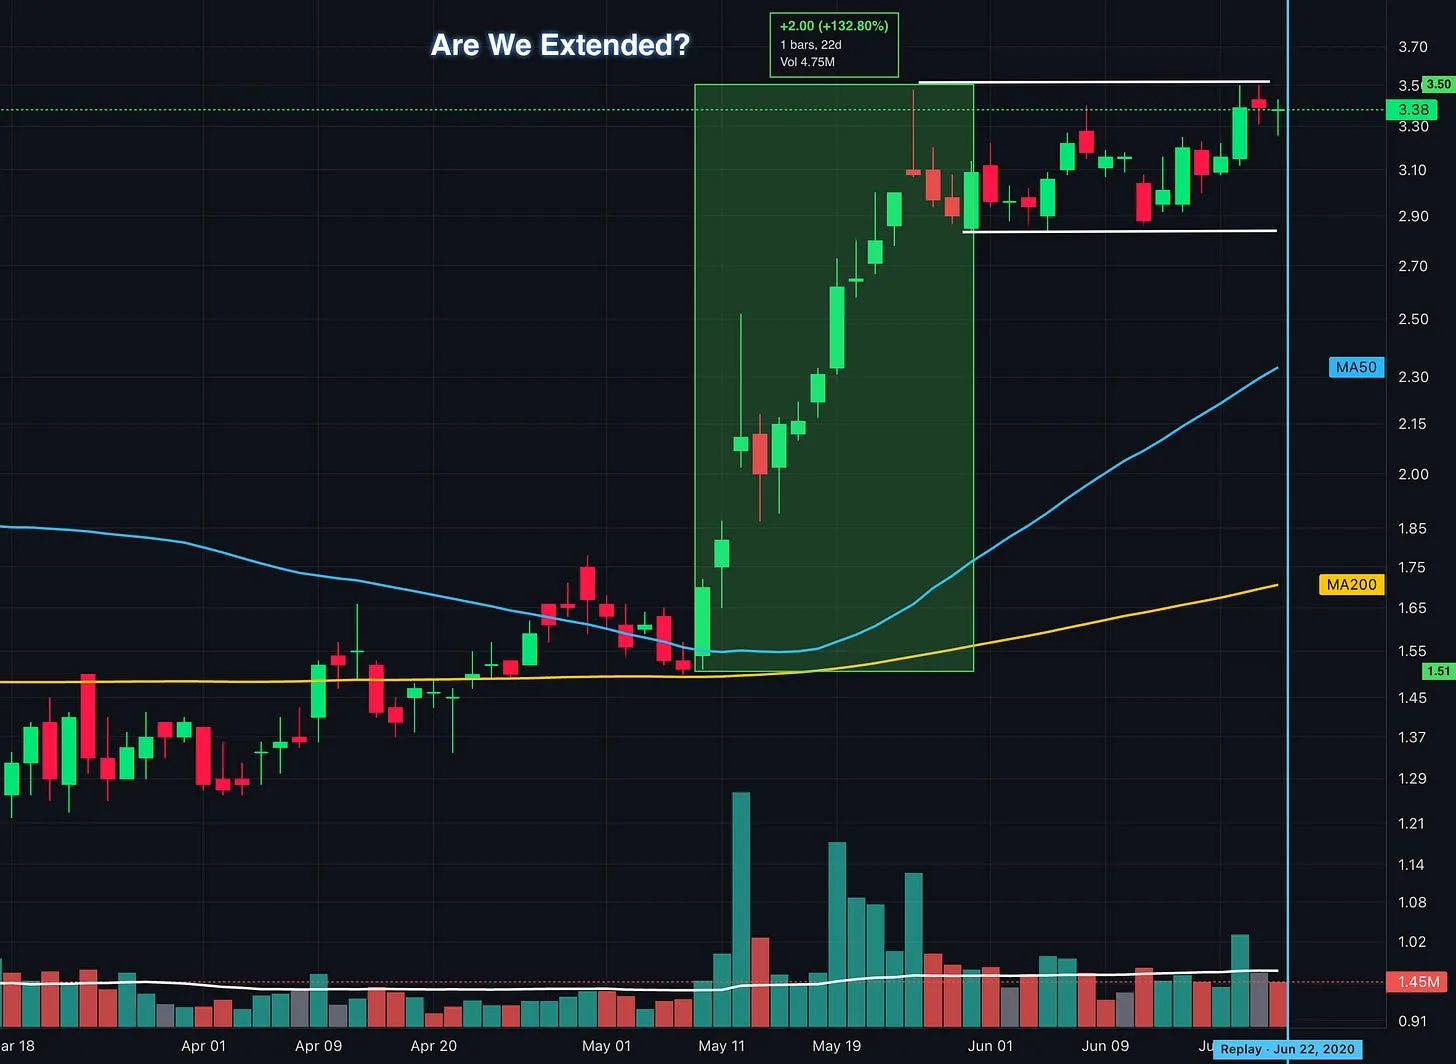
Oct 8, 2026 · Strategy & Tactics
Up 100% and Still Buyable? What Traders Get Wrong About Extended Stocks
How to identify proper buy points, avoid chasing stock breakouts, and manage entry risk using lessons from William O’Neil, Mark Minervini, David Ryan, and Dan Zanger.
- Momentum Trading
- VCP
- position trading
- Growth Stock Trading
- David Ryan
- Flag Pattern
- chart patterns
- Cup and Handle
Sep 27, 2026 · Strategy & Tactics
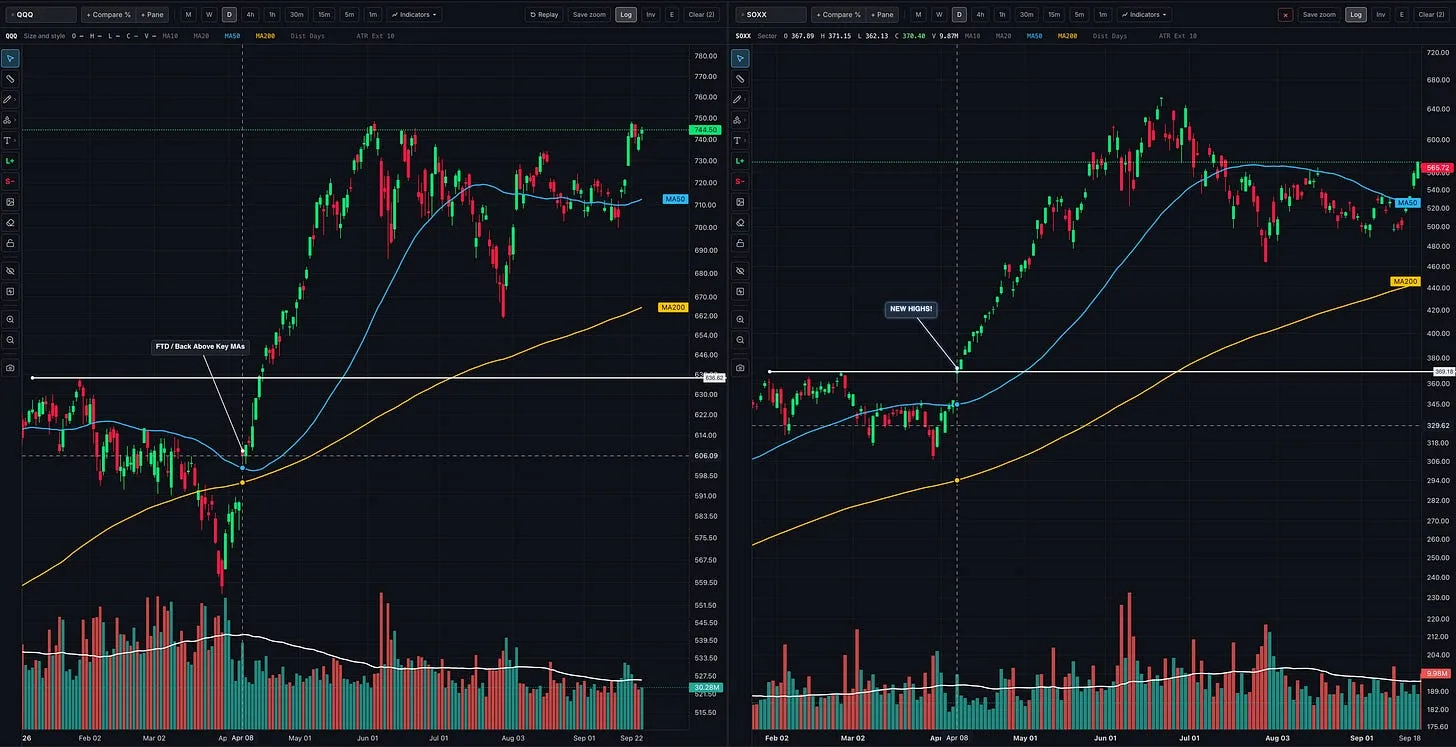
Should You Follow Leading Stocks or Wait for Market Confirmation?
How to read the market, industry groups, and individual stocks together so you can recognize opportunities, build exposure, and respond when conditions change
- growth stocks
- CANSLIM
- Trading
- position trading
- Stan Weinstein
- William O'Neil
- Momentum Trading Strategy
- Trade stocks
Sep 25, 2026 · Strategy & Tactics
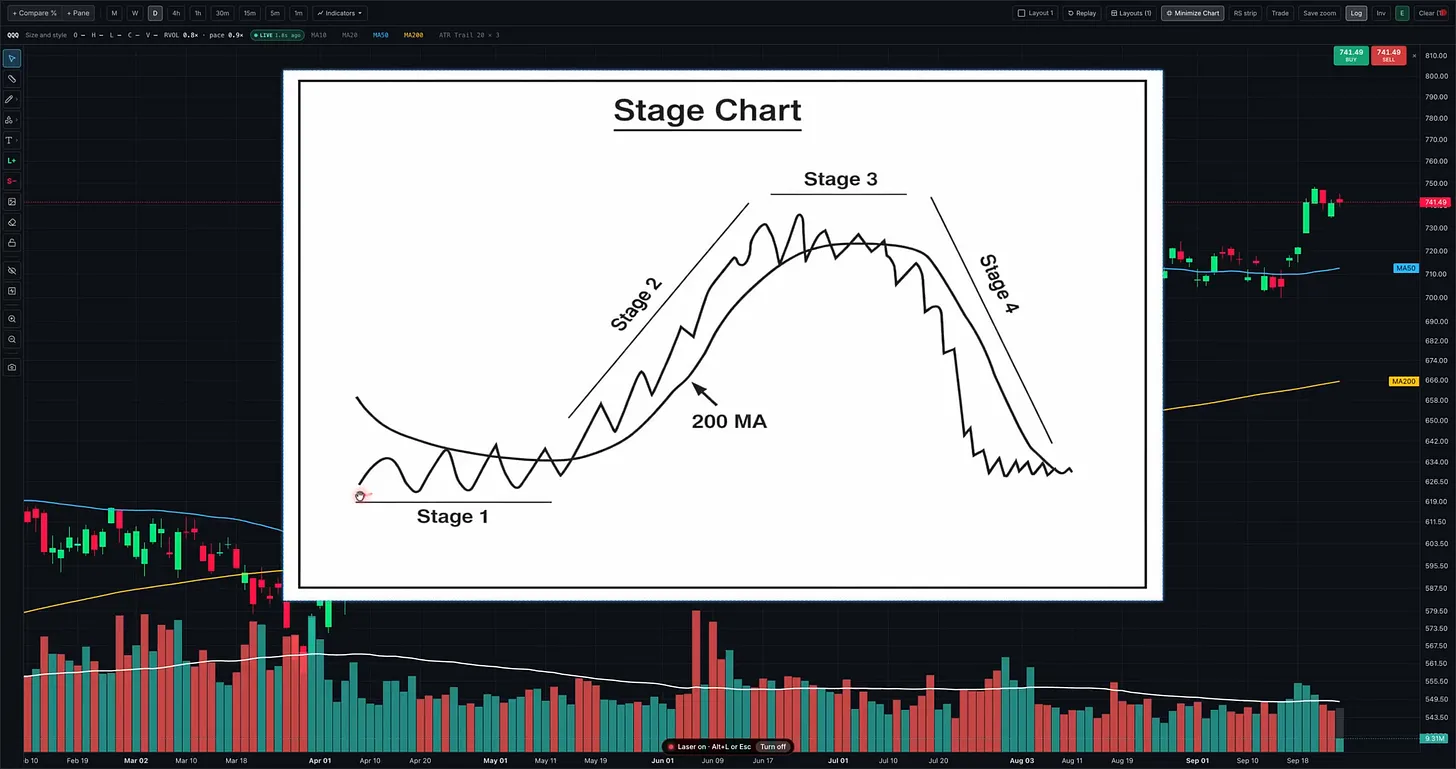
Stage Analysis: How to Spot Stage 3 in Real Time
Recognize a developing Stage 3 using Stan Weinstein’s framework, with real chart examples, warning signs, and lessons for protecting your gains
- Momentum Trading
- Nasdaq
- technical analysis
- CANSLIM
- position trading
- Stan Weinstein
- QQQ
- Find True Market Leaders