
Trading articles/The Exact TradingView Chart Setup I Use
Jul 11, 2026 · Momentum Trading Strategy
The Exact TradingView Chart Setup I Use
A beginner asked me how I set up my charts. The answer is probably not what you expect.
Originally published on Substack.
A beginner trader recently asked me a simple question:
How should I set up my chart on TradingView?
It is a good question because TradingView gives you access to thousands of indicators. RSI, MACD, stochastics, Bollinger Bands, momentum oscillators, trend indicators, volume indicators, and countless custom scripts are all available with a few clicks.
That accessibility can create a problem.
Many beginner traders keep adding indicators because they believe the next one might finally tell them exactly when to buy and sell. Before long, the chart is covered with so many lines, colors, signals, and dashboards that the trader can barely see the price.
In the video above, I begin by showing a chart loaded with indicators.
That is not how I trade.
My actual chart setup is much simpler.
Start With Price and Volume
The foundation of my chart is price.
I want to see whether a stock is making higher highs and higher lows, whether the price action is tightening, whether the stock is finding support, and whether buyers or sellers appear to be in control.
Volume helps confirm what is happening beneath the price action.
When a stock begins tightening while volume steadily declines, it can indicate that the available supply of shares is drying up. If the stock then breaks through resistance on a meaningful increase in volume, that can signal that demand is entering the stock.
You do not need an oscillator to see that.
You need to understand the relationship between price, volume, supply, and demand.
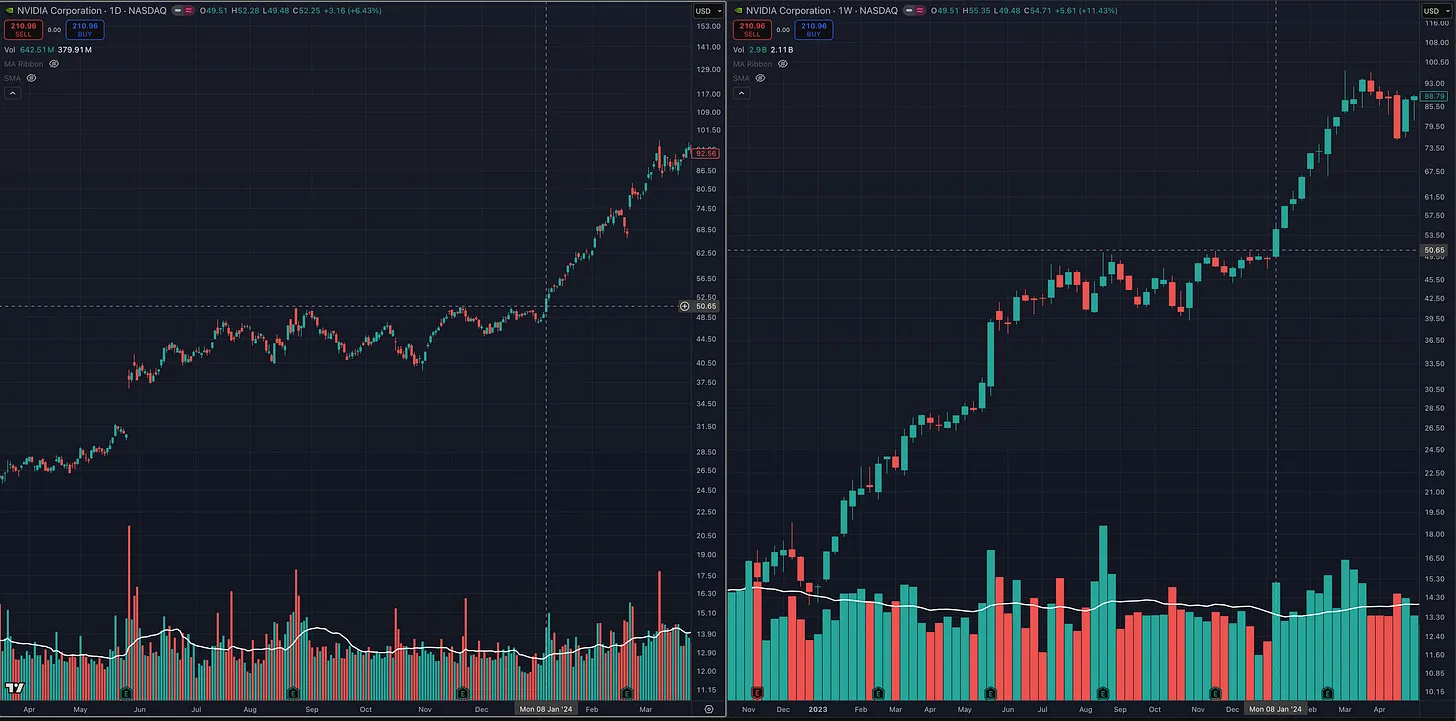
In the video, I use NVDA as an example. The stock formed a clear trend, moved sideways, tightened near its highs, and experienced declining volume during the consolidation. When it finally broke through the range, volume expanded significantly.
That basic sequence is at the heart of many of the setups I trade:
A strong prior move, constructive consolidation, tightening price action, declining volume, and expanding demand during the breakout.
The Moving Averages I Use
Moving averages can help make the trend easier to see, but they should support your price analysis rather than replace it.
The two primary moving averages I watch are:
- The 50-day moving average
- The 200-day moving average
The 200-day helps me evaluate the stock’s longer-term trend. A rising 200-day moving average, with the stock trading above it, generally suggests that the long-term trend remains healthy.
The 50-day helps identify the intermediate trend. It can also show whether institutional investors appear willing to support the stock during normal pullbacks.
For shorter-term trade management, I may also use:
- The 10-day moving average
- The 20-day moving average
These shorter moving averages can help manage a position after entry. For example, a break of the 10-day or 20-day may be a reason to reduce part of a position, tighten a stop, or become more defensive.
That does not mean every break requires selling the entire position. The action you take depends on the stock, the size of your profit, the market environment, and your trading time frame.
On a weekly chart, the same concepts apply. The 10-week moving average is approximately equivalent to the 50-day, while the 40-week is similar to the 200-day.
Why I Use Log Charts
I generally set my charts to logarithmic scale because I think in percentages rather than dollar amounts.
A move from $10 to $20 is a 100 percent gain.
A move from $100 to $110 is only a 10 percent gain.
On an arithmetic chart, both moves are displayed according to the number of dollars gained. On a log chart, they are displayed according to the percentage move.
For traders and investors who evaluate performance, risk, and returns in percentage terms, the log chart usually provides a more accurate visual representation.
Indicators Are Tools, Not Answers
I do use several additional tools, but I use them for specific purposes.
I do not add an indicator simply because it looks interesting. Every indicator should answer a question or help me make a decision.
For example, I use a position-sizing tool to calculate how many shares I can purchase based on my entry, stop, account size, and maximum acceptable portfolio risk.
If I enter a stock with a stop that is 7 or 8 percent below my entry, that does not mean I am risking 7 or 8 percent of my account. I can adjust the number of shares so that the total loss would still equal only 1 percent of the portfolio if the stop is triggered.
I may also use an ATR moving-average extension tool to identify when a stock has become unusually extended from a key moving average. This can help identify an area where it may make sense to sell part of the position into strength.
An ATR trailing stop or Donchian Channel can provide another method for managing a winning position and remaining in a longer-term trend.
These tools are not magical signals. They simply help with specific parts of the trading process:
- Position sizing
- Risk management
- Selling into strength
- Trailing a winning position
- Identifying potential trend changes
Once a tool has served its purpose, I often remove it from the chart.
I do not want unnecessary information competing for my attention.
Fundamentals Still Matter to My Process
Although I place the highest priority on price, I am not purely a technical trader.
I consider myself a techno-fundamental trader.
I want to find stocks with strong price action, but I also want to see characteristics such as accelerating earnings, strong sales growth, healthy margins, institutional sponsorship, and leadership within a strong industry group.
If two stocks have similar technical setups, but one has stronger growth fundamentals and belongs to a leading industry, I will usually favor that stock.
The fundamentals and relative strength help put the stock on my radar.
Price action and volume determine whether I actually take the trade.
Your Chart Should Force You to Read the Market
A clean chart forces you to develop the ability to recognize supply and demand.
You begin noticing when price bars become smaller.
You recognize when a stock begins making higher lows.
You see when volume starts drying up during a pullback.
You notice when a stock repeatedly finds support at a major moving average.
You learn to distinguish between normal consolidation and abnormal selling.
A beginner will not recognize everything immediately. That is normal.
The skill comes from studying hundreds and eventually thousands of charts. Study the greatest-performing stocks in history. Look at what they did before their major advances. Compare their price and volume characteristics. Pay attention to how they behaved around moving averages and how volume changed during consolidations and breakouts.
Over time, you will begin recognizing the same patterns in real time.
There is no perfect indicator, and there is no chart setup that removes uncertainty from trading.
For the style of momentum growth trading I practice, the foundation remains remarkably simple:
Price, volume, a few widely followed moving averages, proper position sizing, and disciplined risk management.
Your chart should probably look much more bare than you think.
That is not a weakness.
It means you are learning to read what actually matters.
One Final Thing I Forgot to Mention
This video was originally supposed to be a short, beginner-friendly explanation of how to set up a TradingView chart. Instead, I completely went off the reservation and turned it into a 25-minute discussion about price, volume, moving averages, position sizing, trade management, and several of the tools I use.
Since I already covered all of that, there is one final concept I should mention: the importance of looking at multiple time frames.
In the NVDA example, I would have executed the trade on the daily chart as the stock broke through the entry area. However, when you zoomed out, NVDA was also breaking out on the weekly chart.
Many of the best trades do not just look good on the specific time frame you are using for the entry. The setup also makes sense when you zoom out and examine the larger structure.
When in doubt, zoom out.
A daily breakout is often more meaningful when the weekly chart is also showing a strong base, tight price action, and a move toward or into new highs. The higher time frame provides the broader context, while the lower time frame helps you identify and manage the entry more precisely.
You will see this same principle throughout the MTS Course, even with shorter-term and intraday trades. An intraday setup may provide the execution trigger, but the stock may also be setting up well on the daily and weekly charts.
When multiple time frames are aligned, you are not relying on one isolated pattern. The longer-term trend, intermediate setup, and shorter-term entry are all supporting the same idea.
A breakout near or into new highs can also reduce the amount of overhead supply above the stock. There may be fewer trapped investors waiting to sell simply to get back to breakeven, which can give the stock a clearer path if demand continues to come in.
You do not need every time frame to look perfect, but before entering a trade, always zoom out.
Some of the best setups look good not only on the time frame where you are buying them, but across the higher time frames as well.
More in Strategy & Tactics
All Strategy & Tactics articles →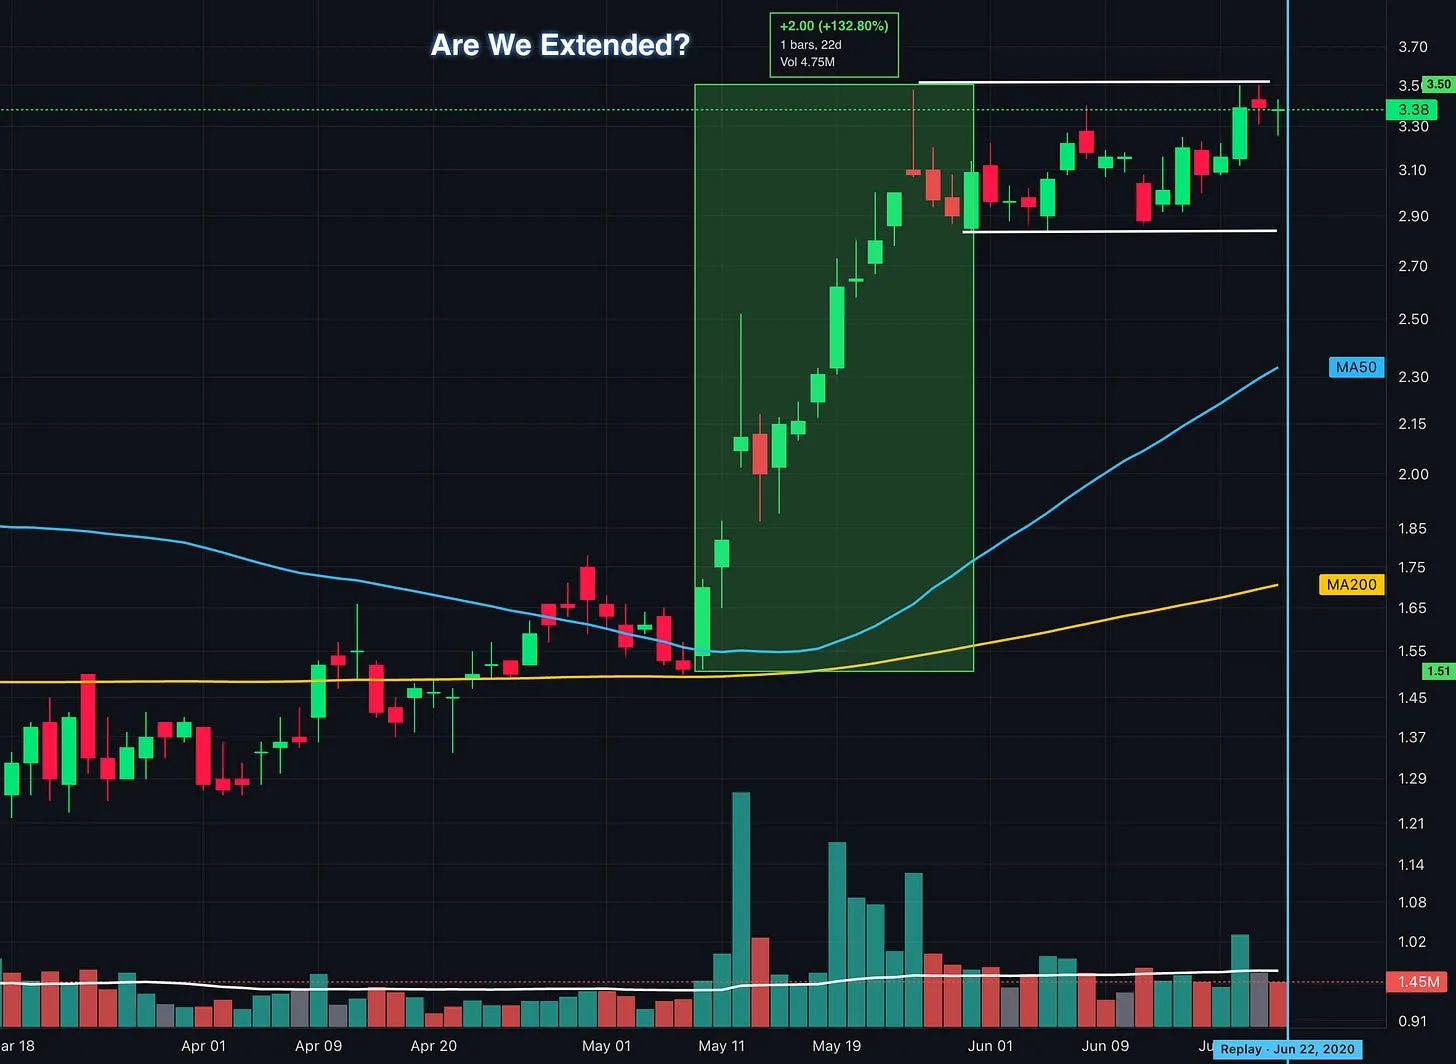
Oct 8, 2026 · Strategy & Tactics
Up 100% and Still Buyable? What Traders Get Wrong About Extended Stocks
How to identify proper buy points, avoid chasing stock breakouts, and manage entry risk using lessons from William O’Neil, Mark Minervini, David Ryan, and Dan Zanger.
- Momentum Trading
- VCP
- position trading
- Growth Stock Trading
- David Ryan
- Flag Pattern
- chart patterns
- Cup and Handle
Sep 27, 2026 · Strategy & Tactics
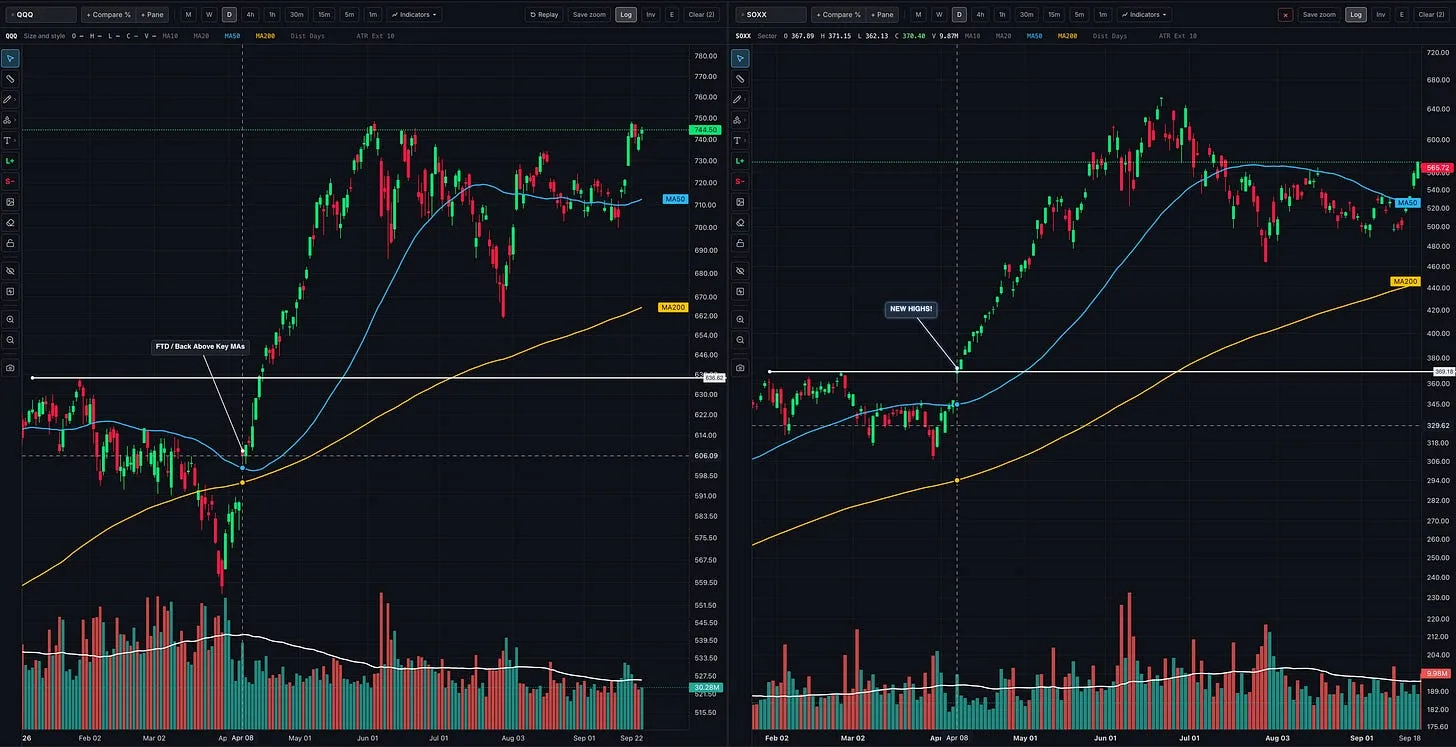
Should You Follow Leading Stocks or Wait for Market Confirmation?
How to read the market, industry groups, and individual stocks together so you can recognize opportunities, build exposure, and respond when conditions change
- growth stocks
- CANSLIM
- Trading
- position trading
- Stan Weinstein
- William O'Neil
- Momentum Trading Strategy
- Trade stocks
Sep 25, 2026 · Strategy & Tactics
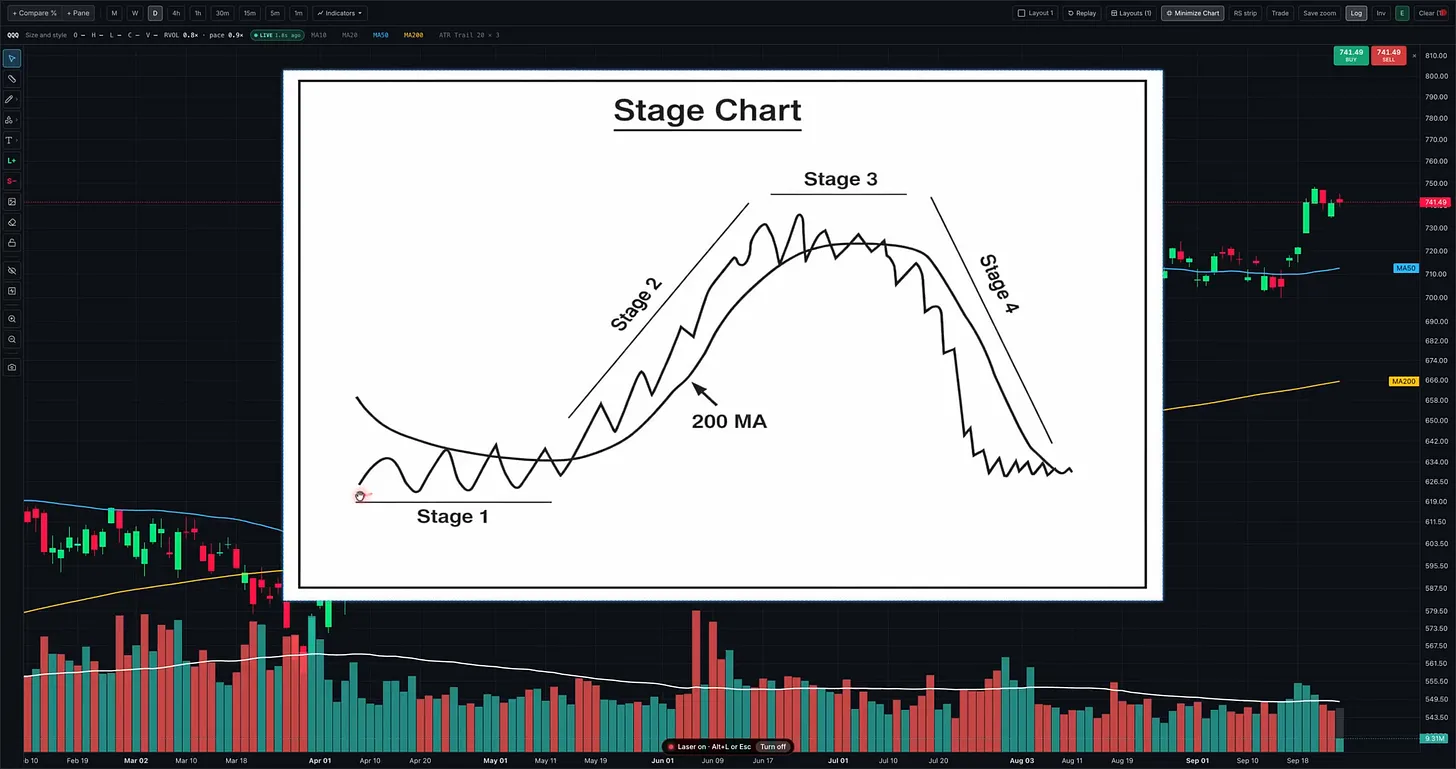
Stage Analysis: How to Spot Stage 3 in Real Time
Recognize a developing Stage 3 using Stan Weinstein’s framework, with real chart examples, warning signs, and lessons for protecting your gains
- Momentum Trading
- Nasdaq
- technical analysis
- CANSLIM
- position trading
- Stan Weinstein
- QQQ
- Find True Market Leaders