
Trading articles/When A Stock Looks Extended, What Should You Actually Do?
Feb 12, 2026 · Momentum Trading Strategy
When A Stock Looks Extended, What Should You Actually Do?
Weekly vs Daily Charts, Risk Definition, And Smarter Entry Decisions
Originally published on Substack.
You have probably felt this before.
A stock looks strong.
It is trending higher.
Everyone is talking about it.
Then you pull up the weekly or daily chart and it looks extended.
So now what?
Do you chase it?
Do you wait?
Do you ignore it completely?
This is one of the most common questions serious traders wrestle with.
And it is a good one.
Let’s break it down.
Weekly vs Daily
I use both. They serve different purposes.
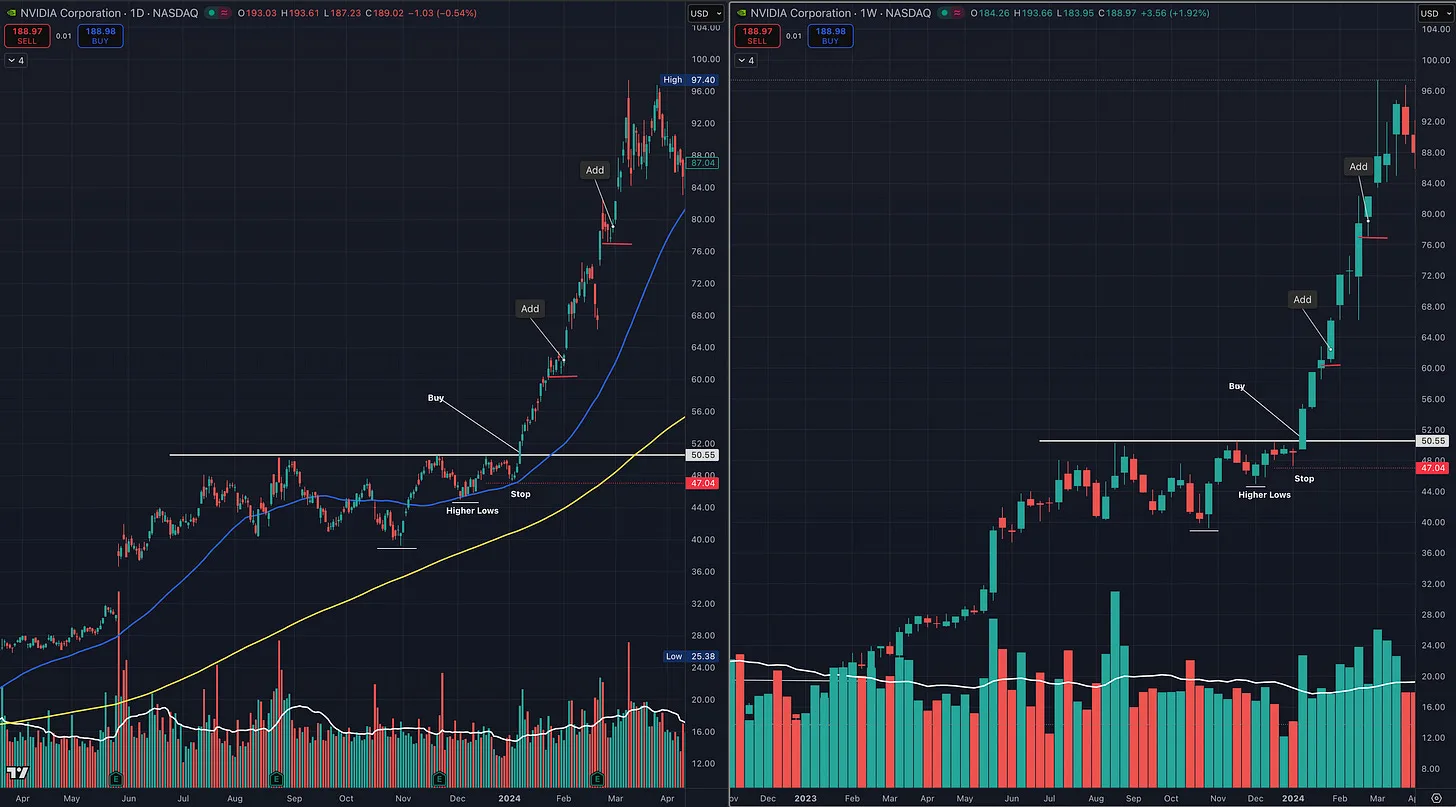
The weekly chart gives me structure, context and zoomed out trend.
Is the stock in a primary uptrend?
Is institutional sponsorship likely there?
Is the bigger trend intact?
The daily chart is more for timing and risk control.
Most of my entries come from daily setups because that is where I can define risk precisely.
That said, I do not follow a rigid sequence.
Sometimes I start with the weekly and drill down.
Sometimes I scan daily charts first and zoom out for confirmation.
I bounce back and forth.
The goal is not a strict order.
The goal is alignment across timeframes.
What “Extended” Actually Means
This is where context matters.
Some traders define extended very precisely:
• More than 4 to 5 percent past a proper pivot
• 15 percent above a key moving average
• 20 to 30 percent straight up with no consolidation
Others define it more visually:
• No nearby support to lean against
• No constructive pullback
• No low risk entry area
I am aware of the quantitative measures many use. But personally, I focus more on structure and low risk high reward setups than fixed numerical thresholds.
The real question for me is not:
Is it extended?
It is:
Can I clearly define risk from here?
If price is too far above logical support and there is no constructive structure nearby, I wait.
If there is tightness, contraction, or a controlled pullback that restores asymmetry, it becomes actionable.
Extension is contextual.
Risk definition is universal.
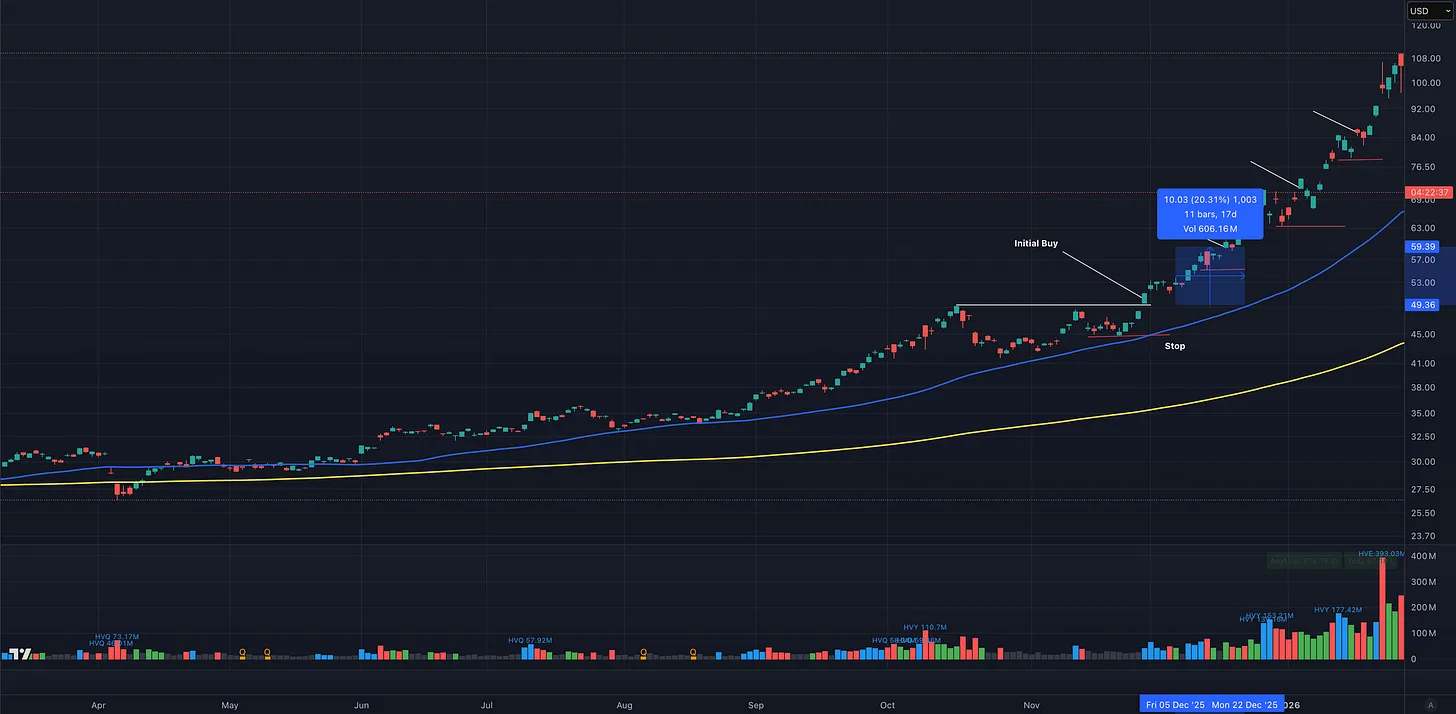
SLV Daily Chart — Breakout From Base Followed By Secondary Risk-Defined Entries
Initial buy triggered on the base breakout with a stop below the higher low.
Price ran roughly 20 percent from the initial entry. Many would call that extended, and relative to the original pivot, it was.
But notice what happened next.
A slight pullback formed. That pullback created a new, clearly defined risk point at the low of the candle.
From there, additional entries or adds were possible with controlled risk.
Yes, the stock was extended from the first buy.
But it was not extended relative to new structure.
This is the distinction.
Extension from an old pivot does not automatically eliminate opportunity if new structure forms and risk can be defined.
You can buy strength if risk is clear.
Or you can pass and wait for a cleaner reset.
Both are valid.
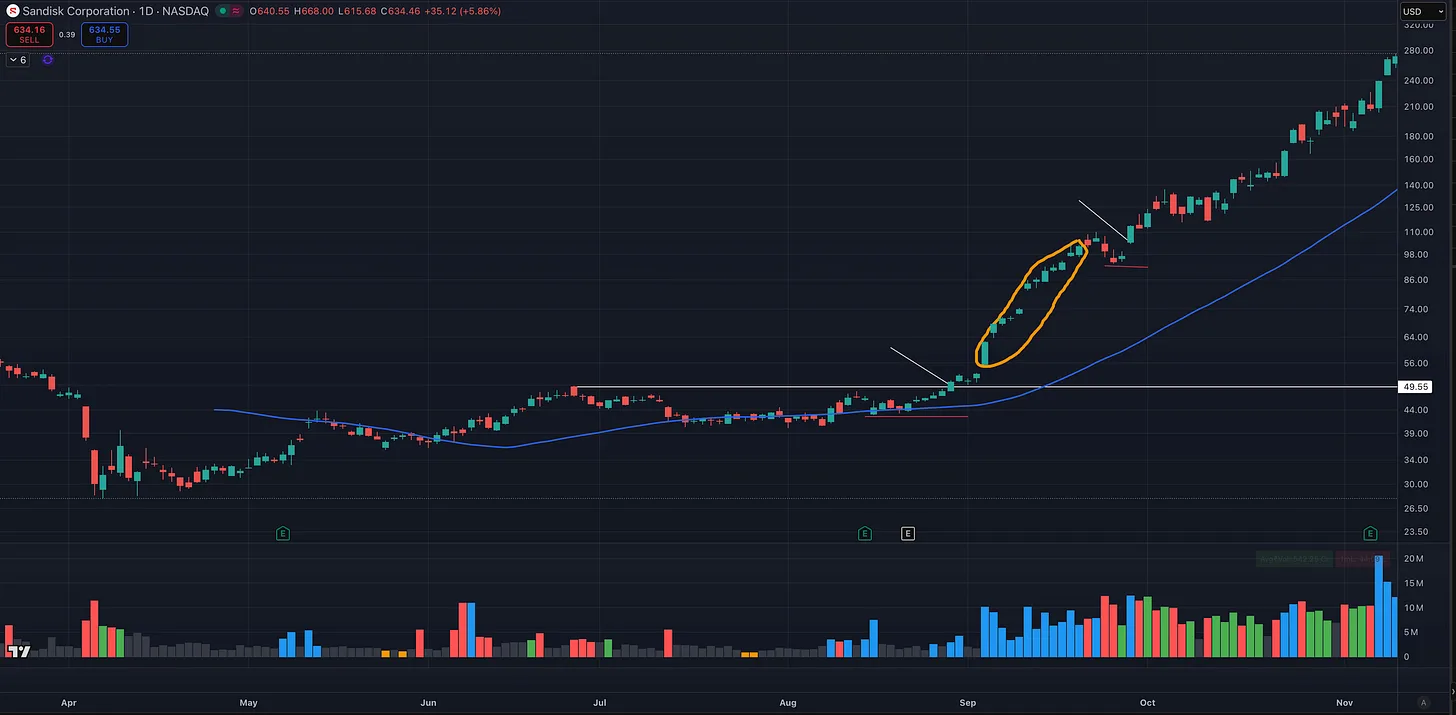
SNDK Daily Chart — 83 Percent Run From Base With Minimal Consolidation
After the September breakout, price advanced roughly 83 percent with little to no meaningful pullback.
This is a classic momentum expansion.
From a structural standpoint, there were very few clear secondary entry points on the daily chart once the move was underway. Price simply accelerated.
In situations like this, traders generally have two choices:
• Drop to lower timeframes and use tactical tools such as intraday opening range breakouts
• Or remain patient and wait for a constructive pullback to restore favorable reward to risk, which eventually developed after the sharp advance
This is an example of true extension where risk becomes difficult to define on the daily timeframe.
It does not mean the trend is over.
It means participation requires precision or patience.
Sometimes the highest quality trade is the one you do not force.
A Quantifiable Way Some Traders Measure Extension
Some traders prefer a fully objective, volatility adjusted way to measure extension.
For example, using a method that looks at how far price has extended above the 50 day moving average relative to the stock’s own Average True Range.
Instead of simply saying a stock is 15 percent above the 50 day, you can normalize that move by volatility and measures how many multiples of ATR price has stretched above the 50 day.
This accounts for the fact that a high volatility stock can naturally travel farther than a low volatility one before becoming statistically stretched.
In that framework:
• Around 7 to 10 times ATR from the 50 day may trigger partial profit taking
• Around 10 times ATR is often considered heavily extended
• Indexes historically show caution zones at lower multiples
This gives traders a mechanical way to scale out into strength and avoid initiating new positions when reward to risk becomes skewed.
I think that approach makes sense.
It is systematic.
It is volatility aware.
It reduces subjectivity.
That said, I do not personally use fixed ATR multiples.
And it is not required.
O’Neil did not rely on ATR multiples either. He focused on proper pivot buy zones, structural context, and whether a stock was extended beyond a sound entry area.
For me, extension still comes back to structure and risk definition. If I cannot clearly define risk against nearby support or a constructive consolidation, I pass.
Different tools. Same principle.
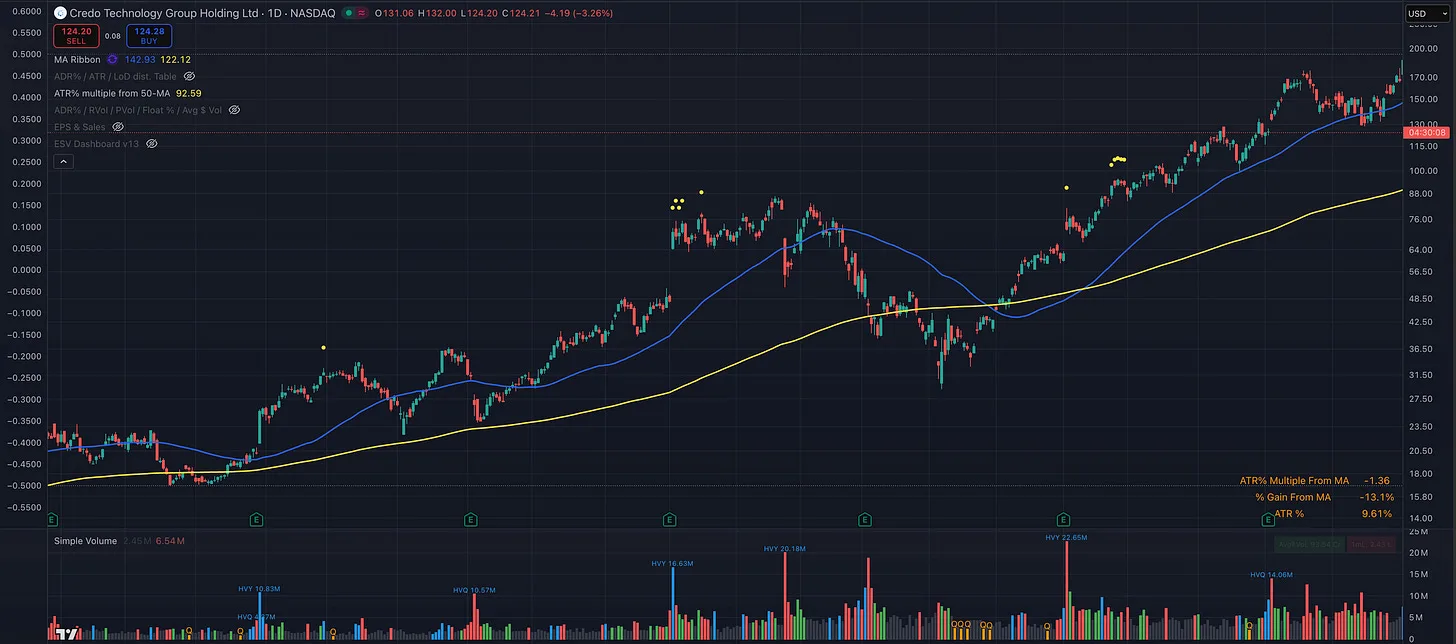
CRDO Daily Chart — Yellow dots mark when price reached ~10x ATR extension above the 50-day moving average.
Notice how these signals often occurred during momentum expansions. In some cases, they aligned with meaningful pullbacks and offered logical areas to scale out into strength before a cooldown.
In other instances, price only paused briefly and continued much higher.
This is not a sell signal. It is an objective extension gauge.
Used properly, it helps manage risk and lock in gains during extreme momentum without assuming the trend is over.
Why I Share “Extended” Names
Yes, some of the names I share may look extended on the weekly.
That is intentional.
I am not telling you to chase them.
I am sharing strength.
Leaders often look extended. That is what leadership does.
Strong names belong on your radar. If they pull back constructively and align with your timeframe and risk tolerance, that is when they become actionable.
The goal is not for everyone to trade them the same way.
The goal is alignment.
We can all trade the same stock differently and make money:
• One trader enters on an intraday breakout and sells into strength.
• Another buys a daily pullback and holds for a swing.
• Another manages it on the weekly and rides the larger trend.
Same stock. Different timeframes. Different management. Different outcomes.
Some subscribers here will trade certain names better than I do.
That is not a flaw.
That is the point.
Your edge is not copying entries.
Your edge is aligning:
• Timeframe
• Volatility tolerance
• Risk management
• Personality
With the right names.
Final Thought
Timeframes are personal.
Extension is contextual.
Risk definition is non negotiable.
The market rewards alignment, not imitation.
You do not need the perfect stock.
You need alignment between the stock and your process.
More in Strategy & Tactics
All Strategy & Tactics articles →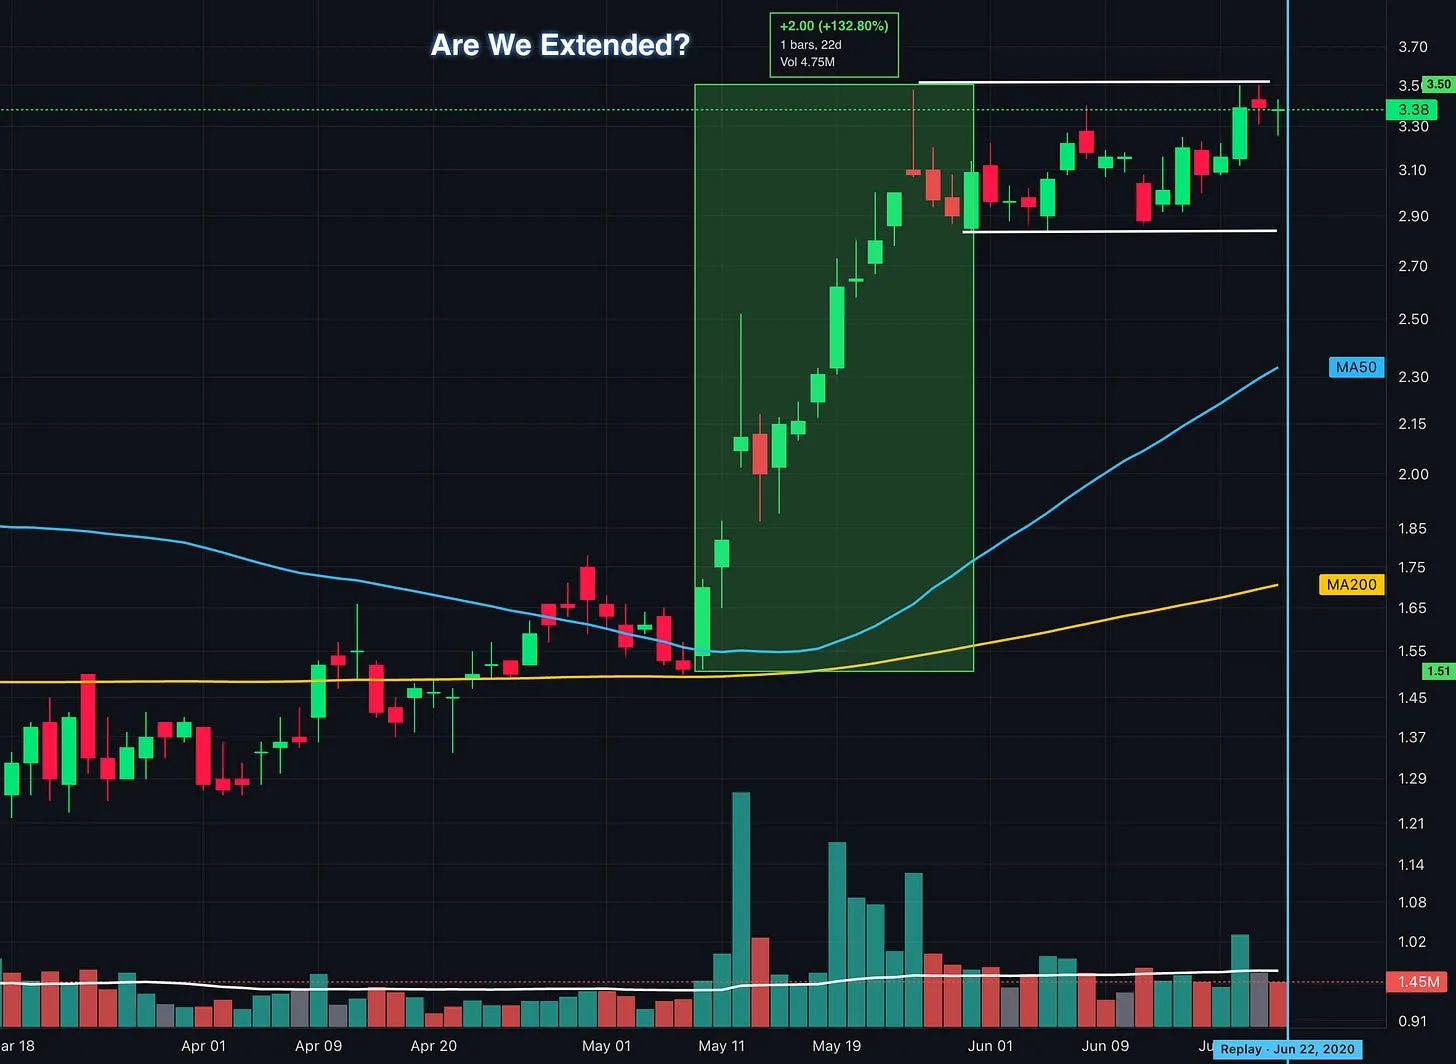
Oct 8, 2026 · Strategy & Tactics
Up 100% and Still Buyable? What Traders Get Wrong About Extended Stocks
How to identify proper buy points, avoid chasing stock breakouts, and manage entry risk using lessons from William O’Neil, Mark Minervini, David Ryan, and Dan Zanger.
- Momentum Trading
- VCP
- position trading
- Growth Stock Trading
- David Ryan
- Flag Pattern
- chart patterns
- Cup and Handle
Sep 27, 2026 · Strategy & Tactics
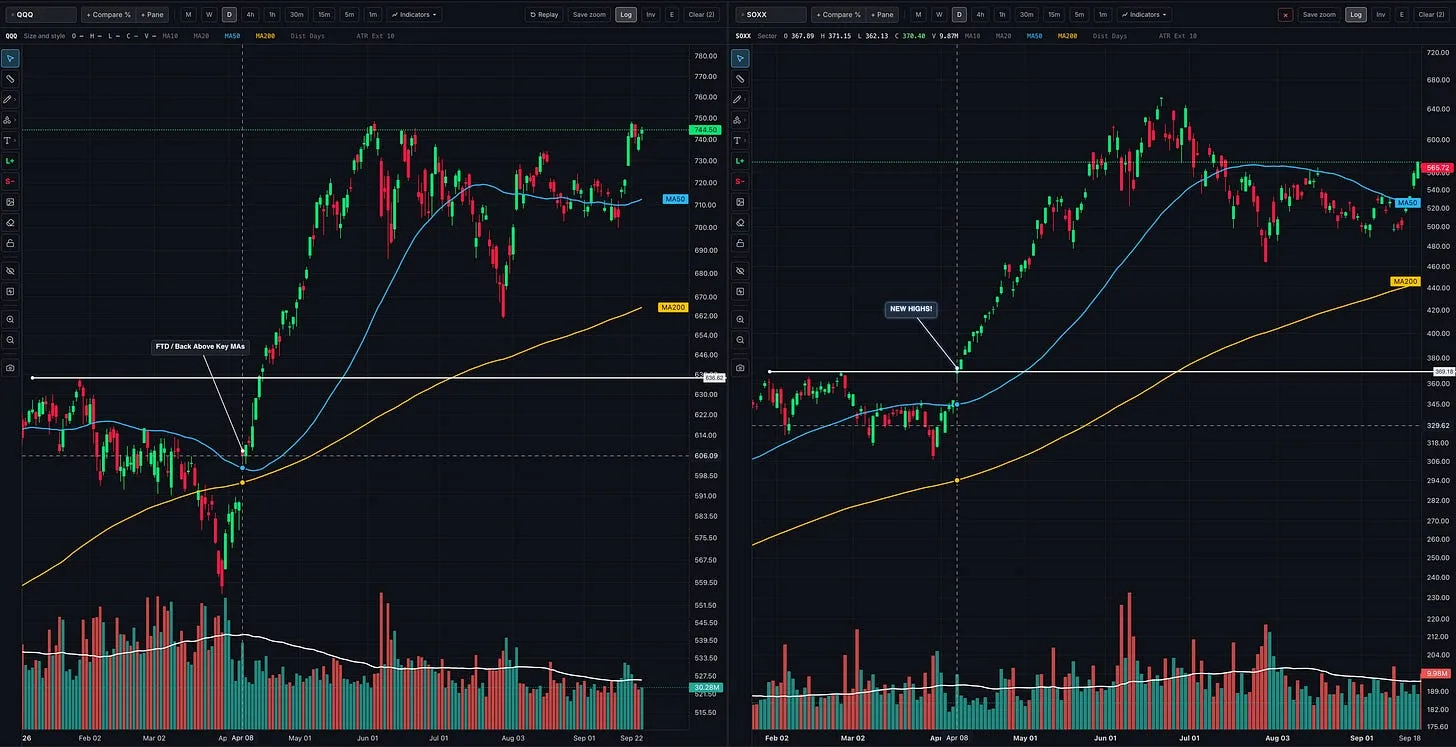
Should You Follow Leading Stocks or Wait for Market Confirmation?
How to read the market, industry groups, and individual stocks together so you can recognize opportunities, build exposure, and respond when conditions change
- growth stocks
- CANSLIM
- Trading
- position trading
- Stan Weinstein
- William O'Neil
- Momentum Trading Strategy
- Trade stocks
Sep 25, 2026 · Strategy & Tactics
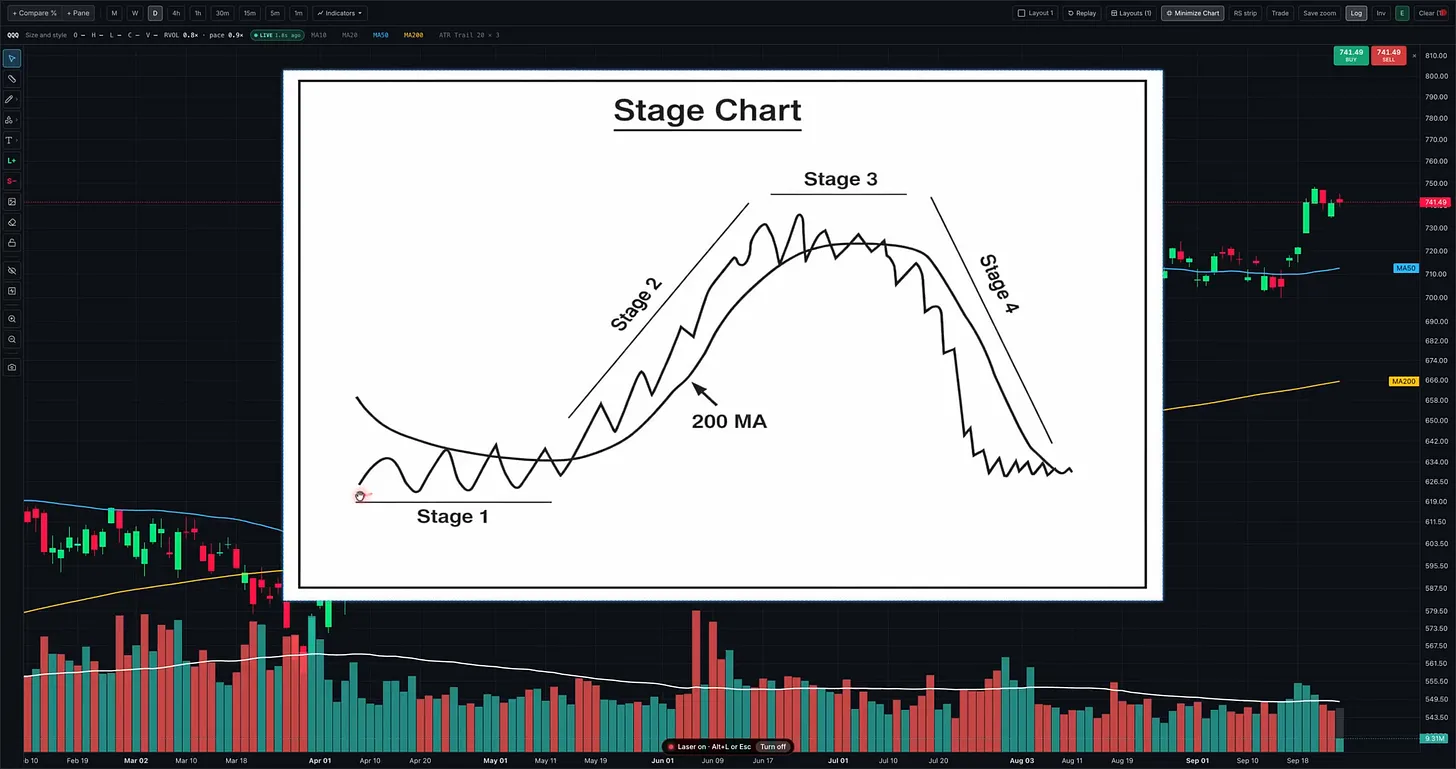
Stage Analysis: How to Spot Stage 3 in Real Time
Recognize a developing Stage 3 using Stan Weinstein’s framework, with real chart examples, warning signs, and lessons for protecting your gains
- Momentum Trading
- Nasdaq
- technical analysis
- CANSLIM
- position trading
- Stan Weinstein
- QQQ
- Find True Market Leaders