
Trading articles/The Volatility Contraction Pattern: Mark Minervini’s Setup Before the Breakout
Jun 30, 2026 · Momentum Trading Strategy
The Volatility Contraction Pattern: Mark Minervini’s Setup Before the Breakout
Used by elite growth and momentum traders for decades, the VCP reveals drying supply, building demand, and a defined-risk entry before a leader breaks out.
Originally published on Substack.
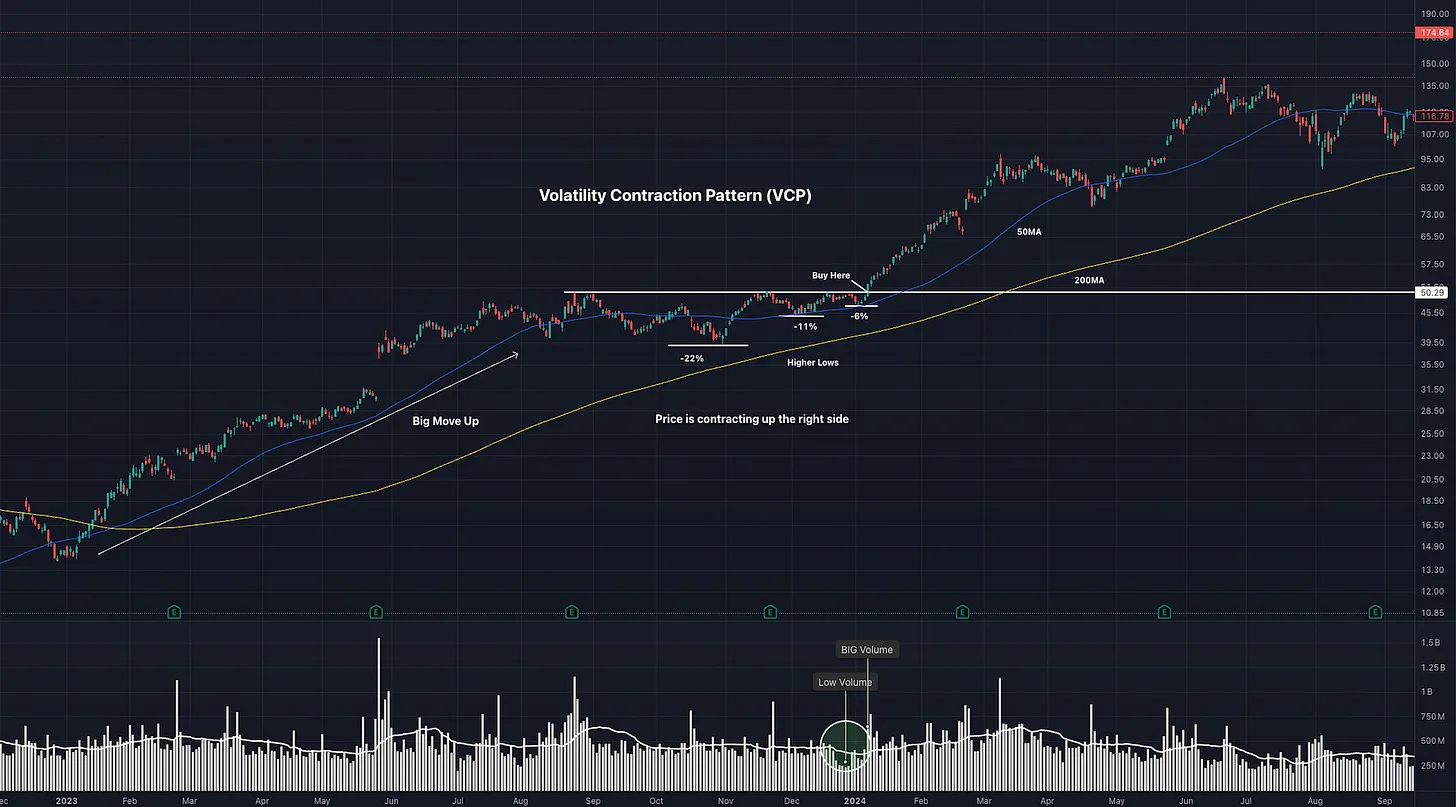
One of the most powerful concepts in Mark Minervini’s trading methodology is the Volatility Contraction Pattern, better known as the VCP. At first glance, it may look like a simple consolidation, but the real message is much deeper. The VCP shows a stock moving through a controlled process where volatility contracts, volume dries up, weak holders are shaken out, and stronger hands begin to absorb the available supply.
That is why the VCP has become one of the most important setups for growth stock traders. It is not about guessing which stock will move next. It is about identifying when a leading stock has already shown strength, corrected in an orderly way, tightened on the right side of the base, and reached a point where demand can overwhelm what little supply remains.
The best setups are rarely obvious to the majority before they work. They usually form after a stock has already made a significant advance, which makes many investors think the opportunity has passed. In reality, that first move is often what proves demand exists, and the VCP is the structure that helps determine whether the stock is resting constructively or beginning to break down.
What Is the Volatility Contraction Pattern?
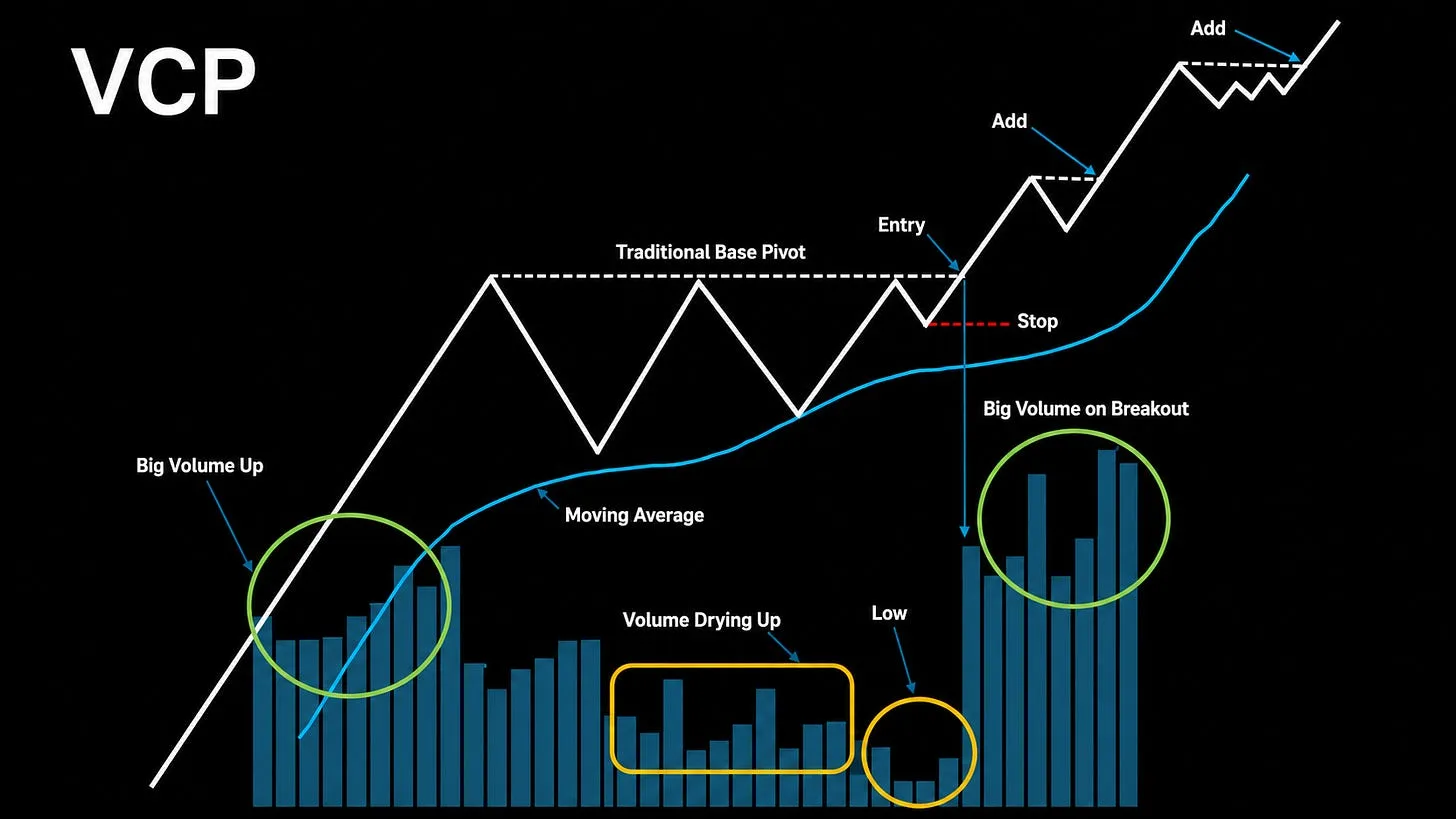
The Volatility Contraction Pattern is a continuation setup that forms after a stock has already shown meaningful price strength. Instead of collapsing after its advance, the stock begins to consolidate and go through a series of pullbacks. Each pullback should generally become smaller than the prior one, showing that selling pressure is being absorbed.
A simple example would be a stock that advances strongly lets say 100%, then corrects 25 percent, rallies, pulls back 15 percent, rallies again, and finally pulls back only 7 percent before tightening near a pivot. The exact percentages and contractions do not need to be perfect. Sometimes there are only two or three contractions, while other VCPs can produce as many as five or six. Volatility should contract from left to right as the stock moves closer to a potential breakout area. An ideal VCP will often show higher lows as price tightens toward the pivot, with volume decreasing during the pullbacks and expanding as the stock breaks out.
This is the main difference between a true VCP and random price chop. In a true VCP, the structure becomes more controlled as the base develops. In random chop, the stock swings wildly, undercuts key areas repeatedly, and fails to show the orderly tightening that suggests supply is drying up.
Why the VCP Works
The VCP works because it reflects the law of supply and demand. Early in the base, there are still plenty of sellers. Some are locking in profits after the prior advance, some are shaken out by volatility, and some simply do not have the conviction to hold through a normal correction.
As the base matures, that supply should become smaller. The stock should stop pulling back as deeply, the daily and weekly ranges should narrow, and volume should contract during the tightest areas. This is the footprint of a stock moving from weak hands to stronger hands.
By the time the stock reaches the right side of the base, the ideal situation is that most of the anxious sellers have already sold. If demand returns at that point, the stock does not need a massive amount of buying pressure to move higher. With supply already reduced, even a moderate increase in demand can push the stock through the pivot and into its next advance.
The Prior Uptrend Matters
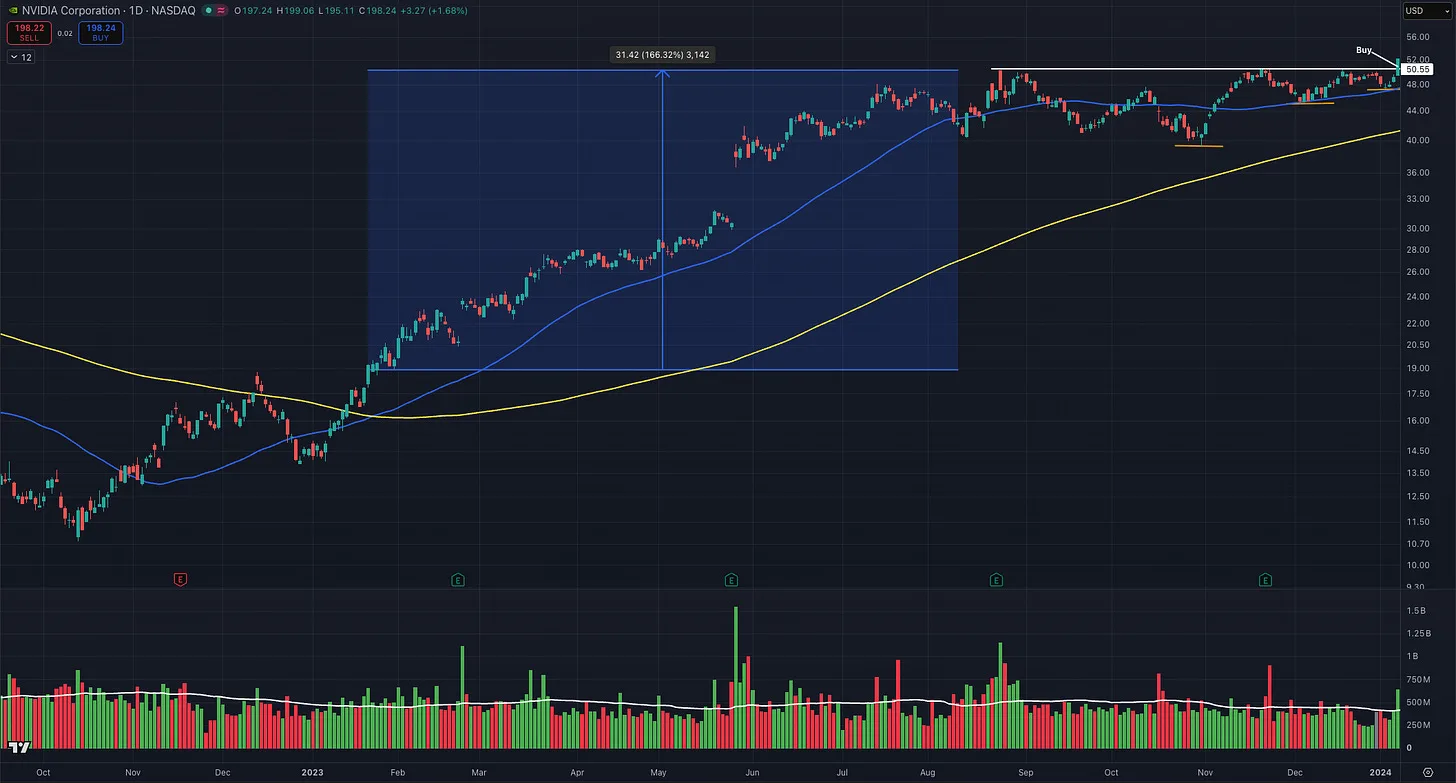
A VCP should not be viewed in isolation. One of the most important points in Minervini’s framework is that the VCP occurs within an existing uptrend. In other words, the setup is not a bottom-fishing pattern, and it is not designed to buy weak stocks simply because they have gone down.
The strongest VCPs usually form after a stock has already advanced 50 percent, or more. That prior advance matters because it shows there is already demand for the stock. It also suggests the stock may be under accumulation and could be part of a larger leadership move.
This is where many traders make a major mistake. They see a stock that has already moved up and assume it is too late, but many of the biggest winners first prove themselves with strength, then build a constructive base, then resume higher from a proper pivot.
The Contractions Are the Message
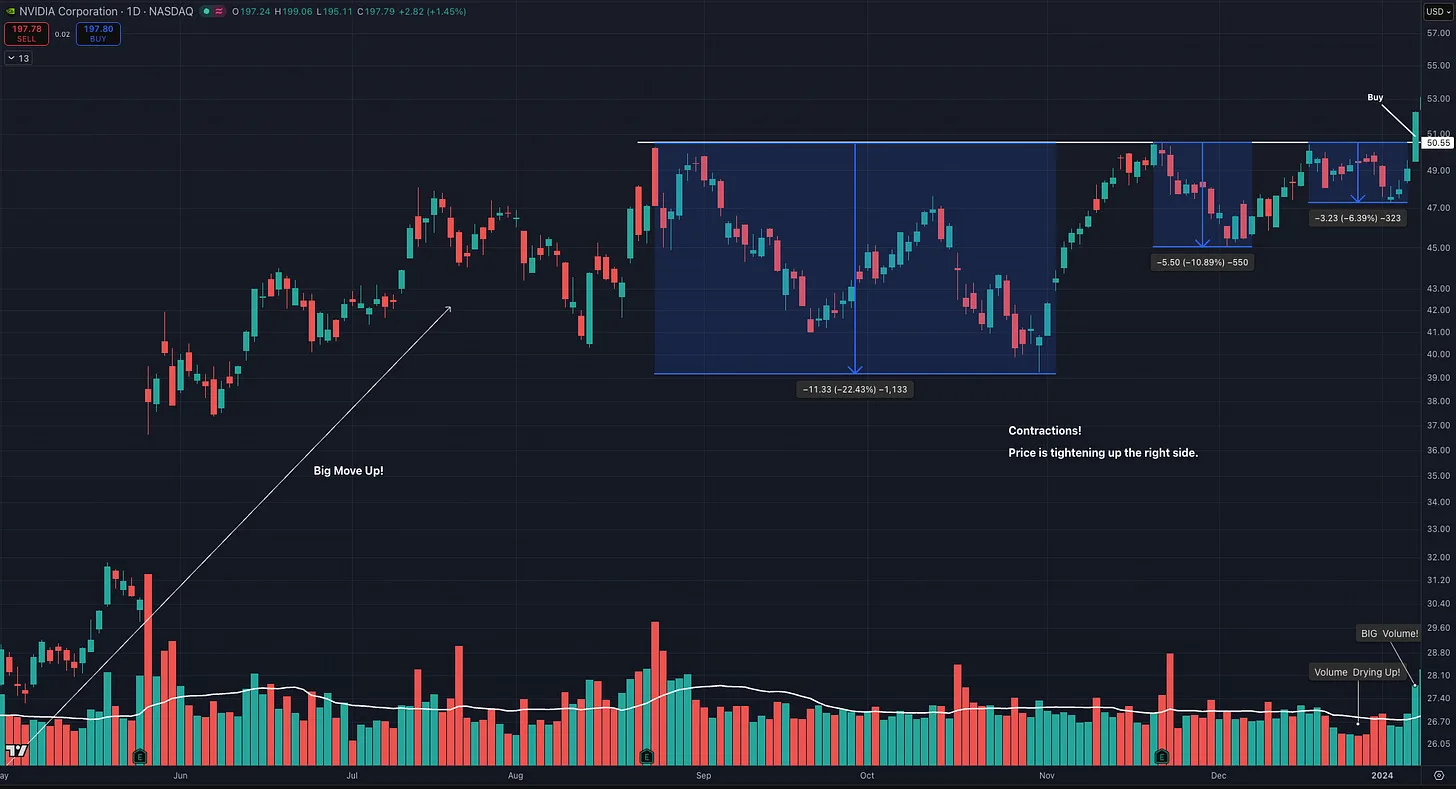
The heart of the VCP is the contraction sequence. The first pullback is usually the deepest because sellers are still active. The next pullback should be smaller, and the one after that should be smaller again.
This progression matters because it shows the stock is becoming harder to push down. Each wave of selling produces less downside damage than the one before it. That is what creates the coiled spring effect traders often associate with the pattern.
Minervini often describes this process as volatility moving from greater volatility on the left side of the base to lesser volatility on the right side. That is the real visual clue. The stock should look like it is tightening, quieting down, and preparing for a decisive move.
Volume Should Confirm the Tightening
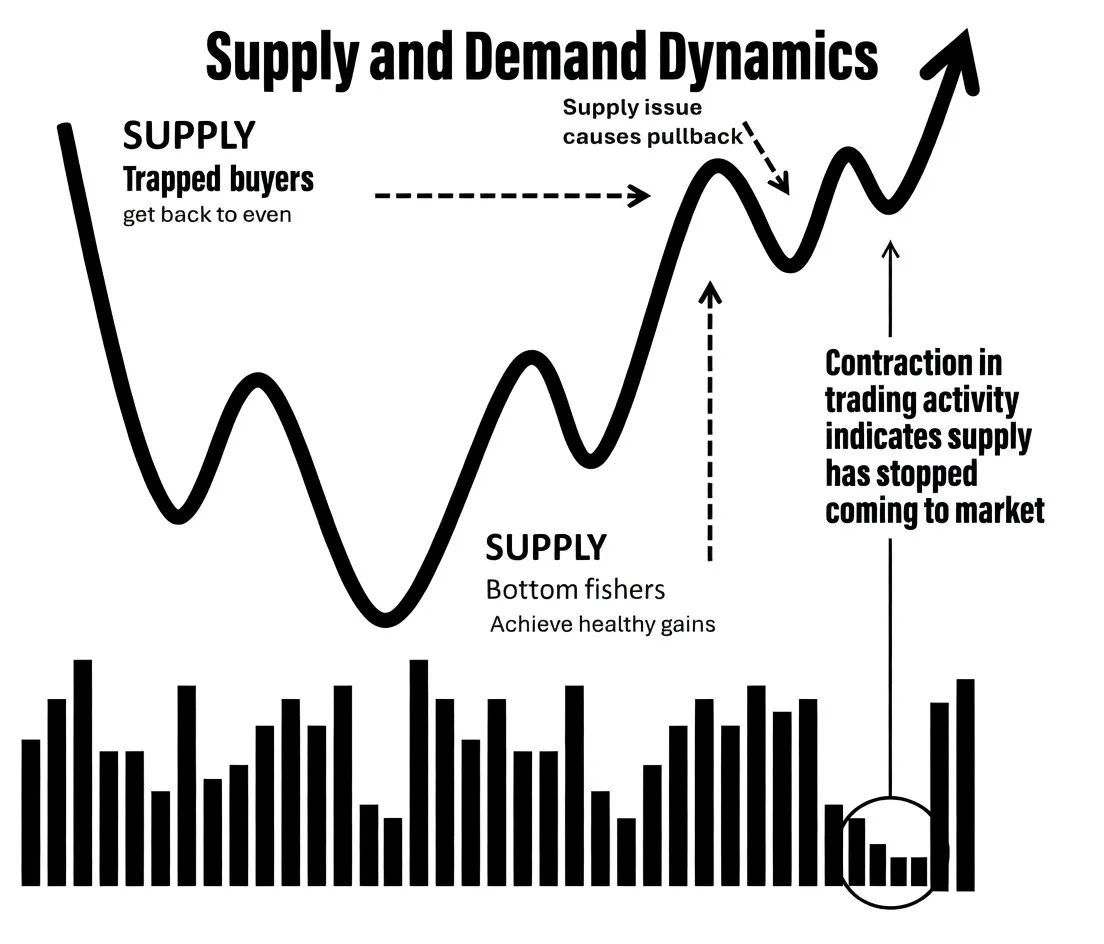
Price contraction is important, but volume is too. A proper VCP should generally show volume drying up during the contractions, especially near the right side of the base. When price tightens and volume contracts together, it suggests fewer shares are coming to market.
This is why low volume near the pivot is not automatically a negative. In the right context, low volume can be constructive because it shows there may be very little supply left. The key is that the low volume should occur during tight, controlled price action, not during a loose and sloppy decline.
The breakout is different. Once the stock moves through or above the pivot, you want to see demand show up. Expanding volume through the pivot gives the move more credibility because it shows buyers are stepping in at the exact point where the stock is trying to launch from the base.
The Pivot Is the Call-to-Action Point
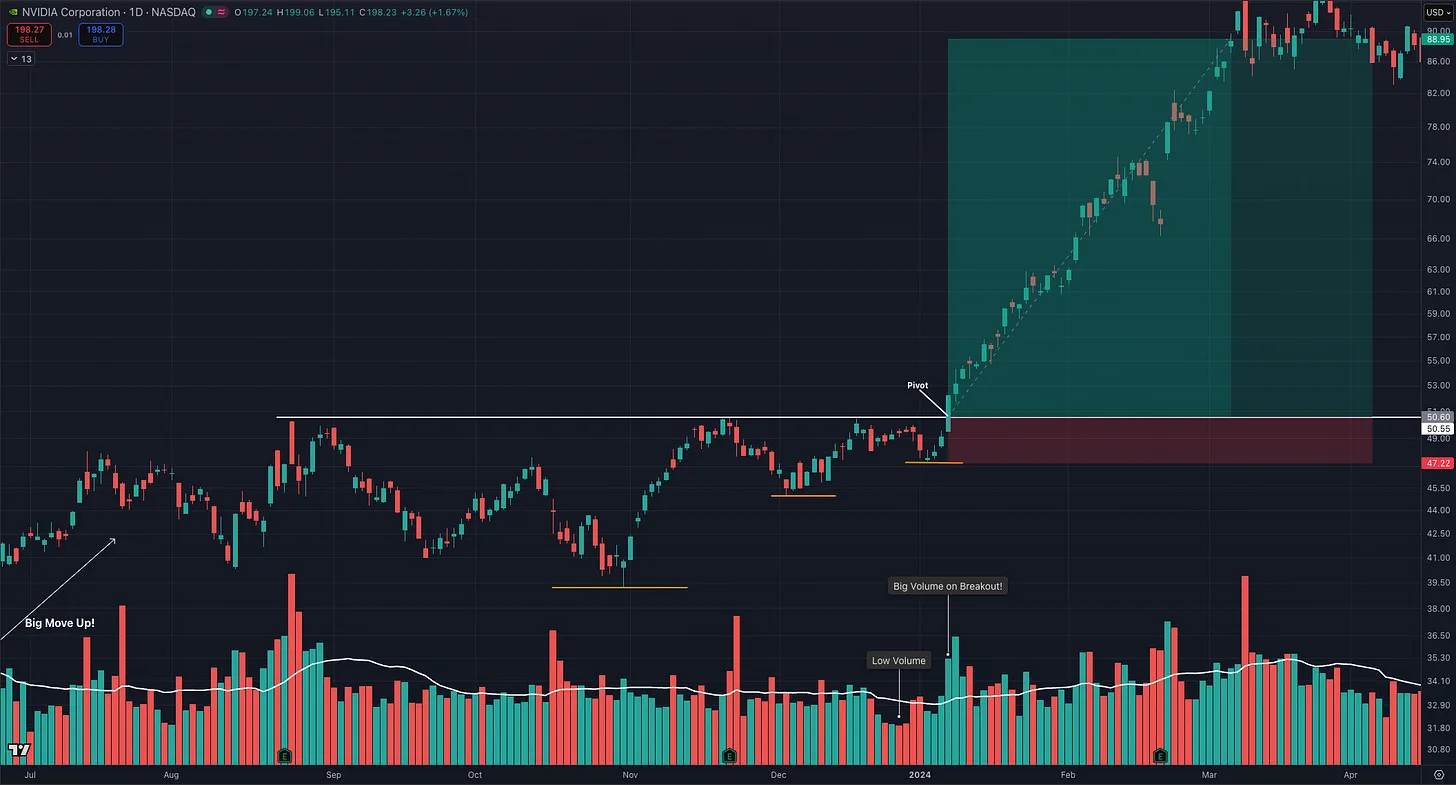
The pivot is not just a random resistance level. It is the price area where the stock has completed its consolidation and is attempting to begin the next leg higher. This is where the trader can define the entry, define the risk, and avoid buying in the middle of the base.
A proper pivot usually forms after the stock has tightened on the right side of the pattern. The goal is to buy as close to the pivot as possible, rather than chasing the stock after it is already extended. The closer the entry is to the pivot, the easier it is to control risk.
This is one reason the VCP can offer such a strong reward-to-risk profile. The setup creates a logical entry point and a logical area where the trade should not come back below if the breakout is truly working. The risk is not eliminated, but it becomes defined.
What a Strong VCP Should Look Like
A strong VCP begins with a stock that has already shown leadership. The stock should be in an uptrend, preferably with strong relative strength, strong growth fundamentals (sales, earnings, margins/roe), and evidence of institutional demand. The base should form after a meaningful prior advance, not after a long and obvious downtrend.
The contraction sequence should be orderly. The pullbacks should generally become shallower, the price action should become tighter, and the stock should begin to hold higher lows. The right side of the base should look controlled, not chaotic.
Volume should support the structure. You want to see volume contract during the quietest areas and then expand as the stock clears the pivot. When price tightness, volume contraction, and a strong prior uptrend come together, the stock may be setting up for a powerful continuation move.
What Is Not a VCP
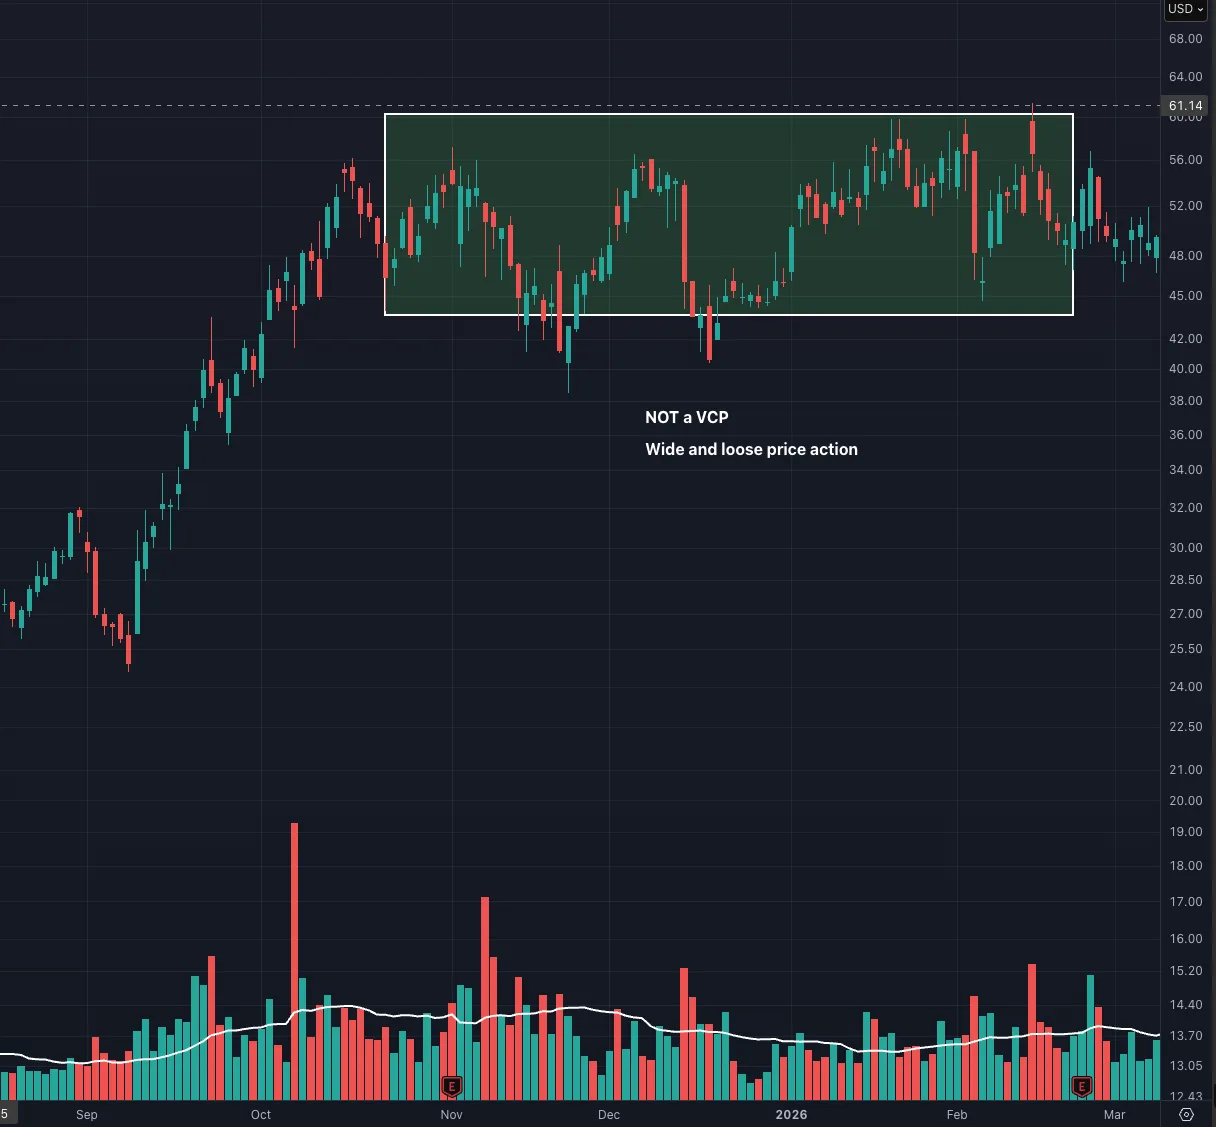
Not every consolidation is a VCP. A stock that swings wildly from high to low without tightening is not showing the right type of contraction. A stock that keeps undercutting prior lows and failing to recover is not showing strong demand.
A loose base with heavy selling on the right side is also not ideal. If the stock is still seeing large waves of supply near the pivot, it may not be ready. A proper VCP should show that supply is decreasing as the pattern develops.
Another mistake is forcing the pattern onto weak stocks. The VCP is most useful when applied to leaders, not laggards. A weak stock that has fallen for months and then trades sideways is usually not the same thing as a leading stock digesting a prior advance.
Risk Management Still Comes First
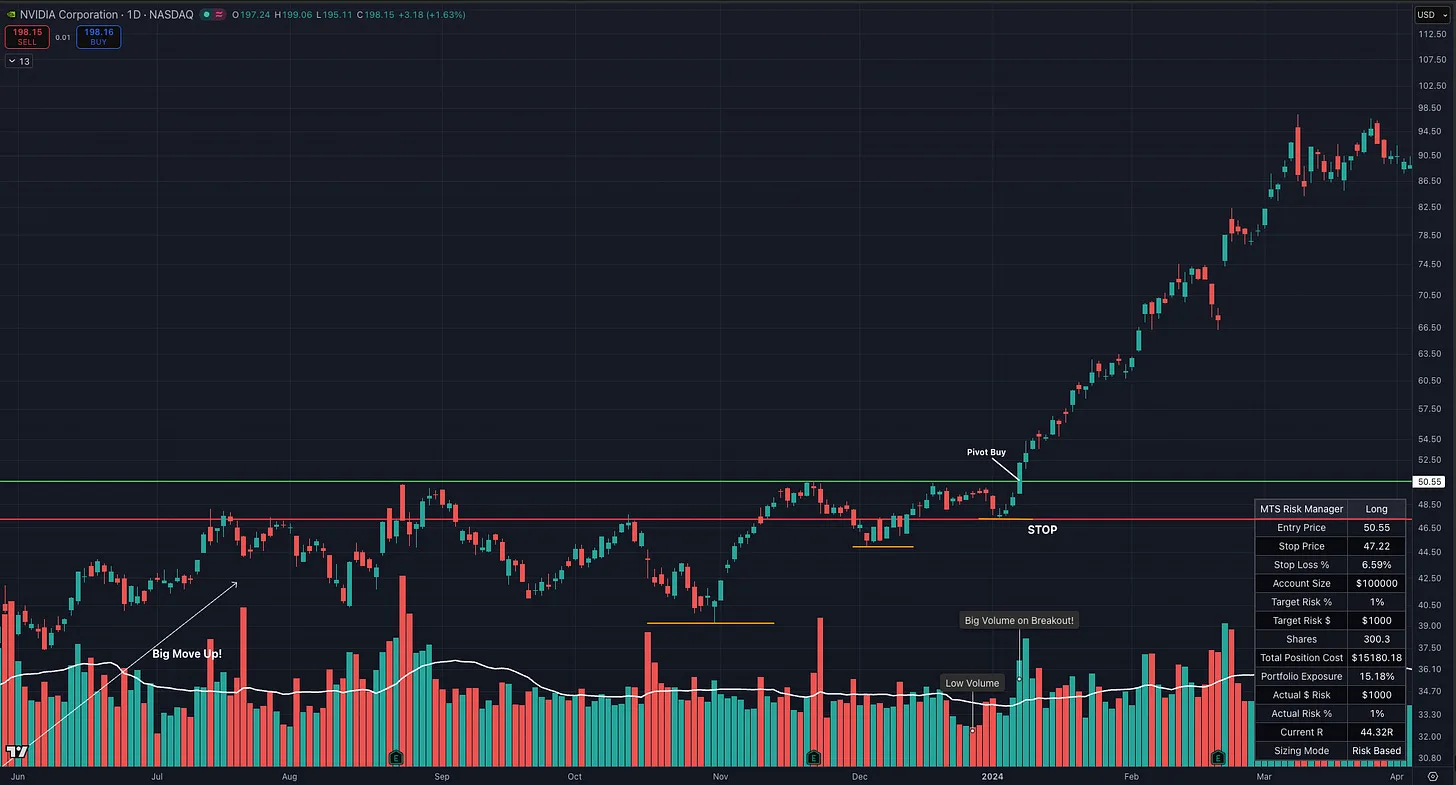
The VCP is powerful, but it is not magic. Even the best-looking setups can fail, especially in a weak or volatile market. That is why risk management has to be part of the setup before the trade is ever entered.
Before buying, the trader should know where the trade is wrong. Minervini emphasizes establishing a maximum stop loss in advance, and then honoring it if the stock moves against the position. This keeps one failed breakout from turning into a major portfolio problem.
The best VCPs make risk easier to define because the entry is near a pivot and the base has tightened. If the stock immediately fails after breaking out, that is information. The goal is not to be right every time, but to keep losses controlled when the setup does not work.
The Bigger Lesson
The VCP is not valuable because it has a catchy name. It is valuable because it teaches traders how to read the battle between supply and demand. When a stock advances, consolidates, tightens, and breaks out through a proper pivot, the chart is showing that sellers may have been absorbed and buyers may be taking control.
This is why the pattern has remained so important among growth stock traders. It provides a structured way to identify breakouts, define risk, and enter near the point where the stock may begin its next advance. It also helps traders avoid buying too early, chasing too late, or confusing random volatility with real accumulation.
The best traders are not simply looking for stocks that are moving. They are looking for stocks that are moving correctly, consolidating correctly, and setting up correctly. The VCP gives traders a framework for recognizing that process before the next major move begins.
Final Thought
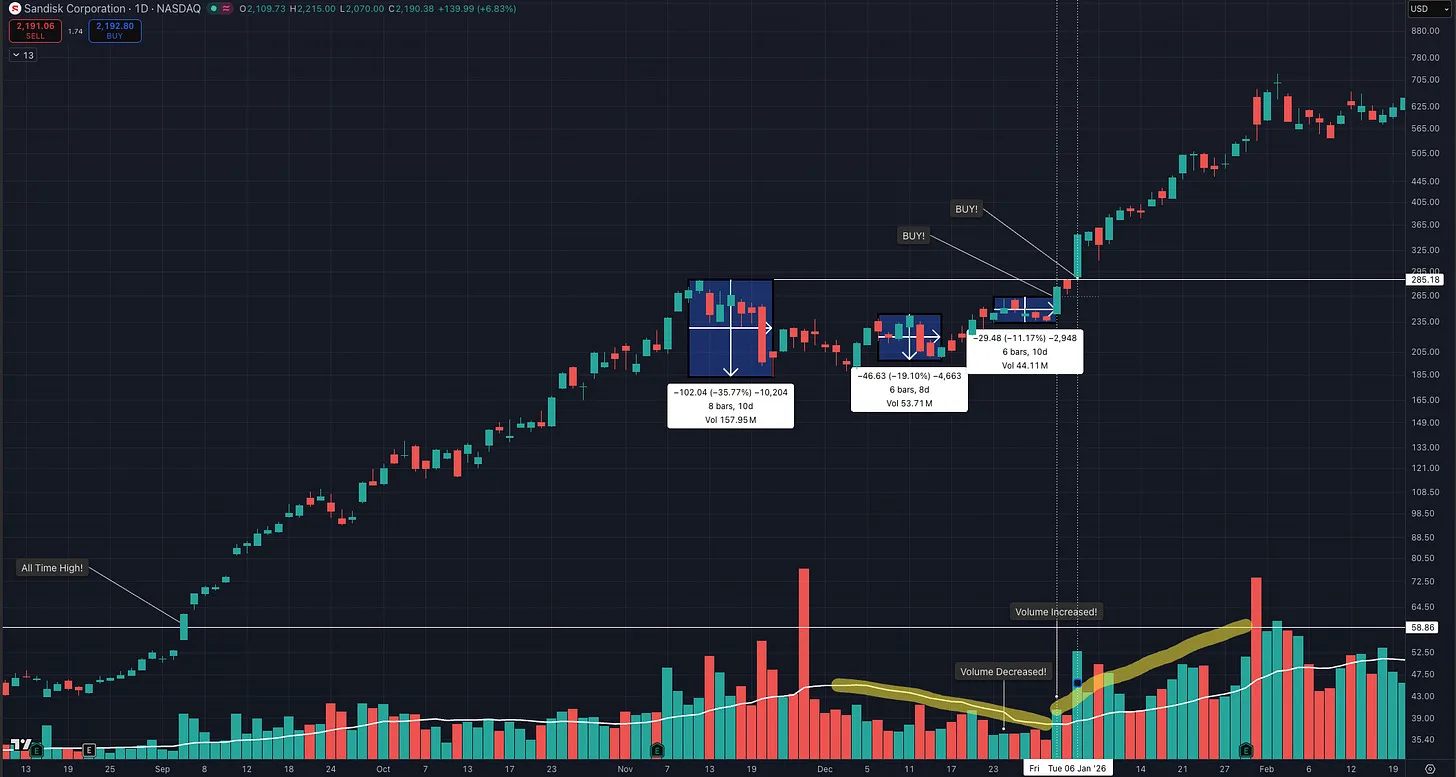
The Volatility Contraction Pattern is one of the clearest visual examples of supply and demand at work. Unfortunately, high-quality VCPs are rare. Some markets produce more of them, while other environments produce very few. That is part of what makes them so valuable when they do appear.
For me, the biggest benefit of studying the VCP has been learning how to read supply and demand more clearly on a chart. Even when a setup does not meet every characteristic of a textbook VCP, the same principles can still be useful. Tightening price action, higher lows, declining volume on pullbacks, and a clear pivot can all help reveal whether supply is being absorbed.
The biggest advantage of the VCP is that it gives traders a structured way to define risk. A leading stock advances, corrects, tightens, and eventually reaches a point where available supply has been reduced. If demand returns at the pivot, the stock can move quickly because there is little resistance left in its way.
That creates a clear area to buy, along with a clear line in the sand if the trade is wrong. In many cases, that line is just below the last higher low or the final tight area before the breakout.
That is the real power of the VCP. It is not about predicting. It is about waiting for evidence, identifying the line of least resistance, defining risk near the pivot, and acting only when the stock moves into position.
The VCP is one of the best ways to take a calculated risk when a stock may be moving from consolidation into its next explosive advance.
More in Legendary Traders
All Legendary Traders articles →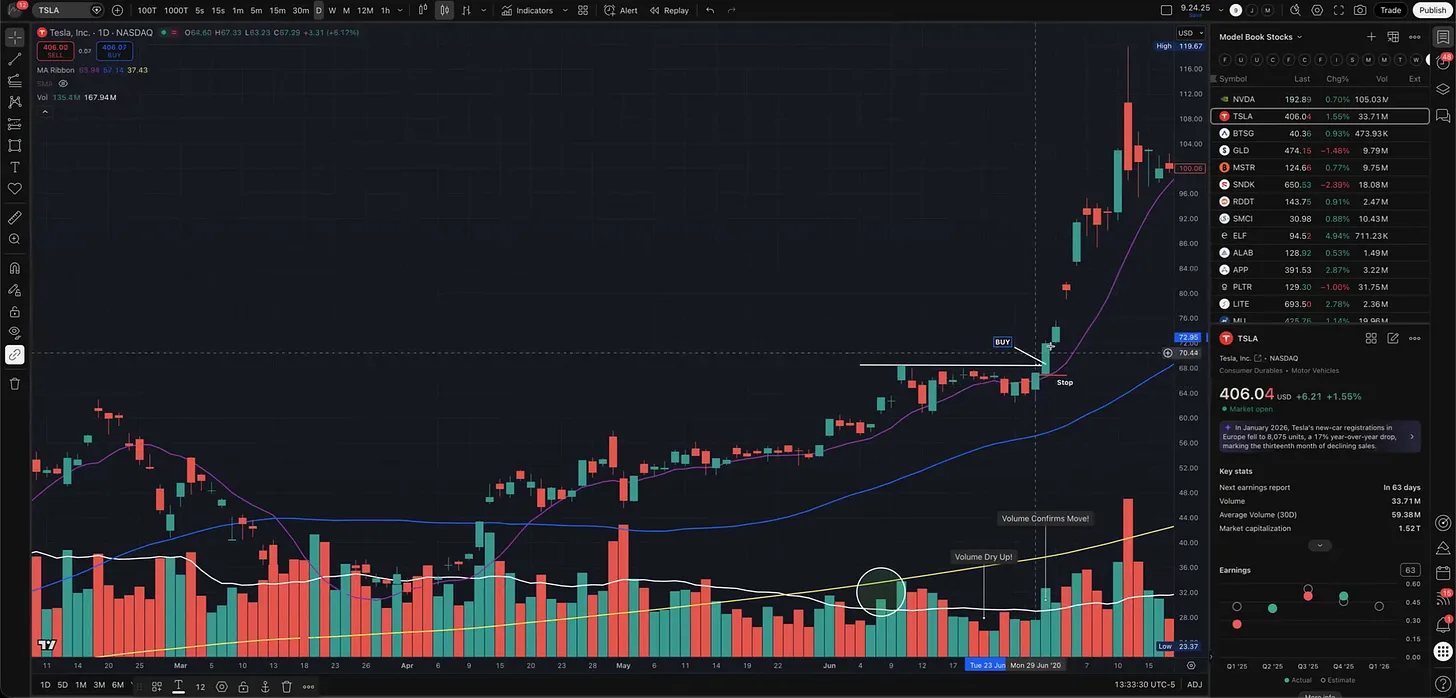
Sep 17, 2026 · Legendary Traders
4 Legendary Traders. 4 Breakout Entry Tactics.
A chart-by-chart breakdown of Minervini’s VCP, O’Neil’s cup with handle, Darvas’s box breakout, and Kullamägi’s opening range breakout.
- how to make money in stocks
- IBD
- Momentum Trading
- VCP
- technical analysis
- CANSLIM
- Trading Setups
- position trading
Sep 6, 2026 · Legendary Traders
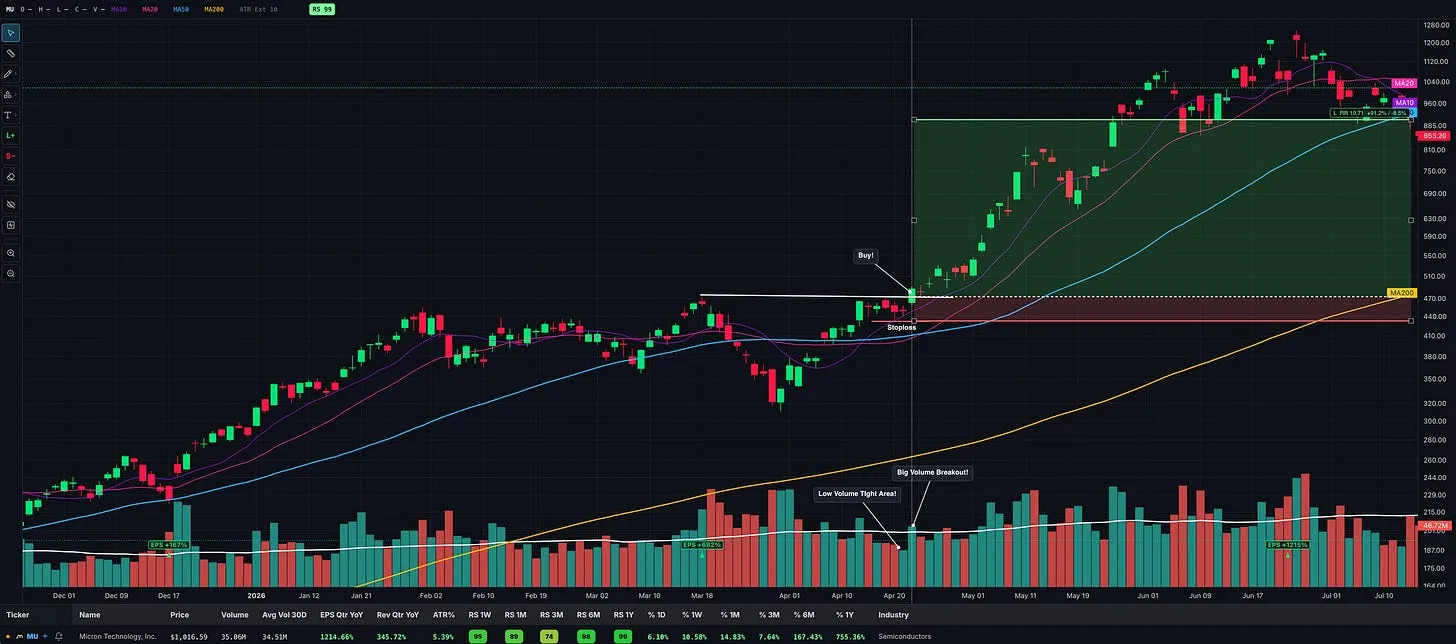
Market Wizard David Ryan: How He Made 1,379% in Three Years
Inside the growth-stock approach of William O’Neil’s protégé and three-time U.S. Investing Champion, from precise entries to holding major winners.
- IBD
- fundamental analysis
- Learn Trading
- technical analysis
- position trading
- David Ryan
- Market Wizard
- CAN SLIM
Aug 29, 2026 · Legendary Traders
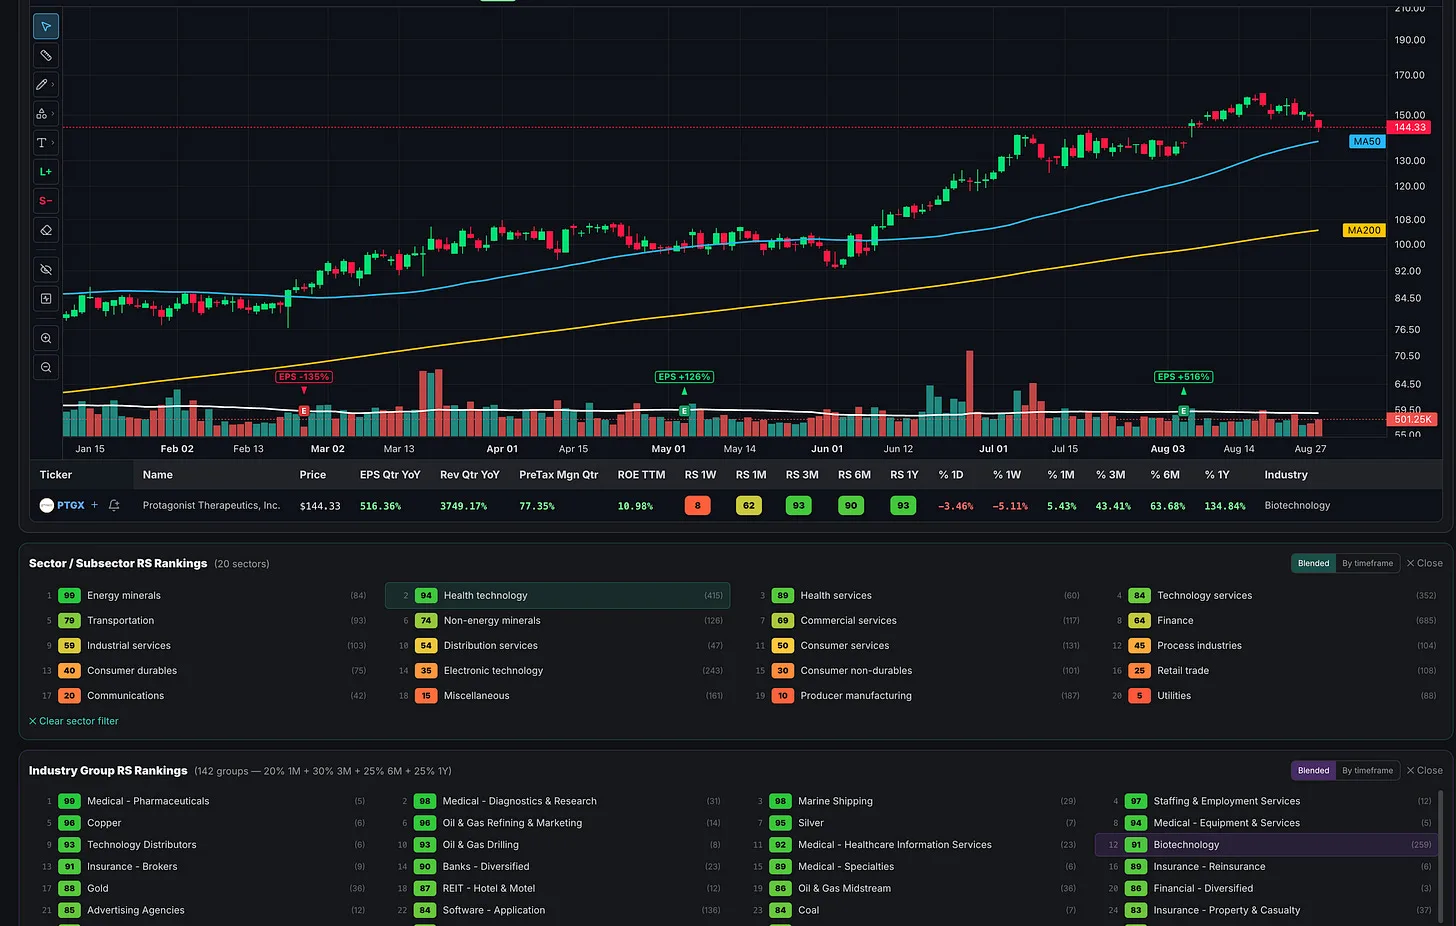
Why the Market’s Biggest Winning Stocks Rarely Move Alone
Lessons from Nicolas Darvas, William O’Neil, and Mark Minervini on using industry-group strength and relative strength to find new market leaders without getting whipsawed.
- growth stocks
- CANSLIM
- position trading
- David Ryan
- stock trading
- Kristjan Kullamägi
- Nicolas Darvas
- industry groups