
Trading articles/The Minervini Blueprint: The SEPA Framework And Volatility Contraction Pattern That Turn Small Accounts Into Superperformers
Apr 2, 2026 · Momentum Trading Strategy
The Minervini Blueprint: The SEPA Framework And Volatility Contraction Pattern That Turn Small Accounts Into Superperformers
The SEPA, VCP, and risk rules behind a 33,500% run and how to adapt them to your own trading
Originally published on Substack.
Why Most Traders Never Escape “Almost There”
You know the pattern.
You spend hours researching stocks and building a list of quality names. You spot a “perfect” base. You size up, hit buy, and watch the stock finally move your way. For a day or two the P&L looks good. Then something changes.
A little pullback. You hold. Another red bar. Volume picks up. The stock you loved is suddenly all over the place. You hesitate, rationalize, maybe even add a little lower. A few weeks later you are staring at a bigger loss than you ever intended, promising yourself you will “be more disciplined next time.”
Most traders live in that loop for years.
Mark Minervini started there too. He was a junior‑high dropout with a few thousand dollars, no Wall Street job, and six straight years of net losses. What changed his trajectory was not a magic indicator. It was building a complete, testable system SEPA that told him exactly what to buy, when to buy, how much to risk, and when to get out.
That system turned into a 33,500 percent compounded return over five years and two U.S. Investing Championship titles. It also got him out of the way before multiple bear markets and kept his drawdowns survivable while he compounded aggressively.
This article breaks down the core of that playbook in a way you can plug into your own trading immediately.
The Backbone: SEPA, Or Specific Entry Point Analysis
Minervini’s entire approach is built around one idea: it is not enough to like a stock. You need a specific entry point where reward is large, risk is small, and your exit is defined before you click the button.
That is SEPA.
What SEPA Actually Does
SEPA is a framework that forces you to answer five questions before any trade:
- Is this stock a true leader, fundamentally and technically, or am I bargain‑hunting a laggard?
- Is the longer‑term trend up, down, or sideways?
- Is supply drying up and demand building, or the other way around?
- Exactly where does the setup fail, in price terms?
- How much of my account am I willing to risk if that failure point is hit?
If you cannot answer those cleanly, you do not have a SEPA trade. You have a hunch.
SEPA Stock Checklist
Before buying, a stock should check most of these boxes:
- Stage‑2 uptrend
Price is in a clear advancing phase, not a dead sideways slog or a late downtrend rally. The 50‑day and 200‑day moving averages slope up, and price trades above them. - Leadership and relative strength
The stock is outperforming the market and most of its industry peers. Leaders make new highs while the crowd hunts “cheap.” - Fundamental fuel
Recent quarterly earnings and revenue are growing strongly, often accelerating. Margins are stable or improving. You are not buying “story” alone. - Constructive base, not a train wreck
The current consolidation is typically in the 10–35 percent depth range. A 60 percent crash that “looks cheap” is not a SEPA setup. Deep collapses create heavy overhead supply and serial gap risk. - Healthy volume pattern
Up days and up weeks show higher volume than down days and down weeks. Pullbacks see volume dry up, not spike.
When those elements line up, SEPA first runs the stock through Minervini’s Trend Template to confirm a true stage‑2 uptrend before focusing on the pattern work.
The Trend Template: Minervini’s 8‑Point Filter
Before Minervini even looks at a base pattern, every candidate must pass his Trend Template, a set of eight technical criteria that confirm the stock is in a genuine stage‑2 uptrend. Think of it as the gateway filter: if a stock fails the template, the VCP and pivot work are irrelevant.
The eight criteria:
- Current price is above both the 150‑day and 200‑day moving averages.
- The 150‑day moving average is above the 200‑day moving average.
- The 200‑day moving average has been trending upward for at least one month, and preferably four to five months or longer.
- The 50‑day moving average is above both the 150‑day and 200‑day moving averages.
- Current price is above the 50‑day moving average.
- Current price is at least 25 percent above its 52‑week low.
- Current price is within at least 25 percent of its 52‑week high, and preferably closer.
- Relative strength rank is 70 or higher, and preferably 90 or above.
A stock that clears all eight is technically structured to sustain a meaningful advance. One that clears five or six may still be worth watching, but Minervini’s highest‑conviction trades typically meet most or all of them.
The Holy Grail Pattern: Volatility Contraction Pattern VCP
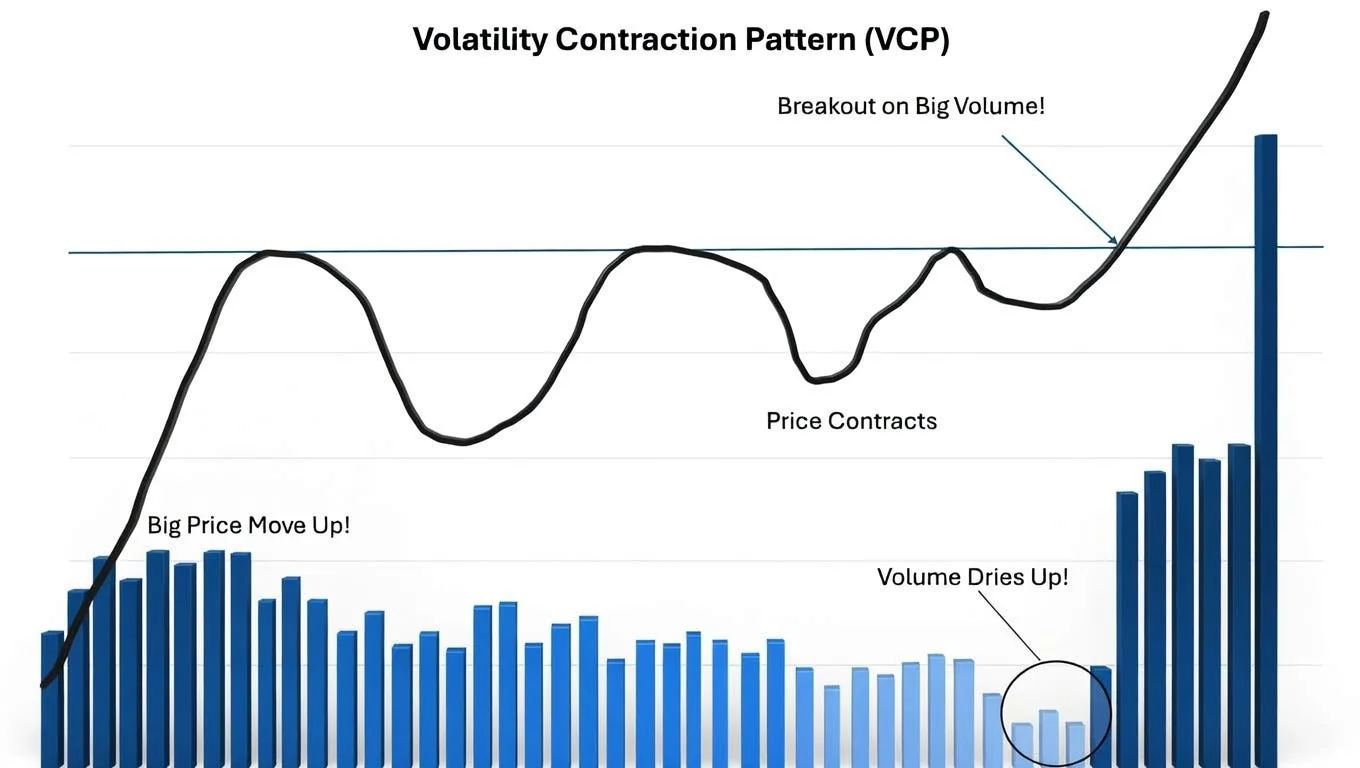
If there is one technical concept Minervini leans on more than any other, it is the VCP. It is not a pattern you memorize visually and then chase whenever price sort of looks right. It is a specific supply‑and‑demand story printed on the chart.
What A VCP Really Shows
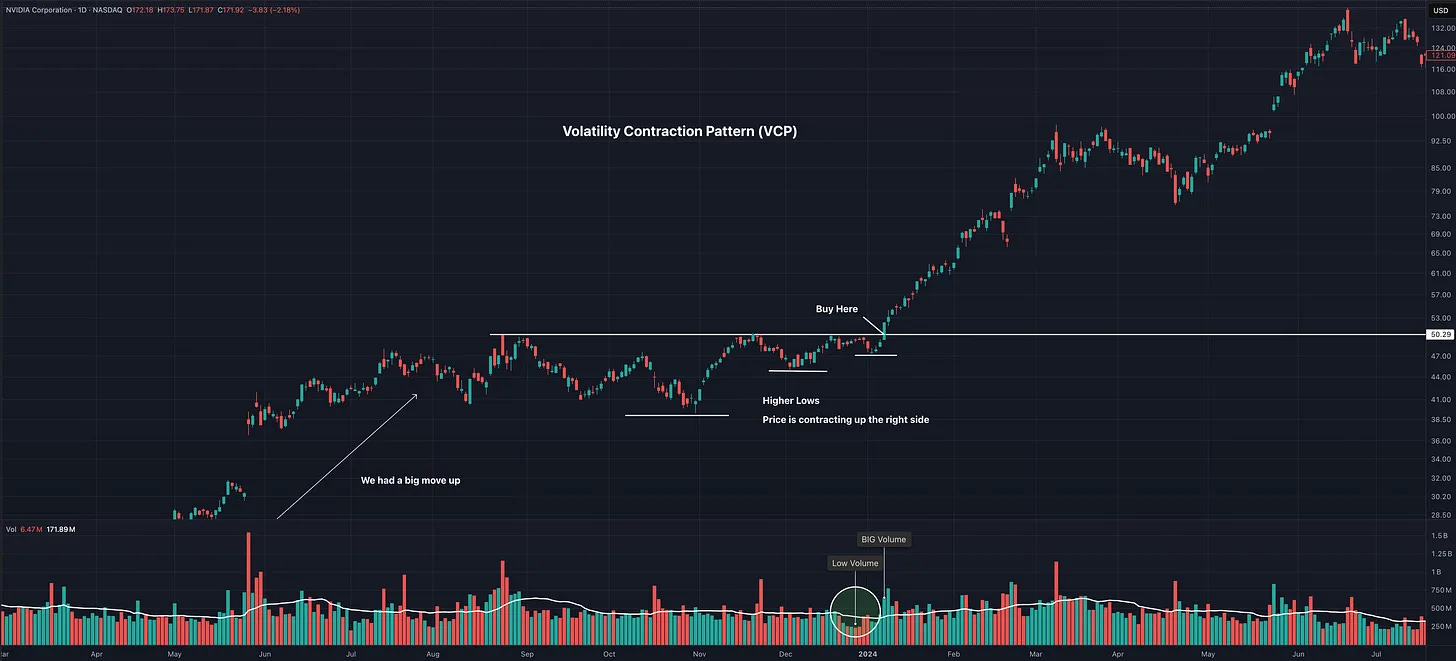
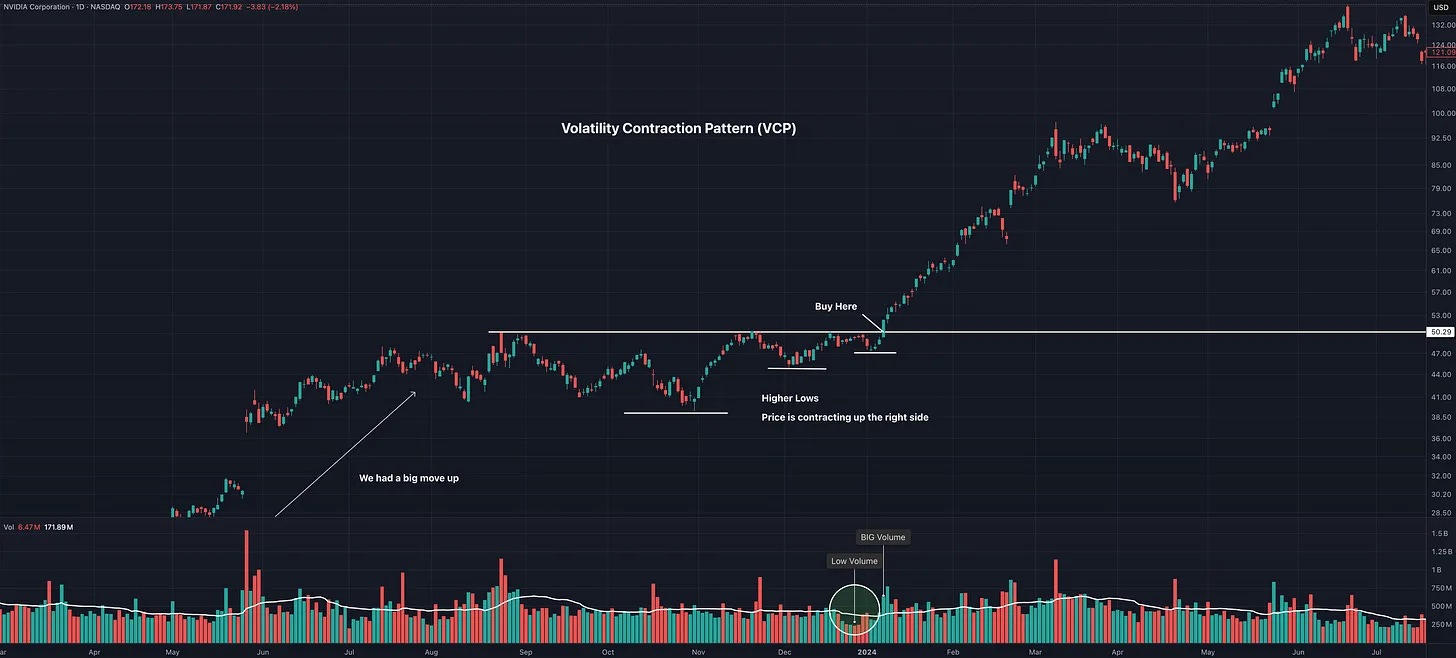
A VCP is a series of price pullbacks that get progressively smaller while volume recedes at key points. Imagine a rally, then a 20 percent correction, then a 10 percent pullback, then an 6 percent dip. Each contraction shakes out weak holders and absorbs overhead supply. Each bounce proves demand is still there.
By the time you reach the buy point of a mature VCP, three things are true:
- Sellers are largely exhausted.
- Price ranges have tightened dramatically.
- A relatively small burst of demand can drive price into new high ground.
That is exactly where SEPA wants to enter: at the point where supply is dry and the path higher has the least resistance.
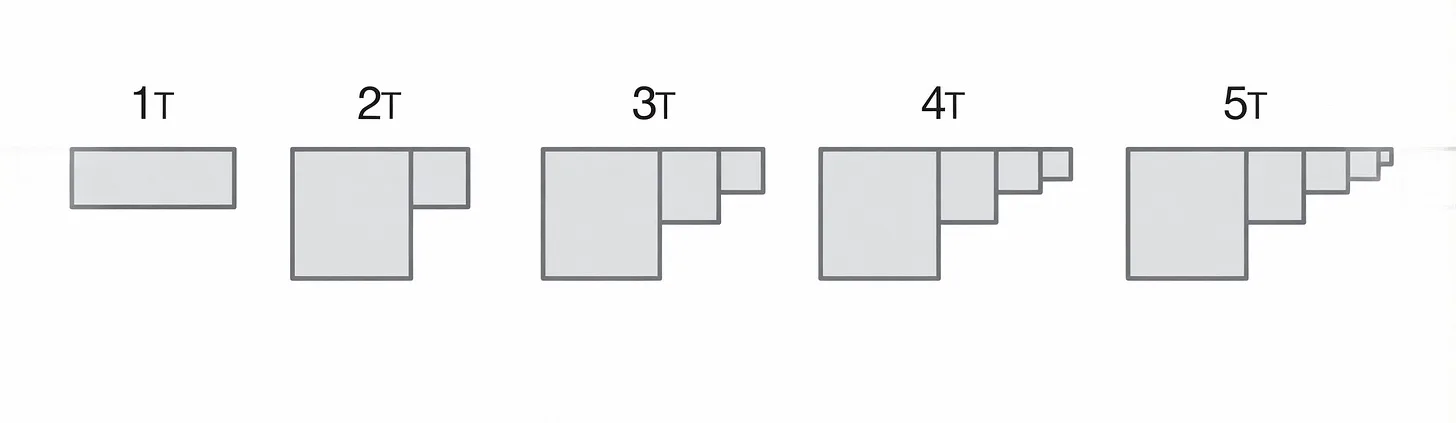
Visualizing successive volatility contractions: each additional ‘T’ shows another, smaller tightening step in the base, from the initial wide range (1T) to a very tight pivot zone (5T).
VCP Quick Rules You Can Apply Tomorrow
To turn VCP from a “cool idea” into something testable, here is a rule‑based view:
- Number of contractions
Look for at least two, usually three to four distinct pullbacks within the base. More than six is rare and could mean tiring structure rather than ordered accumulation. - Depth progression
The first contraction off the high might be 20–30 percent. The next is typically around half that depth. The final contraction on the far right is often in the single‑digit percent range. - Volume behavior
Volume contracts noticeably at the tightest points, especially on the right side of the base. You want to see “volume dry‑ups” where trading is the lightest since the prior thrust began. - No time compression V‑spike
The right side should not be a straight, V‑shaped rocket back to the highs. That kind of time compression often fails. Healthy VCPs take time and show symmetry. - A clean pivot price
There is a clear inflection level where a push through resistance would represent a fresh breakout on big volume into new ground. That is your pivot.
When all of those elements are present, SEPA is ready to execute around the pivot.
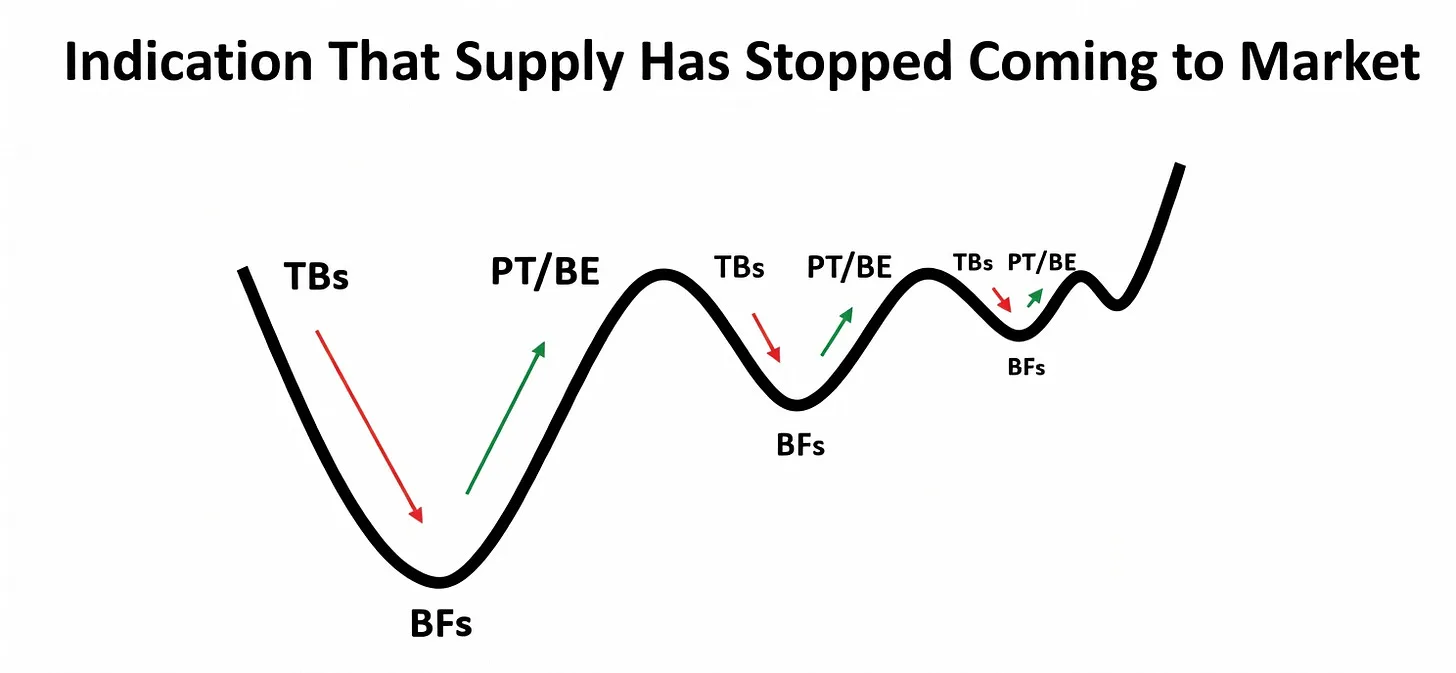
TBs = Trapped Buyers
PT/BE = Profit Takers and Break‑Even Sellers
BFs = Bottom Fishers (new buyers stepping in near perceived lows)
Entries And Stops: “Danger Point” And Pilot Buys
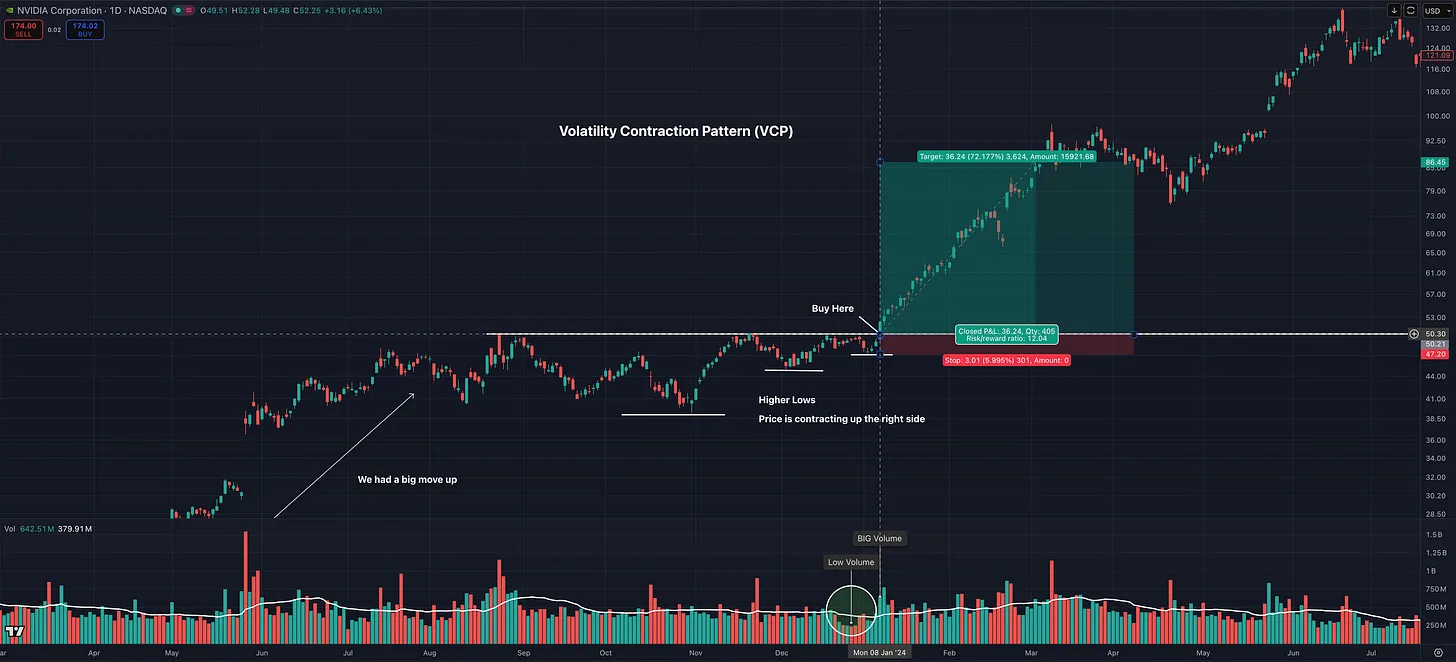
The whole point of all this pattern work is to anchor risk around a precise danger point, the price level where your thesis is clearly wrong.
Defining The Danger Point
In a mature VCP:
- The danger point is usually just below the low of the last contraction, the pivot area, or a key short‑term moving average that defines support.
- If price breaks that level with authority, the assumption of drying supply and emerging demand is no longer valid.
You want to enter as close to that danger point as possible, so that:
- Your stop can be tight without choking the trade.
- Your dollar risk per share is small.
- Your reward‑to‑risk ratio is high if the breakout runs.
Minervini would rather be stopped out for a small loss five times than hold one undisciplined loser that erases a month of work.
Why Pilot Buys Matter
Minervini does not treat every breakout the same. For most good, but not absolutely elite, setups he will begin with a pilot position at the pivot and only build size if the stock immediately behaves the way a true leader should.
In practice that means:
- Start with an initial position into the breakout.
- Require constructive follow‑through over the next few days: up closes, tight pullbacks, and supportive volume.
- Add only if the stock proves itself, either by continuing higher or by testing the breakout area and snapping back quickly.
For his very best VCP setups in a strong market, he is willing to be much more aggressive right off the bat, especially when he already has a profit cushion. That is where he applies the Soros idea of “using profits, not principal”: when trades have been working and his account is ahead, he presses harder with larger initial positions in A‑plus setups, while his risk is still tightly defined against the danger point and the pattern has already wrung out most of the supply.
When conditions are mixed, a new bull market is just emerging, or he does not yet have that cushion, pilot buys become more valuable. They let him test whether his read on the market and on a stock is correct while keeping risk financed conservatively at both the trade and portfolio levels.
Used this way, pilot buys:
- Keep you from being emotionally and financially overcommitted to marginal breakouts.
- Let you reserve your largest initial size for the rare VCPs that line up perfectly on trend, structure, and market conditions, while still scaling into strength rather than hope.
Risk: The Non‑Negotiable Edge
Ask most traders about their favorite pattern and they will talk for an hour. Ask them how much they risk per trade and where their stop is and they get vague. That is exactly backward.
Minervini starts every trade with one question: “Where is the exit if I am wrong?”
Hard Stops And Small Losses
His approach is simple and uncomfortable:
- Every position has a predefined stop when entered.
- That stop is set where the chart says the pattern is broken, not where the loss “feels” tolerable.
- When the stop is hit, he is out. No debate, no “just a little more room.”
You do not need 80 percent winners with this approach. If you can:
- Keep average losses small and consistent,
- Let winners be meaningfully larger than losers,
- Maintain a reasonable hit rate,
you can produce serious returns with modest accuracy.
Position Size And Concentration
Minervini is not a fan of owning twenty “ideas.” He prefers a focused book of his best setups, sized so that:
- A routine stopped‑out trade is just a small, acceptable dent in equity.
- A string of losers is psychologically survivable.
- Big winners move the needle for the overall account.
The sequence is always the same:
- The chart defines the stop first, usually just below the most recent higher low or key support in the VCP structure. Typical risk is kept around 5–6 percent or less, with an absolute ceiling near 10 percent.
- Given that stop distance, he calculates how many shares fit within a fixed fraction of his equity at risk on the trade, generally about 1.25–2.5 percent of total equity.
In practice this leads to:
- “Full” positions often built up to roughly 20–25 percent of the portfolio in a single true leader when conditions are ideal and the stock has proven itself.
- Very occasional, more aggressive sizing in special situations, but still constrained so that the dollar risk on any one trade stays within that same 1.25–2.5 percent equity band.
- A cap on total portfolio exposure that flexes with market conditions: when he is not in sync or a new bull market is just emerging, he trades smaller and less; when he is in rhythm and the market is healthy, he allows himself to be more aggressive.
The point is not to copy his exact percentages but to make your own numbers explicit, written down, and non‑negotiable.

Selling: Locking In Gains Before The Market Takes Them Back
Buying is fun. Selling is where most equity curves go to die.
Minervini treats selling as a skill set of its own.
Main Sell Modes
Once a trade is on and working, there are really only two ways a profitable position ends:
Selling into strength
- The stock does what it is supposed to do.
- It becomes extended above its moving averages.
- It shows signs of a climax run or frothy action.
- You systematically scale out into that strength, locking in gains while buyers are still eager.
Financing risk with partial profits
- Once the stock is 2–3 times above your initial risk (a 2R–3R gain), you sell a partial position into strength.
- The realized profit “finances” the risk on the remaining shares, which you now treat as a free roll.
- After the first normal pullback and a push to new highs, you raise your stop toward breakeven or better and begin trailing it, so further upside is a bonus, not a requirement.
Selling into weakness to protect equity
- The stock fails to follow through after a breakout.
- It triggers specific warning signals: multiple heavy down days, closes below key moving averages, violation of normal “tennis ball” behavior.
- You cut or reduce before the open profit bleeds meaningfully back, rather than hoping a damaged winner will recover.
Core principle
One of his core principles: once a stock has given you a substantial gain, you should not allow it to round‑trip all the way back to a loss; at worst, your stop is lifted toward breakeven or into profit territory and any additional upside is treated as a bonus.
Simple Profit‑Protection Rules You Can Adopt
You can translate his ideas into concrete rules such as:
- After a position reaches roughly three times your initial stop distance in profit, ratchet your stop to around breakeven or better.
- Watch the 20‑day moving average after a breakout; early, heavy closes below it are a red flag.
- Be alert when you see three or more lower lows from a post‑breakout high on increasing volume, especially if those lows violate recent support.
- Pay attention to “low volume out, high volume in” patterns: a weak breakout that immediately fails on heavy selling is a problem, not “volatility.”
These behaviors make it far less likely that a single bad post‑breakout phase quietly erases weeks of incremental gains.
Mindset: The Builder Versus The Wrecking Ball
At this point the patterns and rules might sound clean and simple. In real trading they collide with one thing: your own head.
Minervini likes to say that inside every trader there are two personas.
The Builder
- Follows a process and refines it.
- Treats each loss as tuition, not proof of personal failure.
- Reviews trades, finds patterns in behavior, and makes small adjustments.
- Can take the same setup a hundred times without getting bored enough to sabotage it.
The Wrecking Ball
- Obsessed with short‑term outcomes.
- System‑hops after every losing streak.
- Adds to losing positions out of ego and “I know this is a good company.”
- Overtrades when emotional and undertrades after a loss, missing the best setups.
Both exist in everyone. Which one runs your trading comes down to habits and preparation.
Practical Ways To Feed The Builder
You do not need therapy to make use of his mental game ideas. You can implement simple routines:
- Plan before the open
Write down: which setups truly meet your criteria, your exact entries, stops, and sizes. If a trade is not on that list at the bell, you do not take it. - Review after the close
Print or save charts of every trade. Mark your entries, exits, and stop levels. Circle spots where you broke your own rules. Patterns in your mistakes will jump off the page. - Detach from single‑trade outcomes
Mentally rehearse both scenarios before entering: the trade works beautifully, and the trade stops out quickly for a small loss. Imagine yourself executing the exit cleanly in both cases. That way, when the loss happens, it is not a shock. - Align strategy with beliefs
If you cannot stomach tight stops and frequent small losses, a Minervini‑style momentum approach may not be congruent for you. He is explicit about this: you must believe in the logic of your own method or your subconscious will sabotage it.
The goal is not to banish fear and frustration. It is to surround them with enough structure that they cannot dictate your trades.
Turning Minervini’s Playbook Into Your Edge
Reading about a champion’s system will not transform your results by itself. Applying even a stripped‑down version of it can.
Here is a practical way to start:
- Define your SEPA‑style filter
Decide on specific, screenable criteria for trend, relative strength, and fundamentals. - Only trade VCP‑like patterns for a while
For the next twenty trades, require clear volatility contraction and a defined pivot in a stage‑2 trend. Treat everything else as noise. - Fix your risk per trade
Choose a risk percentage that feels small but meaningful. Use your danger point to back into position size. Never exceed it. - Pre‑write your exits
Before you buy, write the sentence: “If price closes below X on Y‑type volume or violates Z behavior, I will sell.” Then follow it. - Make every mistake visible
Keep a one‑page summary of all your trades over the next month: setup type, adherence to rules, and outcome. You do not need fancy analytics. You need brutal honesty.
If you do that, you are not just “inspired by” Minervini. You are using his decades of work as your starting point instead of reinventing everything from scratch.
And if you do not, the market has a way of reminding you that inspiration is cheap and tuition is expensive.
From Playbook to Live Strategy
For traders who want to go deeper than a single article, the Momentum Trading Strategy Course is built to operationalize these ideas into a complete, repeatable process. It takes the core principles outlined here and turns them into a structured framework you can actually execute day in, day out. Just as Minervini synthesized what he learned from earlier greats like William O’Neil, William L. Jiler, and Richard Love into SEPA and the Trend Template, this course stands on the shoulders of the same lineage, plus Minervini himself and a handful of other exceptional momentum traders. The result is a cohesive playbook, from idea generation and setup selection to timing entries, sizing risk, and managing winners using the exact concepts discussed in this article.
 Momentum Trading Strategy: The 100-Year Playbook Behind the Biggest Winning StocksMost people approach the stock market backwards.Mar 5, 2026 · Read on Substack →
More in Legendary Traders
All Legendary Traders articles →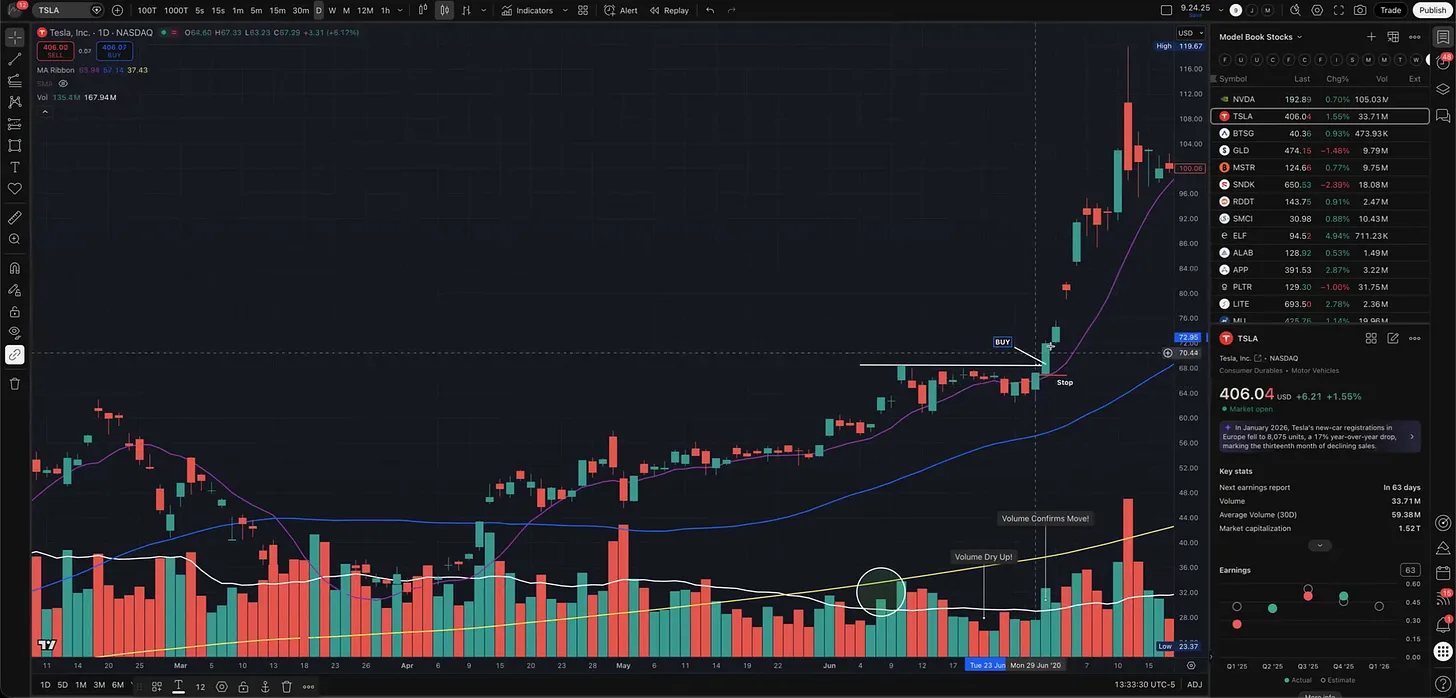
Sep 17, 2026 · Legendary Traders
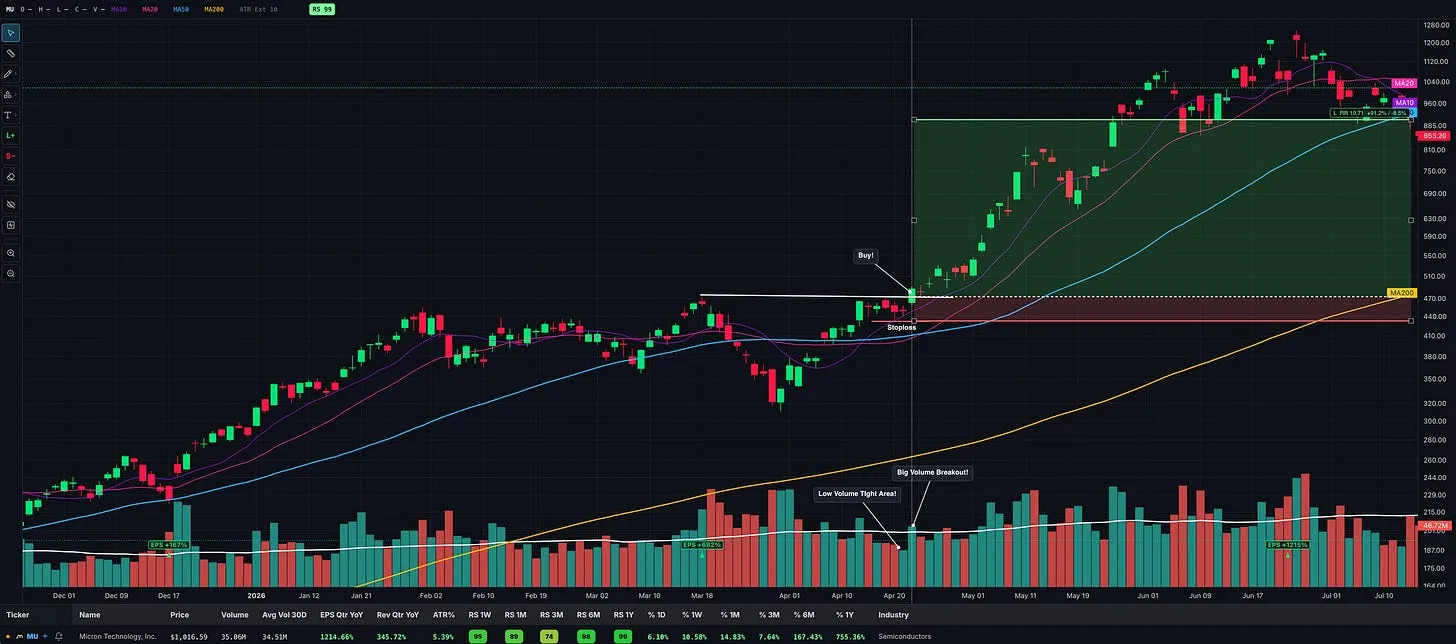
4 Legendary Traders. 4 Breakout Entry Tactics.
A chart-by-chart breakdown of Minervini’s VCP, O’Neil’s cup with handle, Darvas’s box breakout, and Kullamägi’s opening range breakout.
- how to make money in stocks
- IBD
- Momentum Trading
- VCP
- technical analysis
- CANSLIM
- Trading Setups
- position trading
Sep 6, 2026 · Legendary Traders
Market Wizard David Ryan: How He Made 1,379% in Three Years
Inside the growth-stock approach of William O’Neil’s protégé and three-time U.S. Investing Champion, from precise entries to holding major winners.
- IBD
- fundamental analysis
- Learn Trading
- technical analysis
- position trading
- David Ryan
- Market Wizard
- CAN SLIM
Aug 29, 2026 · Legendary Traders
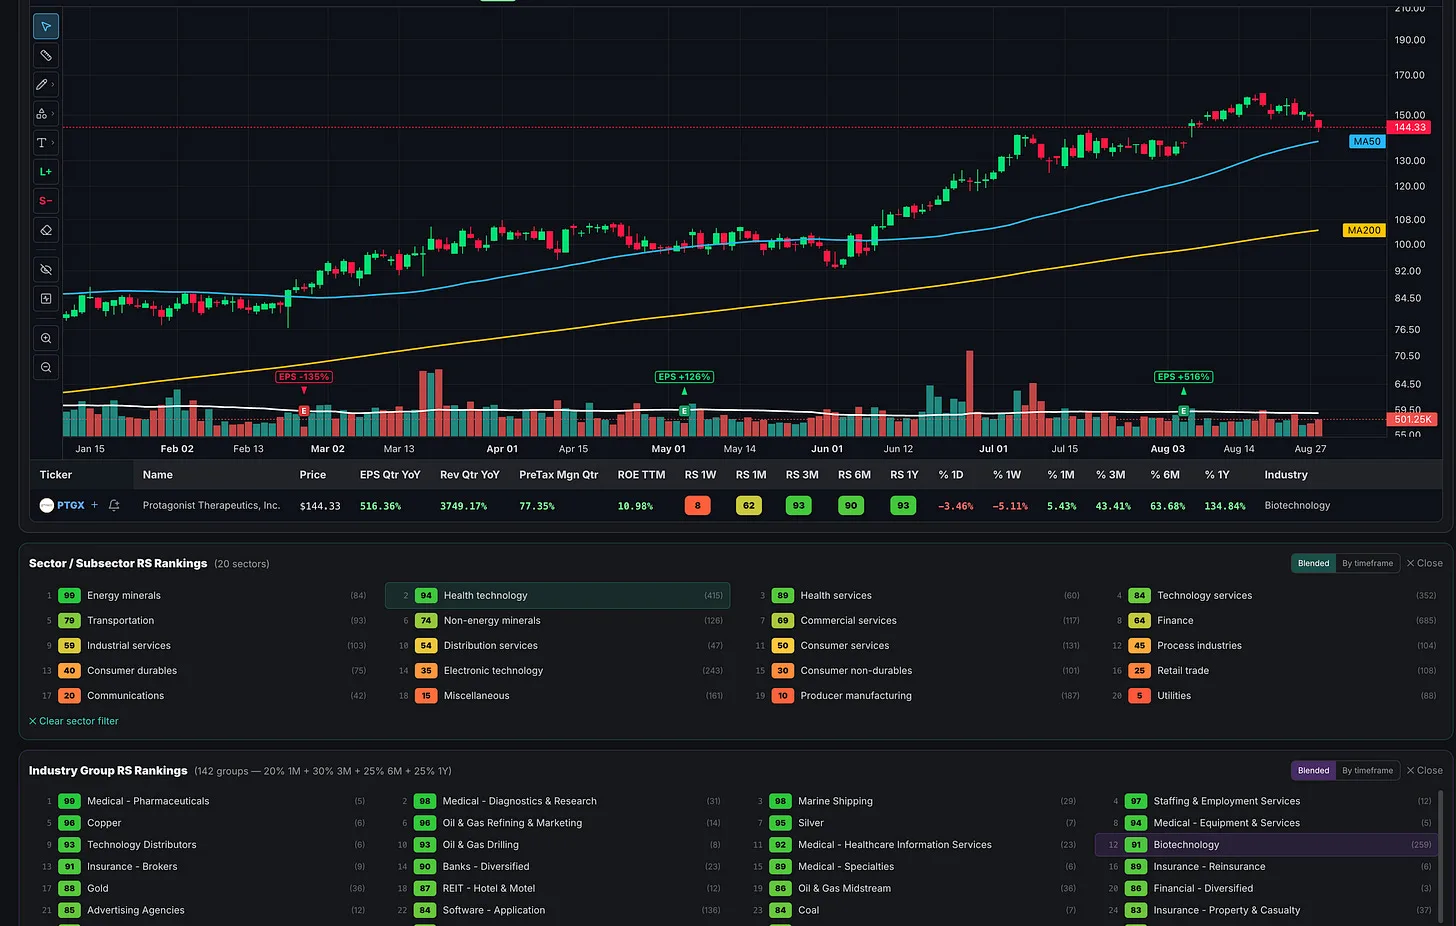
Why the Market’s Biggest Winning Stocks Rarely Move Alone
Lessons from Nicolas Darvas, William O’Neil, and Mark Minervini on using industry-group strength and relative strength to find new market leaders without getting whipsawed.
- growth stocks
- CANSLIM
- position trading
- David Ryan
- stock trading
- Kristjan Kullamägi
- Nicolas Darvas
- industry groups